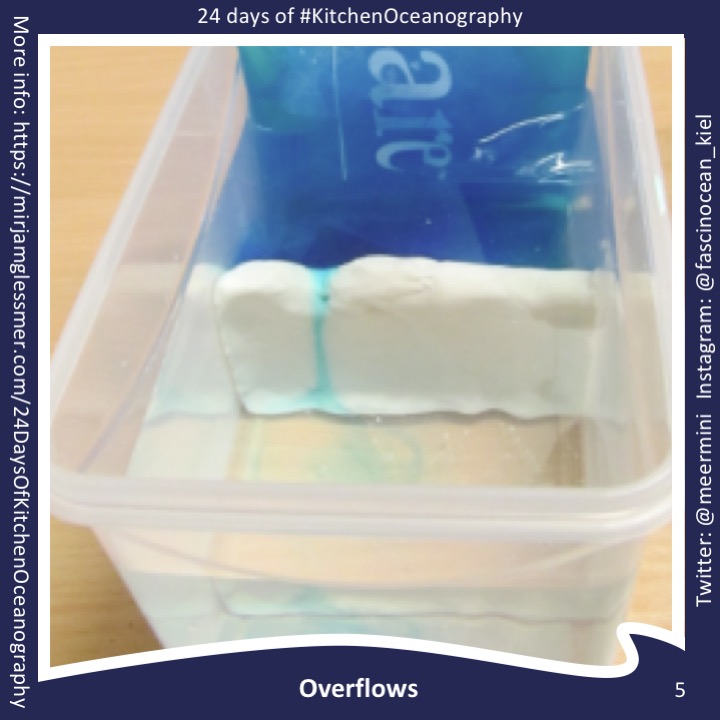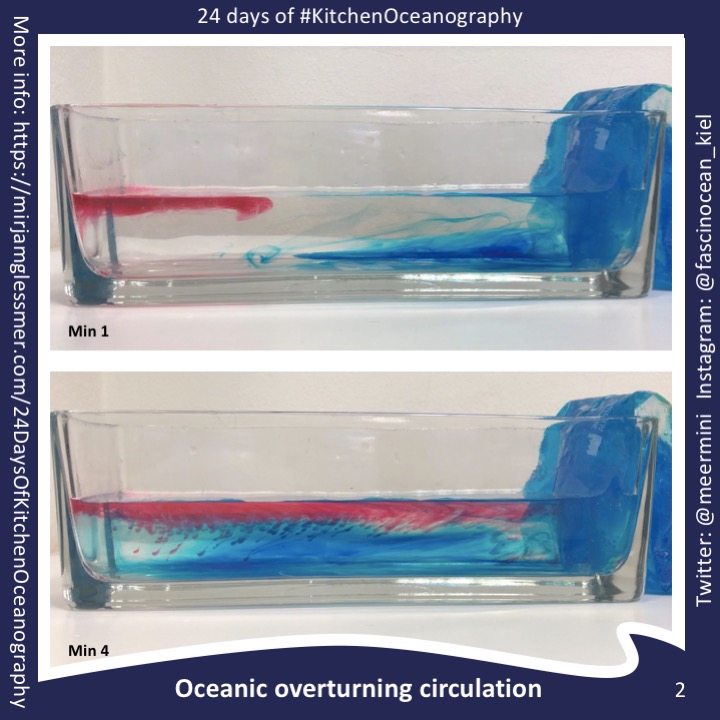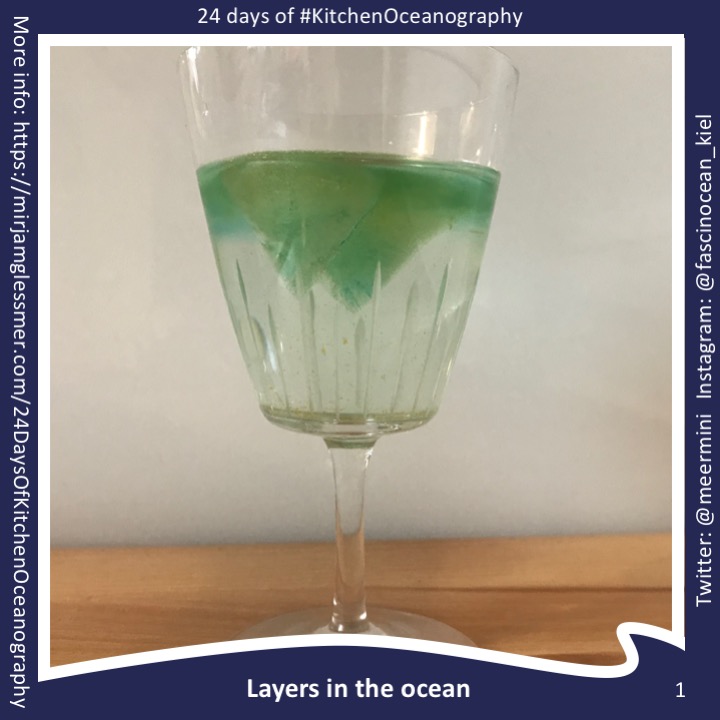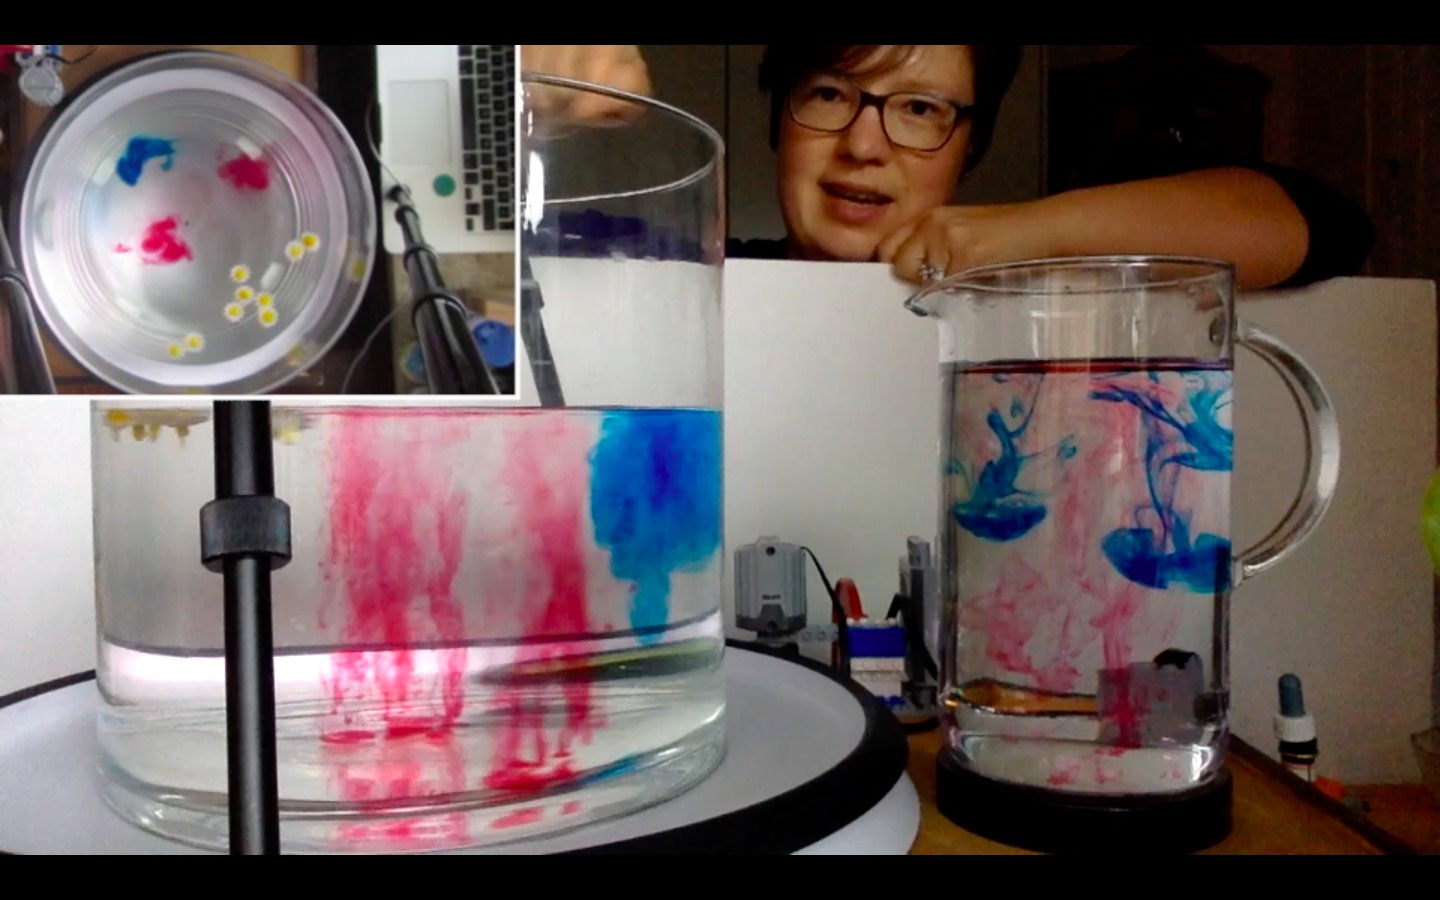
New SERC “Teach the Earth” Activity on “Ocean Currents and Overflows”
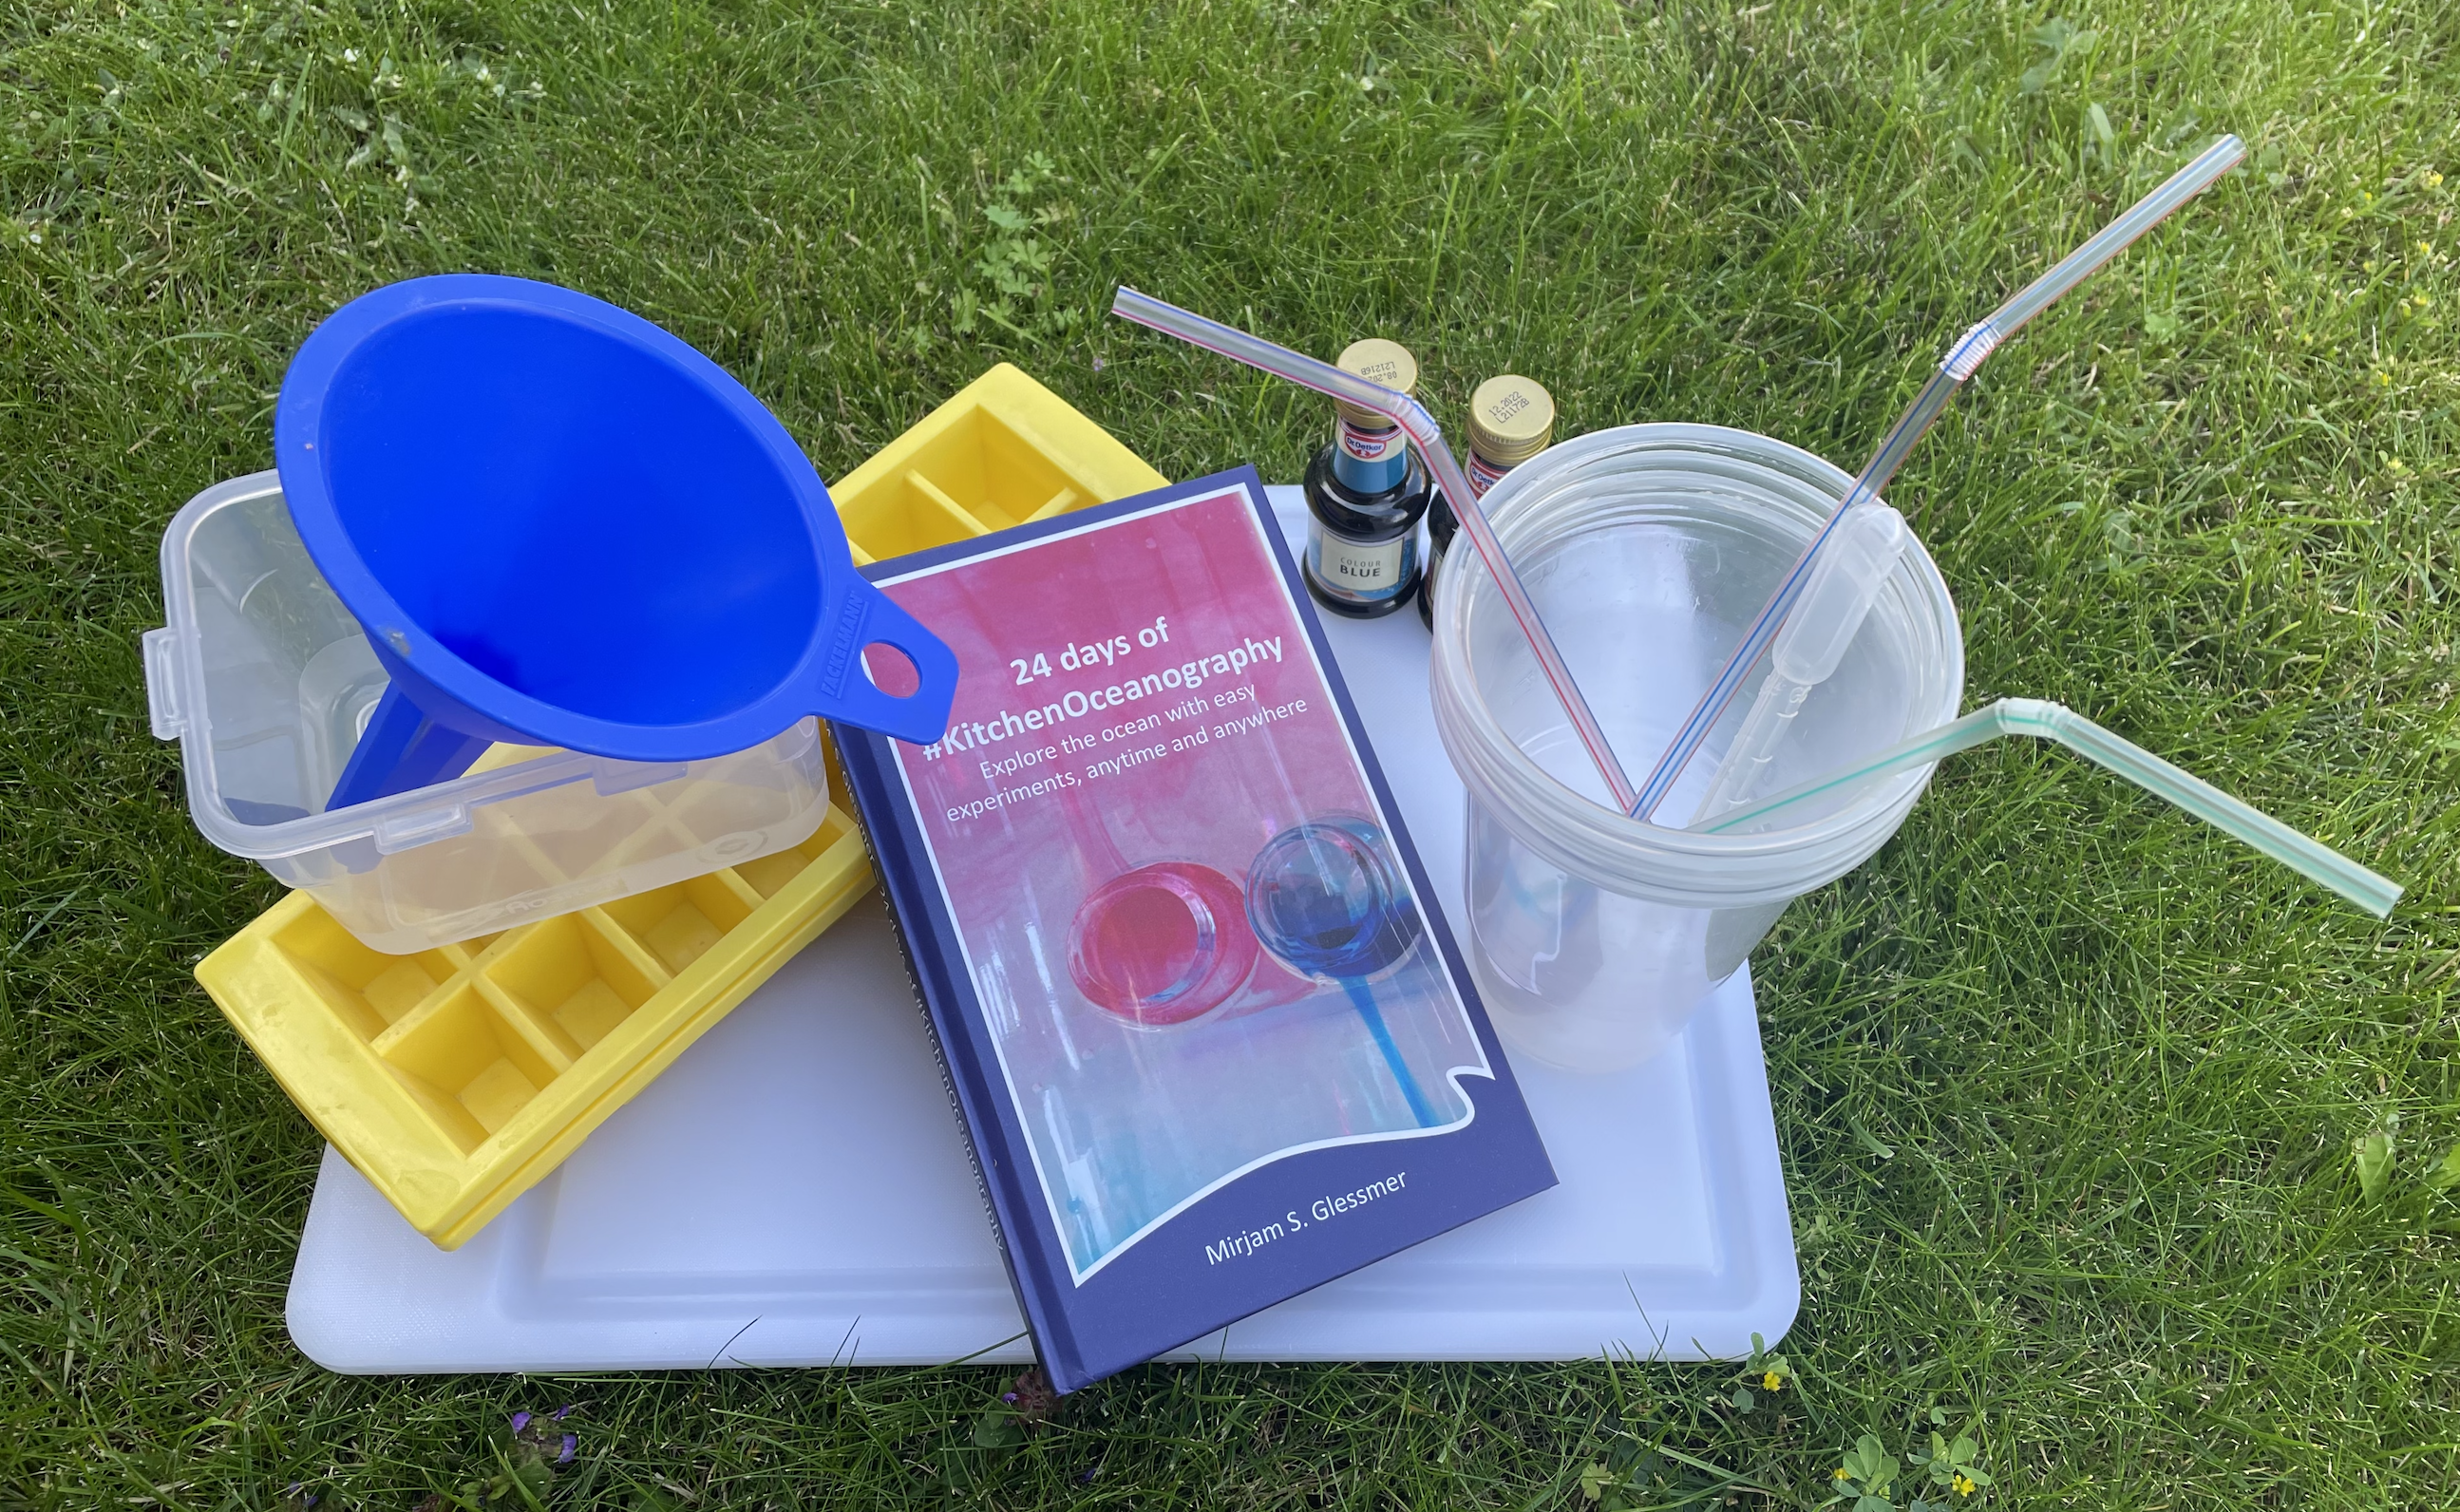
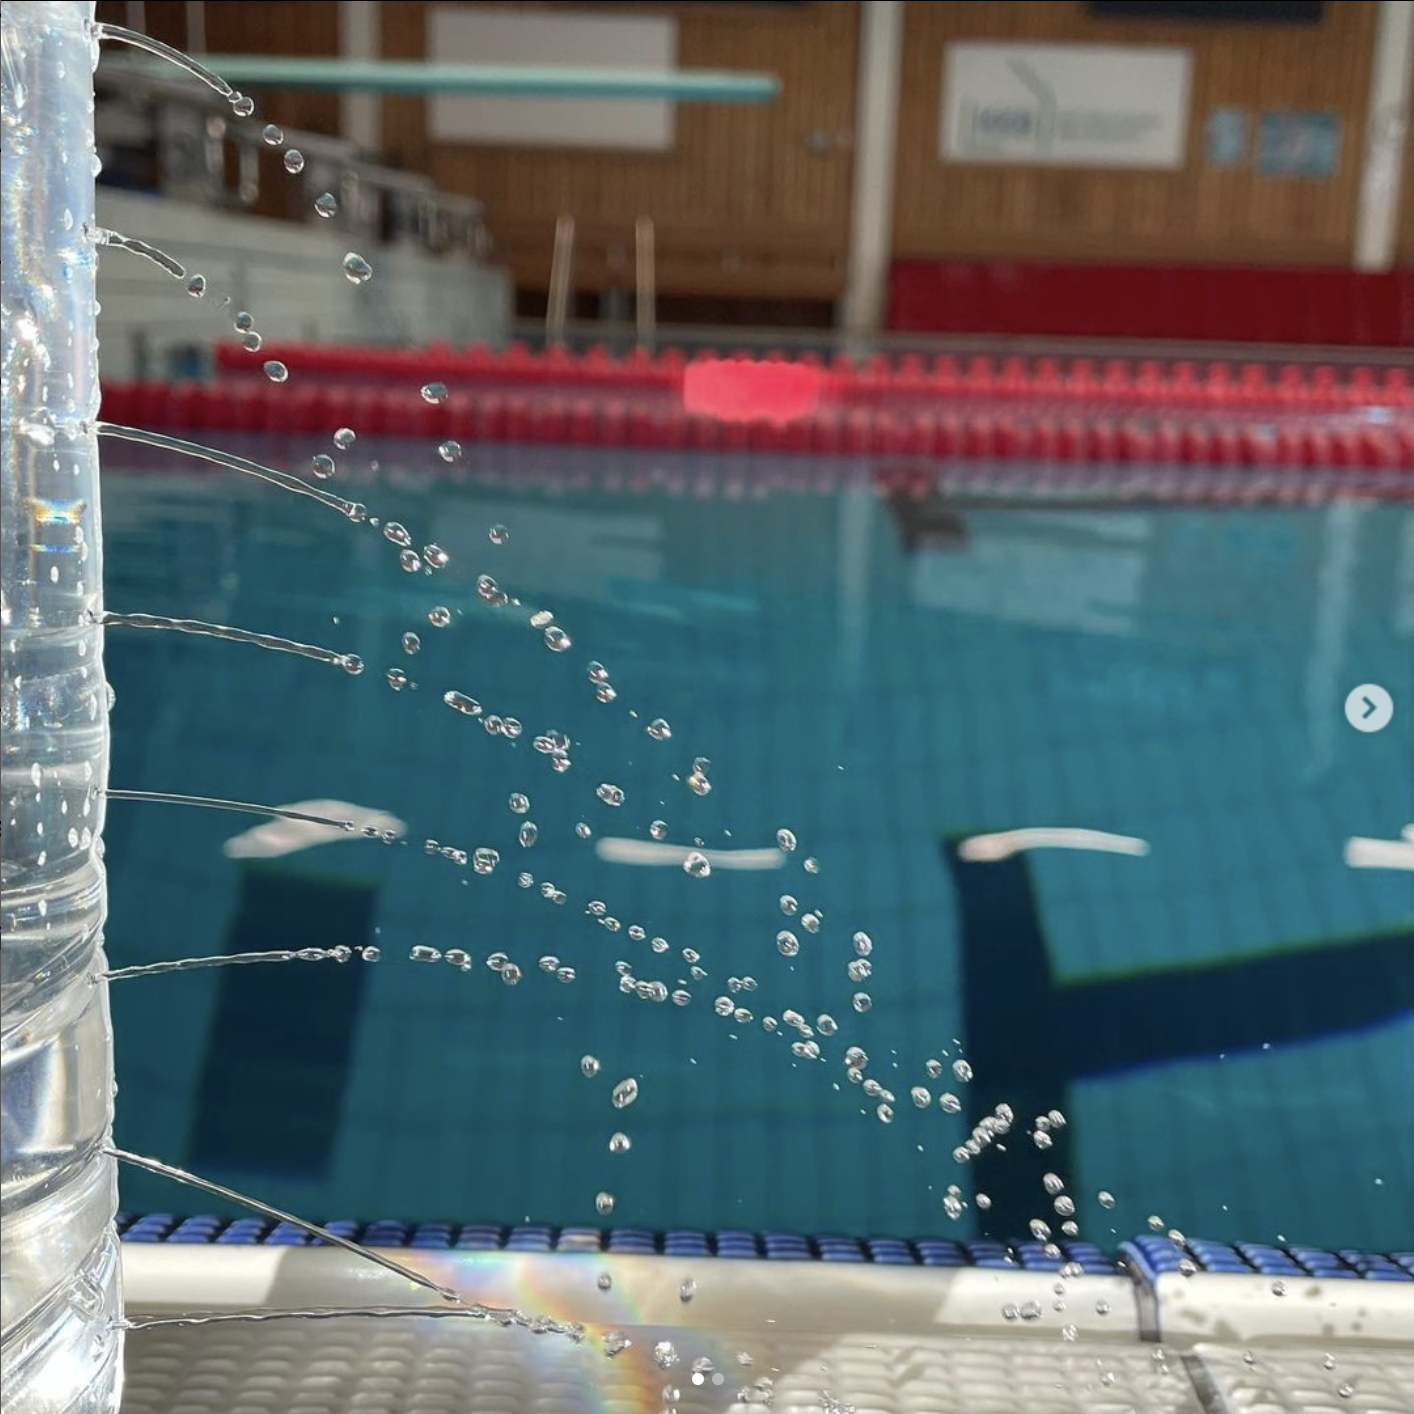
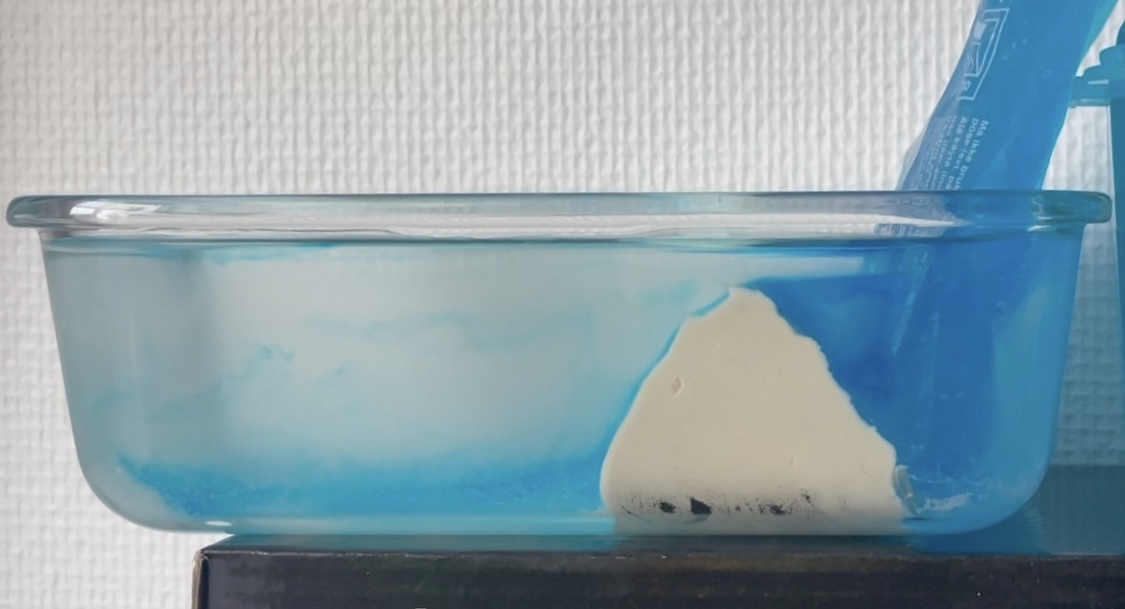
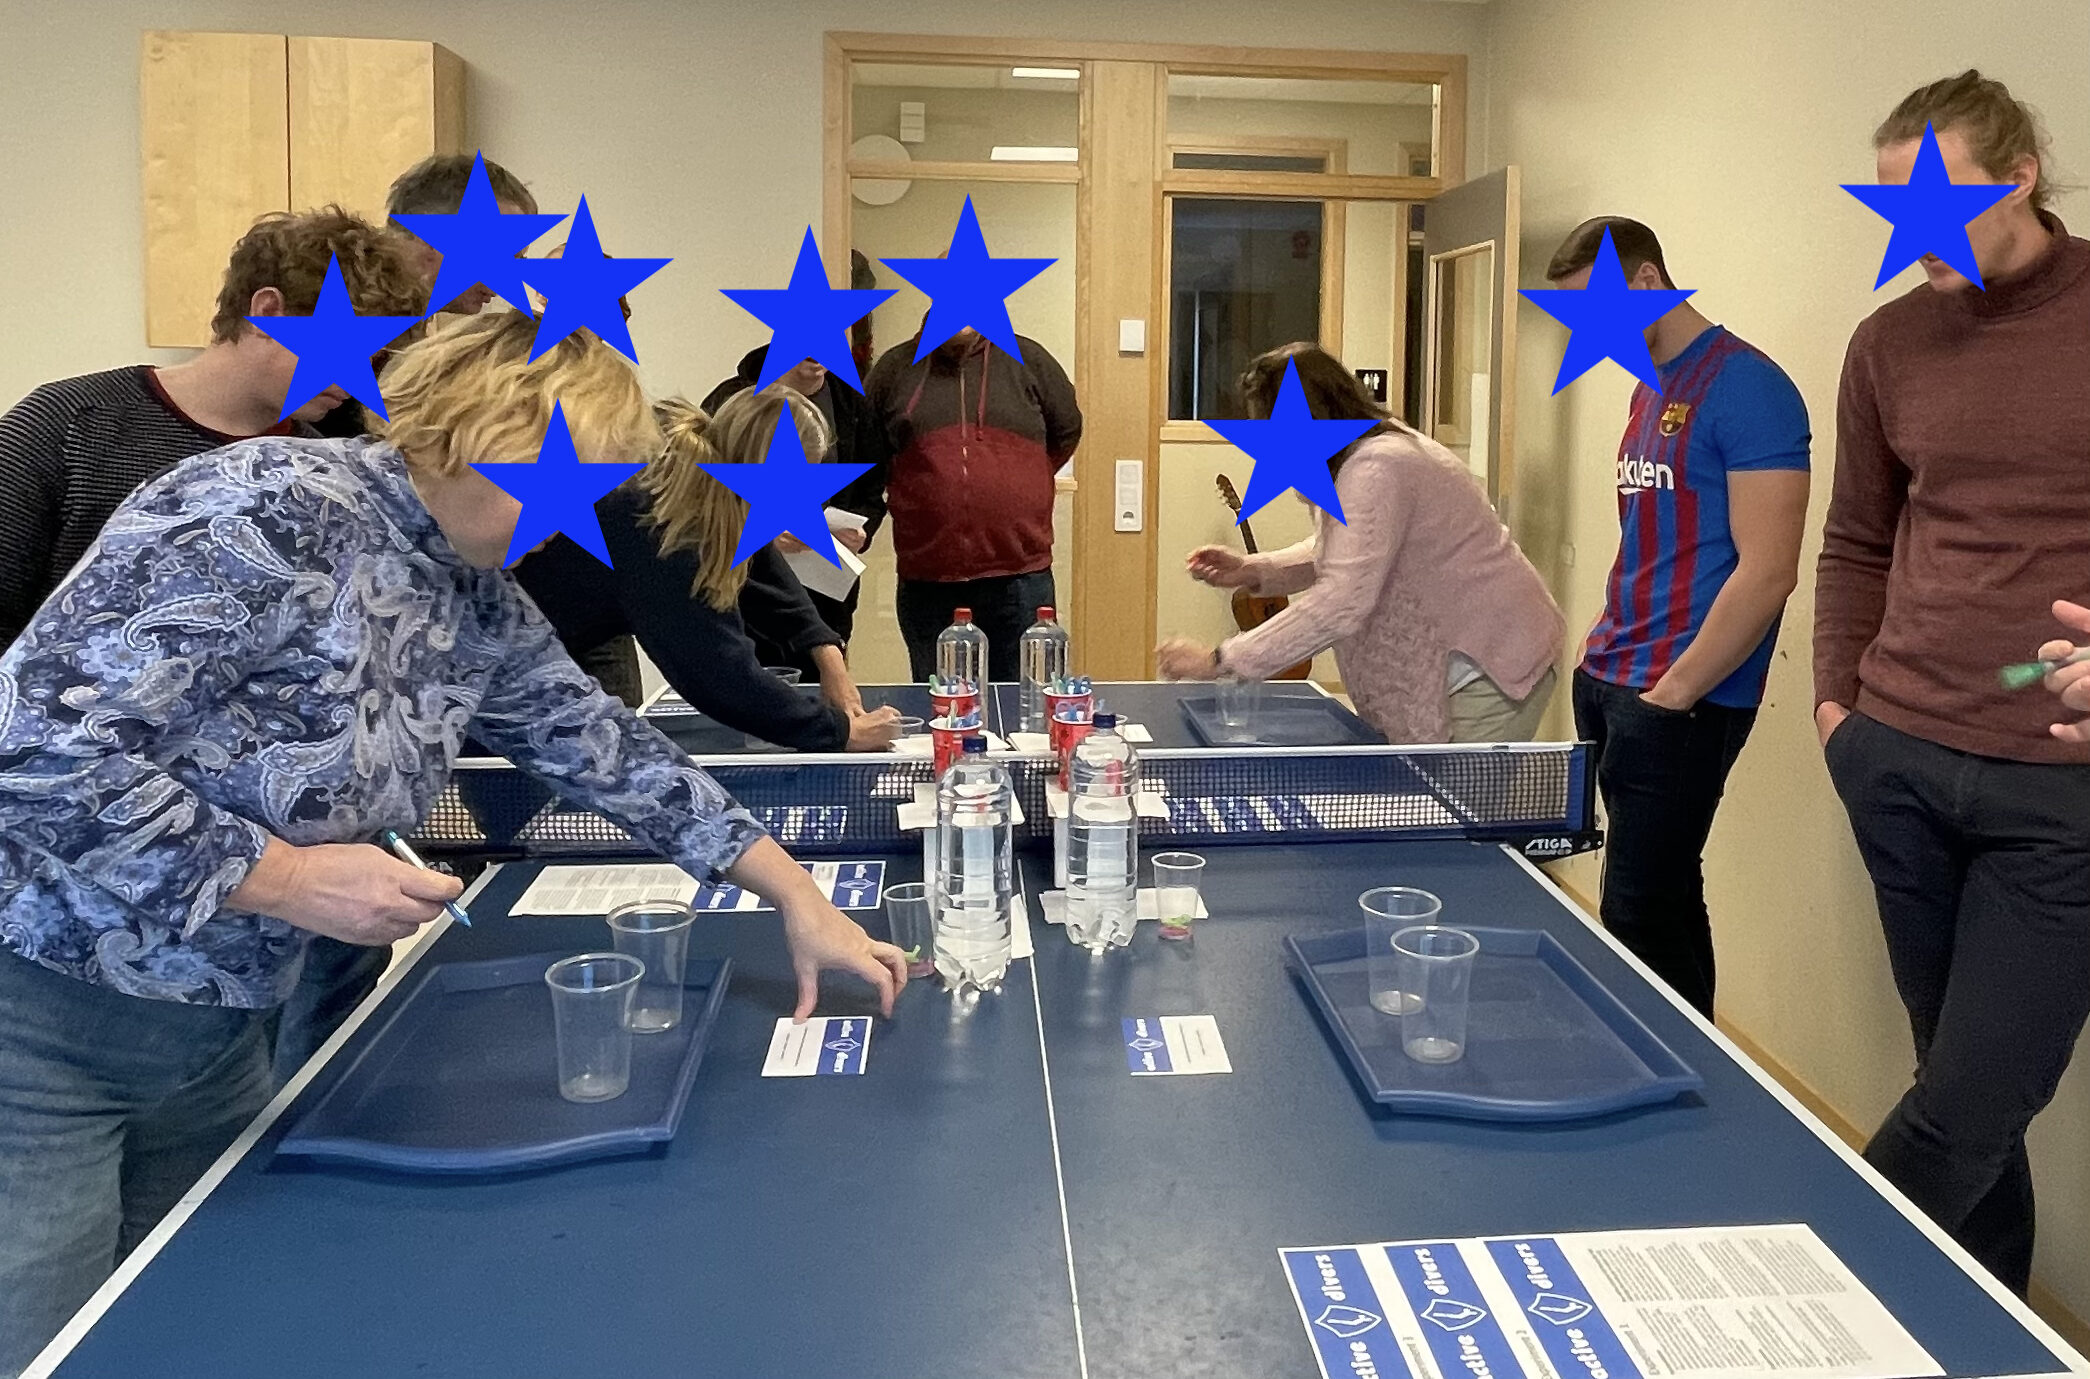
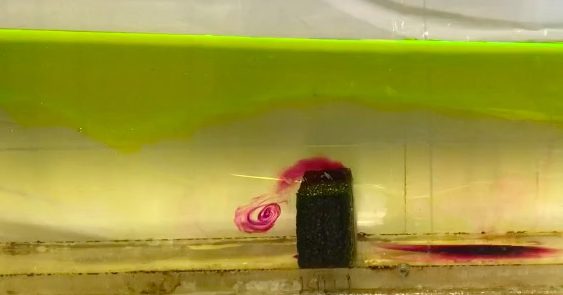
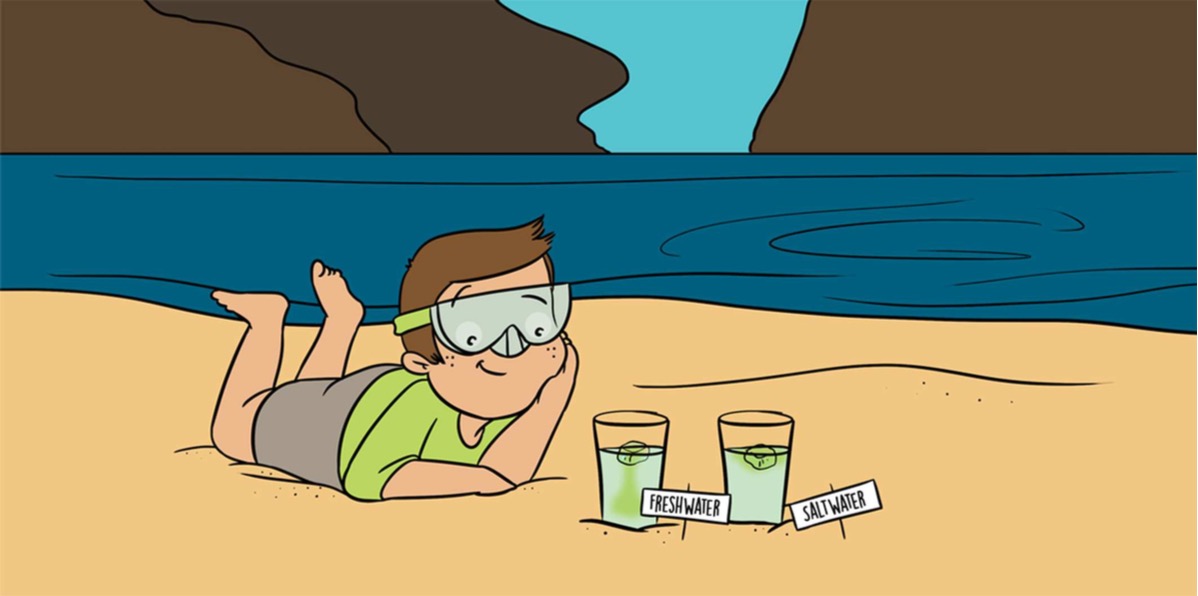
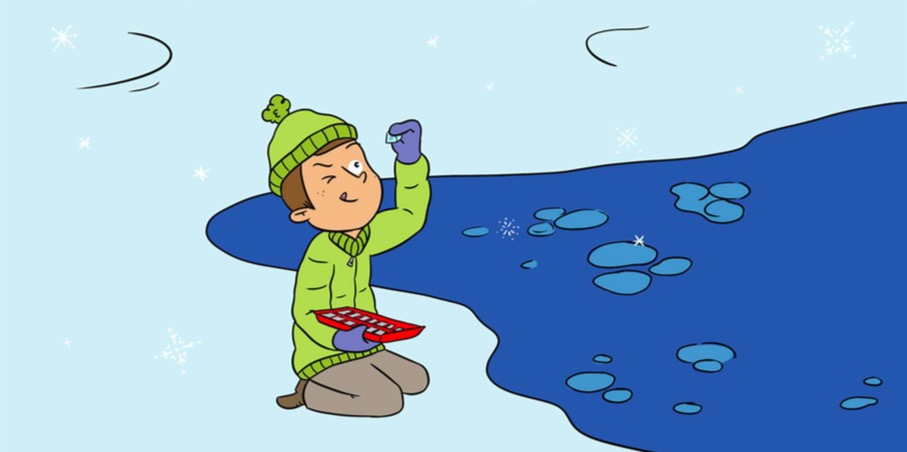
One day in the office at the Geophysical Institute in Bergen last Friday, and for the first time in a long time I am writing a little bit of oceanography and tank experiments again: My colleague Stefanie Semper and I published a SERC “Teach the Earth” activity on “ocean currents and overflows”! This activity is […]