Experiment: Oceanic overturning circulation (the easiest version)
“The easiest” in the title of this page is to show the contrast to a “slightly more complicated” version here.
Background
One of the first concepts people hear about in the context of ocean and climate is the “great conveyor belt”. The great conveyor belt is a very simplified concept of the global ocean circulation, which is depicted as a single current that spans the world oceans (see Figure 1 below). In this simplified view of the global circulation, water flows as a warm, global surface current towards the North Atlantic, where it cools, sinks and finally returns southward and through all the world oceans near the bottom of the ocean. Water is transported back to the surface through mixing processes and starts over its journey again as a warm surface current. While in reality some part of the conveyor belt is wind-driven and many processes come to play together, a large part of the circulation can be explained by the water sinking due to cooling at high latitudes.
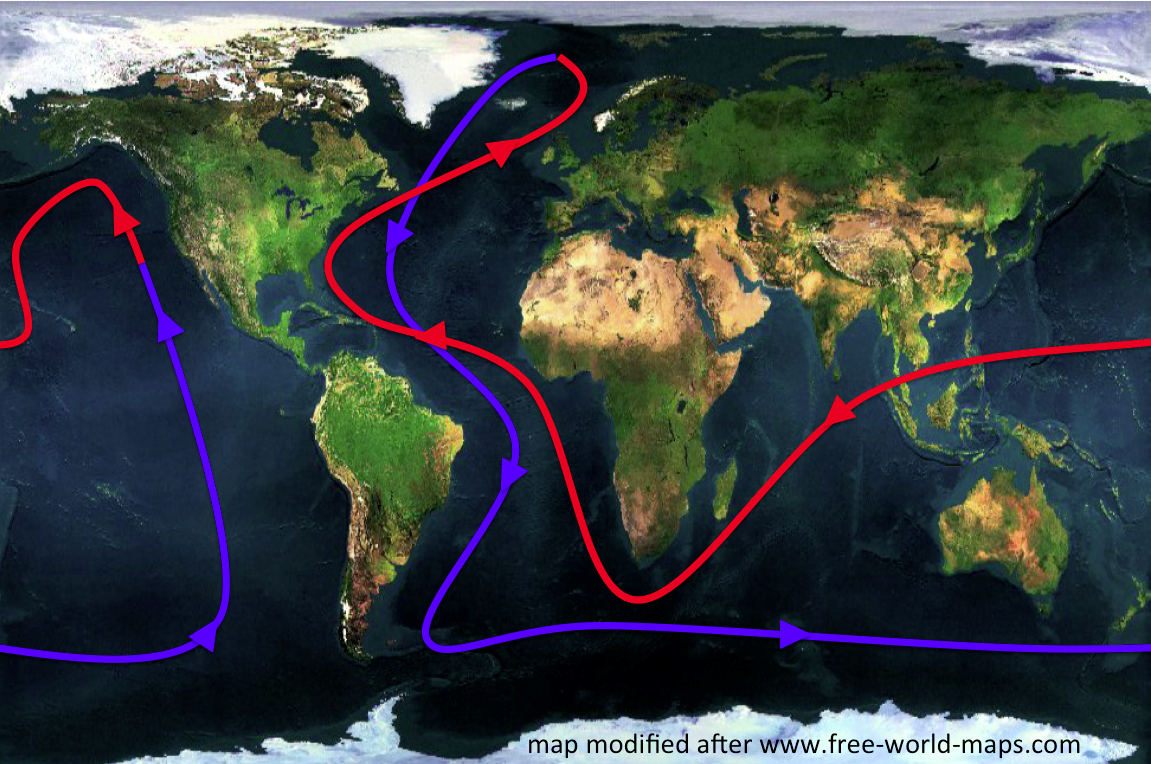
Figure 1: The great conveyor belt. My sketch on top of a map from http://www.free-world-maps.com (used with permission)
The experiment
Since the global conveyor belt is such a basic concept that we come across in many different contexts, it is very useful to have a good demonstration of what is happening in the world ocean. Plus demonstrations and experiments are always fun!
I here present a very simple experiment that can be used for many different purposes. In science outreach, for example on a fair or in a talk, to catch people’s attention and raise an interest in oceanography. In schools to do the same, or to connect the fascination of the ocean to school physics and talk about density, convection, heat. At university to do all of the above, as well as to practice writing lab reports, talk about the scientific method or the validity of simplifications in theoretical or physical models.
Materials needed
All we need to run this experiment is
- a clear plastic container
- lukewarm water
- red and blue food dye
- an ice cube tray and
- access to a freezer.
Ideally we’d also have a thermos or some other kind of insulation to keep the ice cubes frozen until we start running the experiment. To prepare the experiment, all we need to do a half a day ahead is mix some blue food dye into the water that we put in the ice cube tray, and freeze the ice cubes.
Running the experiment
To run the experiment, we start out by filling our “tank” with lukewarm water. Let it settle for a bit. Now we decide for one end of your tank to be the “equator” end. There, we add some red food dye (see Figure 1).
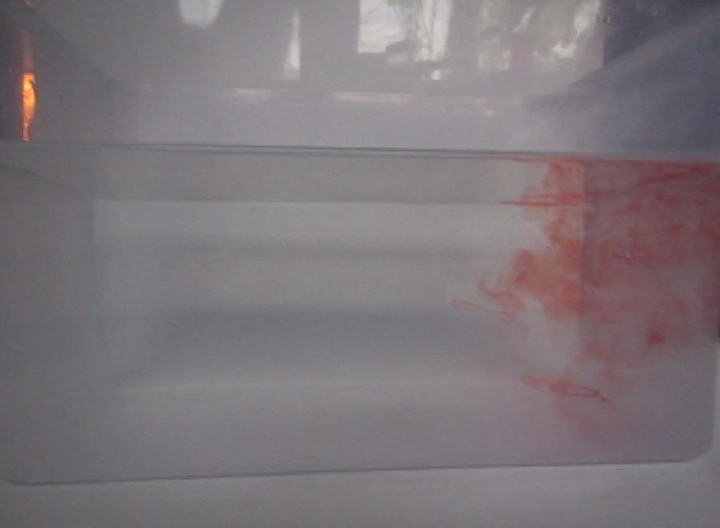
Figure 2: Tank with luke warm water. Red food dye added to the “warm” end of the tank.
Then we add the blue ice cubes to the “poleward” end of our tank (see Figure 3).
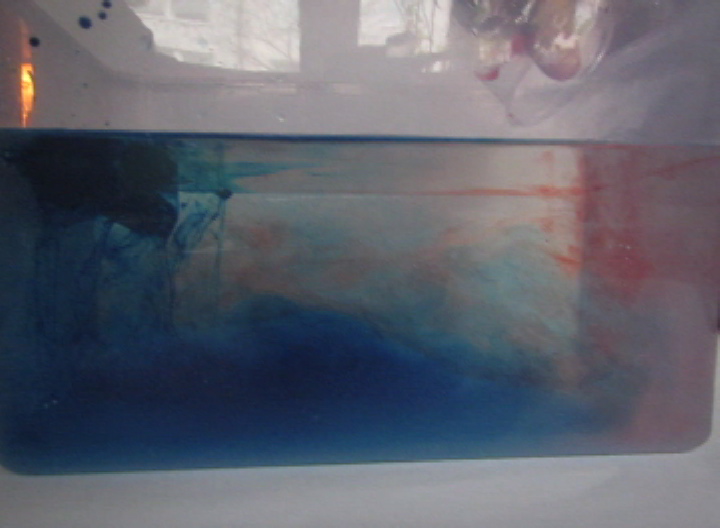
Figure 3: Blue ice cubes melting at the poleward end of the tank. The cold melt water sinks to the bottom of the tank and then spreads “equatorward”.
The cold melt water from the ice cubes is denser than the lukewarm water in the tank and therefore sinks to the bottom of the tank where it spreads “equatorward”, pushing below the warmer water. This can be seen where the red water is pushed upwards and “poleward”.
Discussion
Of course, the processes at play here are not exactly the same as in the real ocean.
For one, deep water formation is NOT due to ice cubes melting in lukewarm water. In fact, melting of sea ice will in most cases not lead to any kind of sinking of water, since the melt water is fresh and the surrounding ocean water is salty and hence denser than the melt water. Cooling in the ocean happens through many processes at the surface of the ocean, like radiation into space and evaporation.
Heating is also represented in an extremely simplified way in this experiment. Heating in the ocean occurs mainly (with the negligible exception of thermal springs in the ocean) by radiative heating from the sun, and at the surface only. We “heat” throughout the whole depth of the ocean by filling the whole tank with lukewarm water.
Also, the mixing processes that, in the real ocean, bring deepwater back to the surface are not represented here at all. Our tank will eventually fill with a layer of cold water at the bottom (See Figure 4), and the circulation will stop once all the ice has melted.
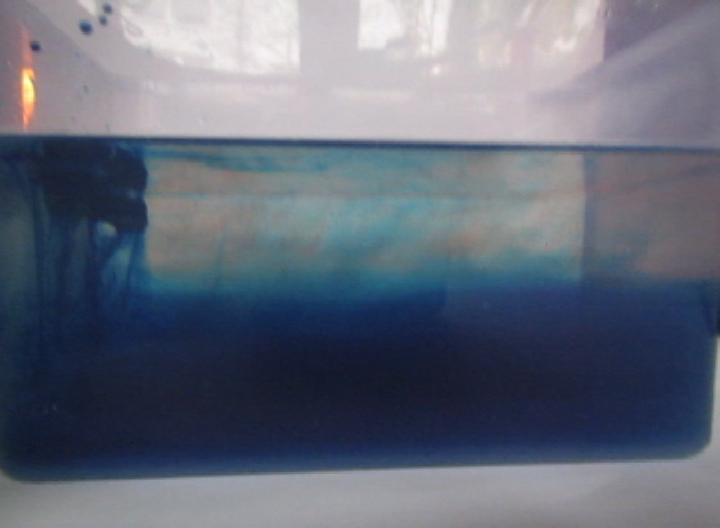
Figure 4: Blue ice cubes melting at the poleward end of the tank. The cold melt water sinks to the bottom of the tank and then spreads “equatorward”. Slowly, the tank fills with cold water.
Why use the experiment?
Even with all the simplifications described above, this experiment is a great first step in becoming intrigued by the ocean, and towards understanding ocean circulation. Seeing the melt water sink from the ice cubes is fascinating no matter how little interest one might have in the physics that cause it. Sliding a finger up and down the side of the tank lets you experience – feel! – how the temperature changes from warm near the surface to very cold near the bottom. Actually physically feeling this is a lot more impressive than just watching the experiment or even just being shown temperature sections of the ocean. And the experiment invites you to play: What if you added little pieces of paper on the water surface, would you see them move with the flow towards the cold end of the tank? Or if you dropped a dye crystal in the middle of the tank, would the dye ribbon that forms be deformed by the currents in the tank? And what if you added twice as many ice cubes, would the currents be twice as fast?
This is pretty much the easiest experiment you can imagine. If you are afraid of what food dye might do in the hands of your participants, you don’t even need to let them handle it themselves, even when they are working in small groups with individual tanks: just go around dripping the dye in and then add the dyed ice cubes yourself. While someone might still tip over a tank and spill the water, this has yet to happen to me. Especially since, before running the experiment, you will have pointed out that they need to make sure not to bang against the tables as to not disturb the experiment. And now apart from making sure that the ice cubes are frozen when you want to run this experiment, there is nothing that can go wrong. So why not try this experiment next time you want to talk about global ocean circulation?
Watch a video of the experiment here:
What would I do differently next time?
Next time, I would pay attention to which end of my tank will represent the equatorward and poleward side of the ocean. Not that it matters much, but in most graphics of sections through the North Atlantic, the northern end will be on the right side and the southern end on the left. If the experiment is set up the other way round (as on all pictures and movies above) you will need to remember to point it out (or even mark it on the tank with a sharpie or such).
Still scared of the hassle of running experiments?
And for all of you who hesitate doing awesome experiments because it looks like you need so much equipment: No you don’t. Here is a “making of” shot from how I did this experiment on my coffee table while sitting on my couch. The background is the back of an old calendar sheet, clipped to the back of a chair. And that’s it.
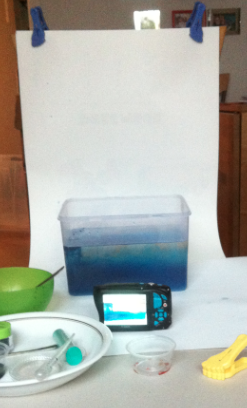
The setup for my experiment.
—
P.S.: This text originally appeared on my website as a page. Due to upcoming restructuring of this website, I am reposting it as a blog post. This is the original version last modified on November 4th, 2015.
Combining a slowly rotating water tank with a temperature gradient: A thermal wind demonstration! | Dr. Mirjam S. Glessmer says:
[…] up an overturning circulation in a tank is easy, and also interpreting the observations is fairly straightforward. Just by […]
Experiment: Oceanic overturning circulation (the slightly more complicated version) – Mirjam S. Glessmer says:
[…] the “slightly more complicated version” because it builds on the experiment “oceanic overturning circulation (the easiest version)” […]