Tag Archives: LEGI Grenoble

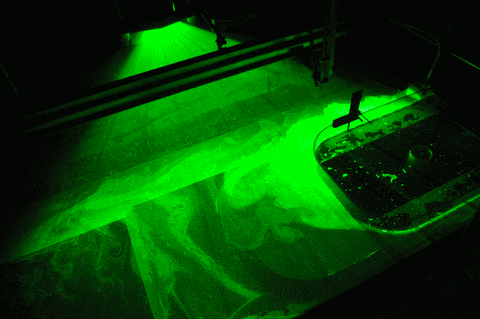
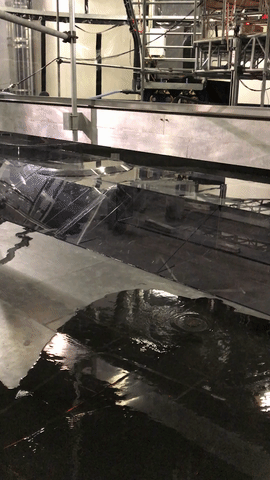
We discovered a new galaxy! Or at least a very pretty vortex

When we move our wall back and forth, we create very strong wing tip vortices that persist for quite a long time.

Above, you see the vortex, lit by a laser sheet close to the surface. You can see the whole column rotating as one, that bright smudge below the swirl is the lower part of the column. There are so many of our neutrally buoyant particles in there that the column looks bright even though it isn’t directly lit by the laser.

And in the picture above, you see those bright smudges on the left of the picture? That’s particles that the vortex hoovered up and then dumped in its path, pretty much like a hurricane would.

And that’s what it looks like as a gif:

“No one believes a theory, except the theorist. Everyone believes an experiment — except the experimenter.”

Different types of experiments, and why we use such a weirdly-shaped “Antarctica” and are happy with it.

When we want to show people images of our model experiments in a tank, people often imagine that they will be shown cute little miniature landscapes, looking much like the ones you see for really fancy model train setups. And then they are hugely disappointed when they see pictures like the one below and we tell them that yes! that’s our Antarctica that Nadine is climbing on, while Elin is sitting in the Southern Ocean.

The kind of experiment everybody hopes to see could, according to Faller (1981), be classified as a simulation: representing the natural world in miniature, including every detail. Data from those experiments — since they would in theory be realistic representations of the real world — could be used to fill in missing data from the real world in regions that are hard to get real data from, like for example the Southern Ocean. However, since those experiments are designed to represent the complexity of the real world, interpretation of the experiments is as complex as it is to interpret data from the real world: There are so many processes involved that it is hard to isolate effects of individual processes.

The kind of experiments we are doing would be classified as abstractions. Faller describes this kind of experiment as similar to abstract art: Only the main features, or better: the artist’s interpretation of the main features, are reproduced and everything else is omitted. That makes the art difficult to understand for anyone who isn’t well versed in abstract art, but for the experts it is obvious what the point is.

In case of our experiments that means that we have all the relevant features, or better: our interpretation of what we believe to be relevant features, of Antarctica present in the tank: the parts of topography that we think have an influence on how the current should behave, i.e. a V-shaped canyon, a source that supplies water of the correct properties into the ambient “ocean” water, an ice shelf. And when that ice shelf is tilted, we feel like our experiments are already becoming pretty realistic!

These abstractions are the kinds of experiments in which you can, because they are relatively simple, develop new theories when new features of the circulation emerge that you then have to rationalize and include in your theories after the fact.

We have actually also done another type of experiment, a verification. I wrote about it in this post: we tilted the ice shelf because this is a case for which we actually knew from theory how our current should behave, in contrast to all the previous experiments where we didn’t actually know what to expect, and we were happy when we observed exactly what we expected based on theoretical considerations. So in this case the experiment wasn’t about discovering something new, but rather making sure that our understanding of theory and what goes on in the tank actually match.

Faller describes a last type of experiment: the extension. That is the kind of experiment that you could perform after a successful verification experiment: Pushing the boundaries of the theory. Does it still hold if the current introduced in the tank is very fast or very slow? If the water is very deep? If the slope of the ice shelf is very large or small? Basically, every parameter could now be changed until we know for which cases the theory holds, and for which it does not.

So why am I writing all of this today? Faller’s (1981) article, before he goes on to describe the framework to think about geophysical fluid dynamics experiments that I mentioned above and which I find quite helpful to consider, starts with the sentence “No one believes a theory, except the theorist. Everyone believes an experiment — except the experimenter.” On this blog, our goal is to bring the two together and not make anyone believe either of them, but to show how both can work together to mutual benefit.

Faller, A. J. (1981). The origin and development of laboratory models and analogues of the ocean circulation. Evolution of Physical Oceanography, 462-479.

How to make sure the properties of water in a tank experiment are *just right*

For all our experiments here on the rotating platform in Grenoble, we have had a source, introducing an artificial current into our water-filled tank. With flow rates between 15 l/min and 60 l/min, and experiments running for about half an hour, that is a lot of water that has to come out of the source!

Below, you see a picture of the source during an experiment, and you see there is a pipe going into it, through which water is being supplied.

That water is coming from the very top of the rotating platform. There is a smaller tank up there which you see on the picture below. This is the tank where the particles which we use to visualize the flow field get added, and water in this tank needs to have the exact density we want our inflow to have. Not easy since it is sitting some 10 meters above the tank, where the air temperature is higher…

In fact, it’s an extremely complex system of tanks everywhere on and around the rotating platform. Below you see a picture of the screen through which most of them are operated:

There are three huuuuge water tanks in which water is prepared. You might have seen them rotating past in some of our videos, or you see them below (on the left you see the rotating tank). This picture doesn’t do them any justice: They are enormous. They are higher than the tank, and the mini tank on top of it, and the whole tent around all of it, and they start from the very bottom of the room (so not the level that seems to be the floor in the picture below).

We got to climb on one of them, which gave us a really great view of the tank (or at least that’s what Nadine says, and what the picture looks like — I was too busy getting over my fear of heights combined with the dizziness of a long working day on the rotating platform to enjoy it much ;-)).

Nadine has described earlier about how for some experiments, we add salt to spice things up. In the first set of experiments, for some, the whole tank was filled with salt water. And for this set of experiments, we sometimes added a small amount of salt to adjust the density of the inflow. But this is how producing the salt water actually works: Salt arrives in big bags, stacked on pallets. The salt pellets are put into the bin you see in the picture below, and get hoovered up into one of the huge tanks, where they are dissolved in water to make a saturated salt solution. That solution is then diluted to whatever salt concentration is desired for a certain experiment.

To fill a whole tank with salt water with approximately oceanic salinity, we need all the salt shown in the picture above!

We are pretty lucky that Thomas and Samuel take care of all the saltwater-making for us. That would be a huge task if we had to do it ourselves, and we are already now not getting bored ;-)

And, btw, if you are wondering about how we are getting rid of the dense, salty current that we inject into the fresh ambient water in between experiments: The dense water eventually sinks to the bottom of the tank, slowly filling it up underneath the fresher water. You might have noticed those UFO-shaped flat plates on the bottom of the tank that you see in the picture below. They cover the outlets through which the tank can be drained, such that now water from the very bottom of the tank can be pumped out without introducing a vertical component (which would suck water from higher levels, too).

Quite a lot of effort going on not only to prepare the water, but also to get rid of it again! :-)

Closing off our channel at the ice-shelf end to avoid unrealistic outflow

We are very deep into discussing all the different ice shelf experiments that have happened so far. As you see above, the white board in our office is filled with drawings of our interpretations of the experiments.

And as you know, things don’t always go exactly as planned. Or, in fact, most of the time they don’t.

One thing that has been happening in our experiments is that water flowed out of the channel underneath the ice shelf. Not a lot of water, but after long discussions, we decided that — since in reality there is no way for water to come out that end of the channel, because there is land closing off the channel at the end — even a little water was too much and that we needed a way to block off that end of the channel.

However, constructing anything inside a rotating tank full of water and with a lot of scaffolding just above the water level isn’t easy (as I found out when I was sweeping the tank, trying to duck under the scaffolding and flooded the waders I was wearing. Yep, true story…), so even after deciding that we needed a solution, it still took a lot more discussing until we actually had a solution that everybody was happy with.

So now we will build a wall! And it is going to be huge! And it will block all the water so nothing is coming out of the channel any more. And it is going to be the best wall in the world (and maybe Mexico will pay for it? ;-))

Actually, the wall is in the tank already, so now we’ll start investigating whether it actually has an effect or not!

One thing we found out already: Moving a large wall back and forth in a tank creates nice eddies (duh!). But look at how pretty they are! :-)

And now on to even more realistic ice shelves!

We have already described experiments where our ice shelf was tilted, making the setup a little more realistic* than before (link here). But then later that day, we did two more experiments! And this time, the ice shelf wasn’t just tilted, it was also not going up all the way to the surface (or, well, it’s flat bottom did not, and then there was a sharp edge and the side of the ice shelf went out of the water). So we are expecting to see a mixture between the experiments shown is yesterday’s blog post: Some of the water being blocked by the ice shelf, but some possibly conserving its potential vorticity and going down the v of the canyon and then turning around and coming back up.

And that’s what we saw!

Can you spot the return flow that has come out from below the ice shelf in the lower layers before it gets obscured by all the stuff that got blocked by the ice shelf in the upper layers?

Nice when experiments really work out the way you expect them to do! :-)

*I have a blogpost in the making on what “realistic” actually means in the context of geophysical fluid dynamics experiments, and if that is even something one should aim for (spoiler alert: not necessarily!), but I keep getting too distracted by all the cool stuff going on here in Grenoble, that it hasn’t progressed out of the draft stage. But I will finish it up and post it, I promise!

What a day in the Coriolis lab looks like

You have seen plenty of images of our experiments over the last weeks (and if you have not, scroll back on the blog!). Time to show you what a day in the Coriolis lab looks like for us!

Above, you see Nadine and Adrian watching experiments. For each experiment, we spend approximately 30 to 40 minutes in the dark, on the rotating platform, lit by the green glow of the laser in the tank and by the occasional emergency exit sign flashing past (as the tank rotates past twice every minute. So if you think Nadine and Adrian look a little green in the face, it might not just be the laser ;-)). During that time, we take a lot of pictures, some of which you saw on the blog already, but we mainly stare into the tank, trying to understand what we are seeing. Nadine takes a lot of notes about all kinds of things: When the experiment started, at what time it transitioned into new phases, what settings were used, if there were problems or special occurrences like for example a lot of bubbles coming from the source. And we are continuously discussing our observations and how we interpret them, because depending on how well we think an experiment worked, we will have to make decisions on how exactly the next one will be done. And it is quite stressful to rely on our observations alone without having processed and analysed the actual data! But that part of the research will still take years to complete, so we can’t wait for that right now.

Here is a time lapse over two experiments and the setup periods in between (and hang on for a second if they don’t start playing right away, they will eventually). And don’t forget: We are on the rotating platform for the whole time!

This is what it looks like in the co-rotating office during experiments (light will come on intermittently, but mostly it's really dark)

This is what it looks like in the co-rotating office during experiments (light will come on intermittently, but mostly it’s really dark)

When we are not running experiments, or if there are longer breaks between experiments because the water in the tank needs to settle into solid body rotation, we work in the office you see below. I wanted to make a time lapse of us working in there, too, but then we decided to just have lunch instead, so you only see a very short one and then we leave. First things first! :-)

And this is the other office

And this is the other office

It’s just a normal office and we work on our computers in very much the same way we would in any other office in any other place. Except that we only need to walk a couple dozen steps to be back on the rotating platform, and that is still very exciting :-)

What happens when a current meets an obstacle? Topographic steering

As long as water depth and latitude stay the same, a current usually happily goes straight forward. However, a large part of what we are doing at the Coriolis tank in Grenoble has to do with what happens to ocean currents when they meet topography, so sea mounts, ridges or troughs under the water, and what happens then is called topographic steering.

Topographic steering basically means that a current will follow lines of constant potential vorticity (ω+f)/H. In this, ω is the rotation of the fluid (more on this here), f is the Coriolis parameter, and H is the water depth. So if a current is flowing  straight ahead (ω=0) in a sea of constant depth, it will stay at the one latitude where it started. If, however, there is a ridge or a canyon in its way, it will try to move such that it either changes its rotation or that it reaches a different latitude so that it stays on a path of constant (ω+f)/H.

What does that mean for our experiments?

In our experiments, we actually change the water depth not only by sloping the floor down into the canyon, we also change it by taking away height from the top by introducing ice shelves.

f in the tank is constant (explanation here), so only ω/H need to be conserved, meaning that the current needs to either follow lines of constant depth, or compensate for any depth change by changing its rotation. I have described in this post what that means for the flow in our tank: We expect — and observe visually (see picture on top of this post) — that an ice shelf that is tilted such that it is slowly decreasing the water depth will force the current down the slope of the canyon, until it reaches the deepest point, turns, and moves up again.

But now Nadine has plotted the actual measured data, and we see the same thing! Below you see a plot of the flow field on a level just below the upper edge of the canyon. I have drawn in where the ice shelf is situated and where the contours of the channel are, and, most importantly, that the flow field shows exactly the behaviour we were hoping for!

Observed flow field underneath the tilted ice shelf

Observed flow field underneath the tilted ice shelf

The messy flow field where the contours of the ice shelf are drawn in is probably because the data that is being plotted has been calculated from pictures that were taken from above the tank, through the ice shelf, so we don’t have good data in those spots. But all in all, we are very happy! And almost ready to call it a day. Almost ready, except it is still too exciting to think about our experiments… ;-)

Tilting the ice shelf! Or: Our experiments are getting more realistic

Until now, we have used an “ice shelf” (a plastic box) which had a horizontal bottom (Read more about the general setup of the experiment in Nadine’s post). The bottom of the ice shelf was either right at the water’s surface, or lowered down into the water. What we see then is shown in the gif below, where we are scanning the full water depth from the bottom upward. The ice shelf is resting on the upper edge of the v-shaped channel, so it effectively blocks the flow, which separates at the ice edge and turns mainly left.

Currents meeting an "ice shelf"

Currents meeting an “ice shelf”

Now it’s time to get used to a new vantage point, which lets us look underneath the ice shelf. The source isn’t in the upper right-hand corner any more as it has been in all images and movies on this blog until now. See the sketch below: The source is in the upper right-hand corner and the ice shelf sits in the lower center of the picture, across the v-part of the channel.

Sketch of the new topography: Channel, source, ice shelf

Sketch of the new topography: Channel, source, ice shelf

The gif below shows the same experiment that we saw before, only this time from a similar perspective as shown in the sketch above: When the flow reaches the ice edge, it is blocked and turns to the side.

But then today, we have started tilting the ice shelf (well, Adrian and Thomas have, as you see in the image on top of this post, but I will keep saying “we”).

This might be more realistic — an ice shelf would probably have melted more the further out into the ocean you look (where the ice would have been exposed to melt longer and also the currents flowing under the ice shelf would still be warmer), and therefore we would expect the base of the ice shelf to slope up the further towards the open ocean you go. But this circulation is also one that is easier to understand theoretically: We are expecting the current to stay on lines of constant potential vorticity*. But it can only do that if those lines exist. In the previous experiments, there is a jump in potential vorticity introduced by the edge of the ice shelf, since the water depth decreases drastically as the current meets the ice shelf. Therefore there is no obvious way for the current to take since it can’t conserve its vorticity no matter where it goes (which is why we saw most of it just bouncing off the ice edge and flowing away to the sides). Now, we were hoping to see a circulation where the current, reaching the ice edge while it is flowing approximately half way down the slope, would be guided down the slope as the ice comes further and further down into the water, until at some point it crosses the deepest point of the slope, and turns backward, flowing up the slope and towards areas where the ice isn’t reaching as far down. That way, the water depth the current feels would always stay the same, since it is moving up and down the slope to compensate for the change in height introduced by the ice shelf.

So here is a gif of an experiment where the ice shelf is tilted such that its edge on the source-side is at water level, while the opposite edge rests on the edges of the canyon.

Current meeting a sloped ice shelf

Current meeting a sloped ice shelf

In case you can’t spot it, here is a sketch of the circulation:

Sketch of the circulation underneath a sloped ice shelf

Sketch of the circulation underneath a sloped ice shelf

So what I described above is actually exactly what we observed! Very very exciting! :-)

*For a quick explanation of vorticity see this blog post — quick and dirty explanation is that if water depth changes, a water column will change its rotation. Either by moving to a place with a different planetary rotation (but it can’t do that in our tank, see here), or by starting to rotate itself and hence changing direction

Investigating ocean currents in a rotating swimming pool

Reposting from Sci/Why “where Canadian children’s writers discuss science, words, and the eternal question – why?”
Have you ever wondered what happens when you put a 13-m-diameter swimming pool on a merry-go-round? Probably not. But I am here to tell you today about what happens when you do just that, and what you can learn from doing so.
 
I am part of an international group of scientists, doing research on currents in the ocean (and you can read more about who we are and what you do on our blog: http://skolelab.uib.no/blogg/darelius). Specifically, we are interested in how warm water is transported towards an Antarctic ice shelf. As you can imagine, Antarctica is not the easiest place to travel to and measure the ocean, especially not during winter. There are some observations of warm water reaching the ice shelf and contributing to melting the ice, but it is not known yet under what conditions this happens.
 
Why a pool?
 
In order to understand how water behaves in the ocean, we are reproducing real-world features that we suspect have an important influence on the current’s behavior, but in miniature, and inside our water-filled tank. Then we can modify those features and observe which parts of them actually determine how the water flows, and which parts are not as important. In our case, we are changing the miniature coastline of Antarctica to see what makes the current turn and flow into a canyon instead of just going straight ahead.
 
Why rotation?
 
We need to rotate the tank to represent the Earth’s rotation. This is because the Earth’s rotation influences all large-scale movements on Earth, including ocean currents: Moving objects get deflected to their left on the Southern Hemisphere. Below is a short video of the rotating, empty tank, to show you what happens when you roll a ball in the rotating tank: It does not go straight ahead but just curves to the side!
 
Before Nadine, the scientist shown in the video, climbed into the tank, you saw her walking alongside it. Even though the tank was turning very slowly (only one rotation per 50 seconds), she had to walk quite fast to keep up! This is how fast we need to spin the tank in order to have it rotate at the right speed for the size of our Antarctica.
How does it all work?
There is only one tank of this size — 13 meter diameter! — in the world, and it is situated in Grenoble, France. Researchers from all over the world travel to France to do their experiments in this tank for a couple of weeks each. In the gif below, you see the tank rotating: First, you see an office moving past you (yes, there are several floors above the water, including the first one with an office, computers, desks, chairs and all! That’s where we are during experiments, rotating with the tank) and then you can see the water below, lit in bright green.
Rotating the tank

Rotating the tank

There is a huge amount of effort and money going into running research facilities like this, and everybody working with the tank needs to be highly specialized in their training.
What do experiments look like?
When there is water in the tank, we need some special tricks to show how the water is actually moving inside the tank. This is done by seeding particles, tiny plastic beads, into the water and lighting them with a laser. Then special cameras take pictures of the particles and using complicated calculations, we can figure out exactly how the currents are moving. Below, you see a gif of one of our experiments: The current starts coming in from the right side of the image, flowing along our model Antarctica, and then some of it turns into the canyon, while most of it just goes straight ahead.
Currents flowing around "Antarctica"

Currents flowing around “Antarctica”

Depending on the shape of our Antarctica, sometimes all the water turns into the canyon, or sometimes all of it goes straight ahead.
What have we learned?
That’s a difficult question! We are still in the middle of doing our experiments, and the tricky part with research is that doing the experiments (even though that can be a huge undertaking as you see when you look at what a huge structure our tank is, or what enormous effort it requires to go to Antarctica with a research ship) is only a tiny step in the whole process. Nadine, who you saw in the movie above, is one of several people who will work on the data we are currently gathering for the next four years! But even though we are not finished with our research, there are definitely things we have learned. For example, the length of Antarctica’s coast line that the current flows along before the canyon interrupts its flow is very important: The shorter it is, the larger the part of the current that turns into the canyon. How all our individual observations will fit together in a larger picture, however, will still take months and years of work to figure out.
Where can I learn more about this?
If you have any questions, we would love to hear from you! We are hosting an “Ask Me Anything” event on October 18th (link here: https://oceanama.com/hi-i-am-mirjam-we-are-investigating-ocean-currents-in-a-13-m-diameter-455228/ but you can also leave questions on our Facebook page: https://www.facebook.com/EDareliusAndTeam/ or directly on our blog: https://skolelab.uib.no/blogg/darelius/)

Looking at our current’s structure over depth

For our scientific analyses, we look at the flow field at several discrete levels throughout the water depth. But we can — just for fun! — look at them almost continuously while the scanner is moving up and down, and that’s what I want to show you today. Isn’t it cool how the flow is so barotropic even though there are so many eddies and other things going on?

Scanning through the current top to bottom to see its structure

Scanning through the current top to bottom to see its structure