What happens when a current meets an obstacle? Topographic steering
As long as water depth and latitude stay the same, a current usually happily goes straight forward. However, a large part of what we are doing at the Coriolis tank in Grenoble has to do with what happens to ocean currents when they meet topography, so sea mounts, ridges or troughs under the water, and what happens then is called topographic steering.
Topographic steering basically means that a current will follow lines of constant potential vorticity (ω+f)/H. In this, ω is the rotation of the fluid (more on this here), f is the Coriolis parameter, and H is the water depth. So if a current is flowing straight ahead (ω=0) in a sea of constant depth, it will stay at the one latitude where it started. If, however, there is a ridge or a canyon in its way, it will try to move such that it either changes its rotation or that it reaches a different latitude so that it stays on a path of constant (ω+f)/H.
What does that mean for our experiments?
In our experiments, we actually change the water depth not only by sloping the floor down into the canyon, we also change it by taking away height from the top by introducing ice shelves.
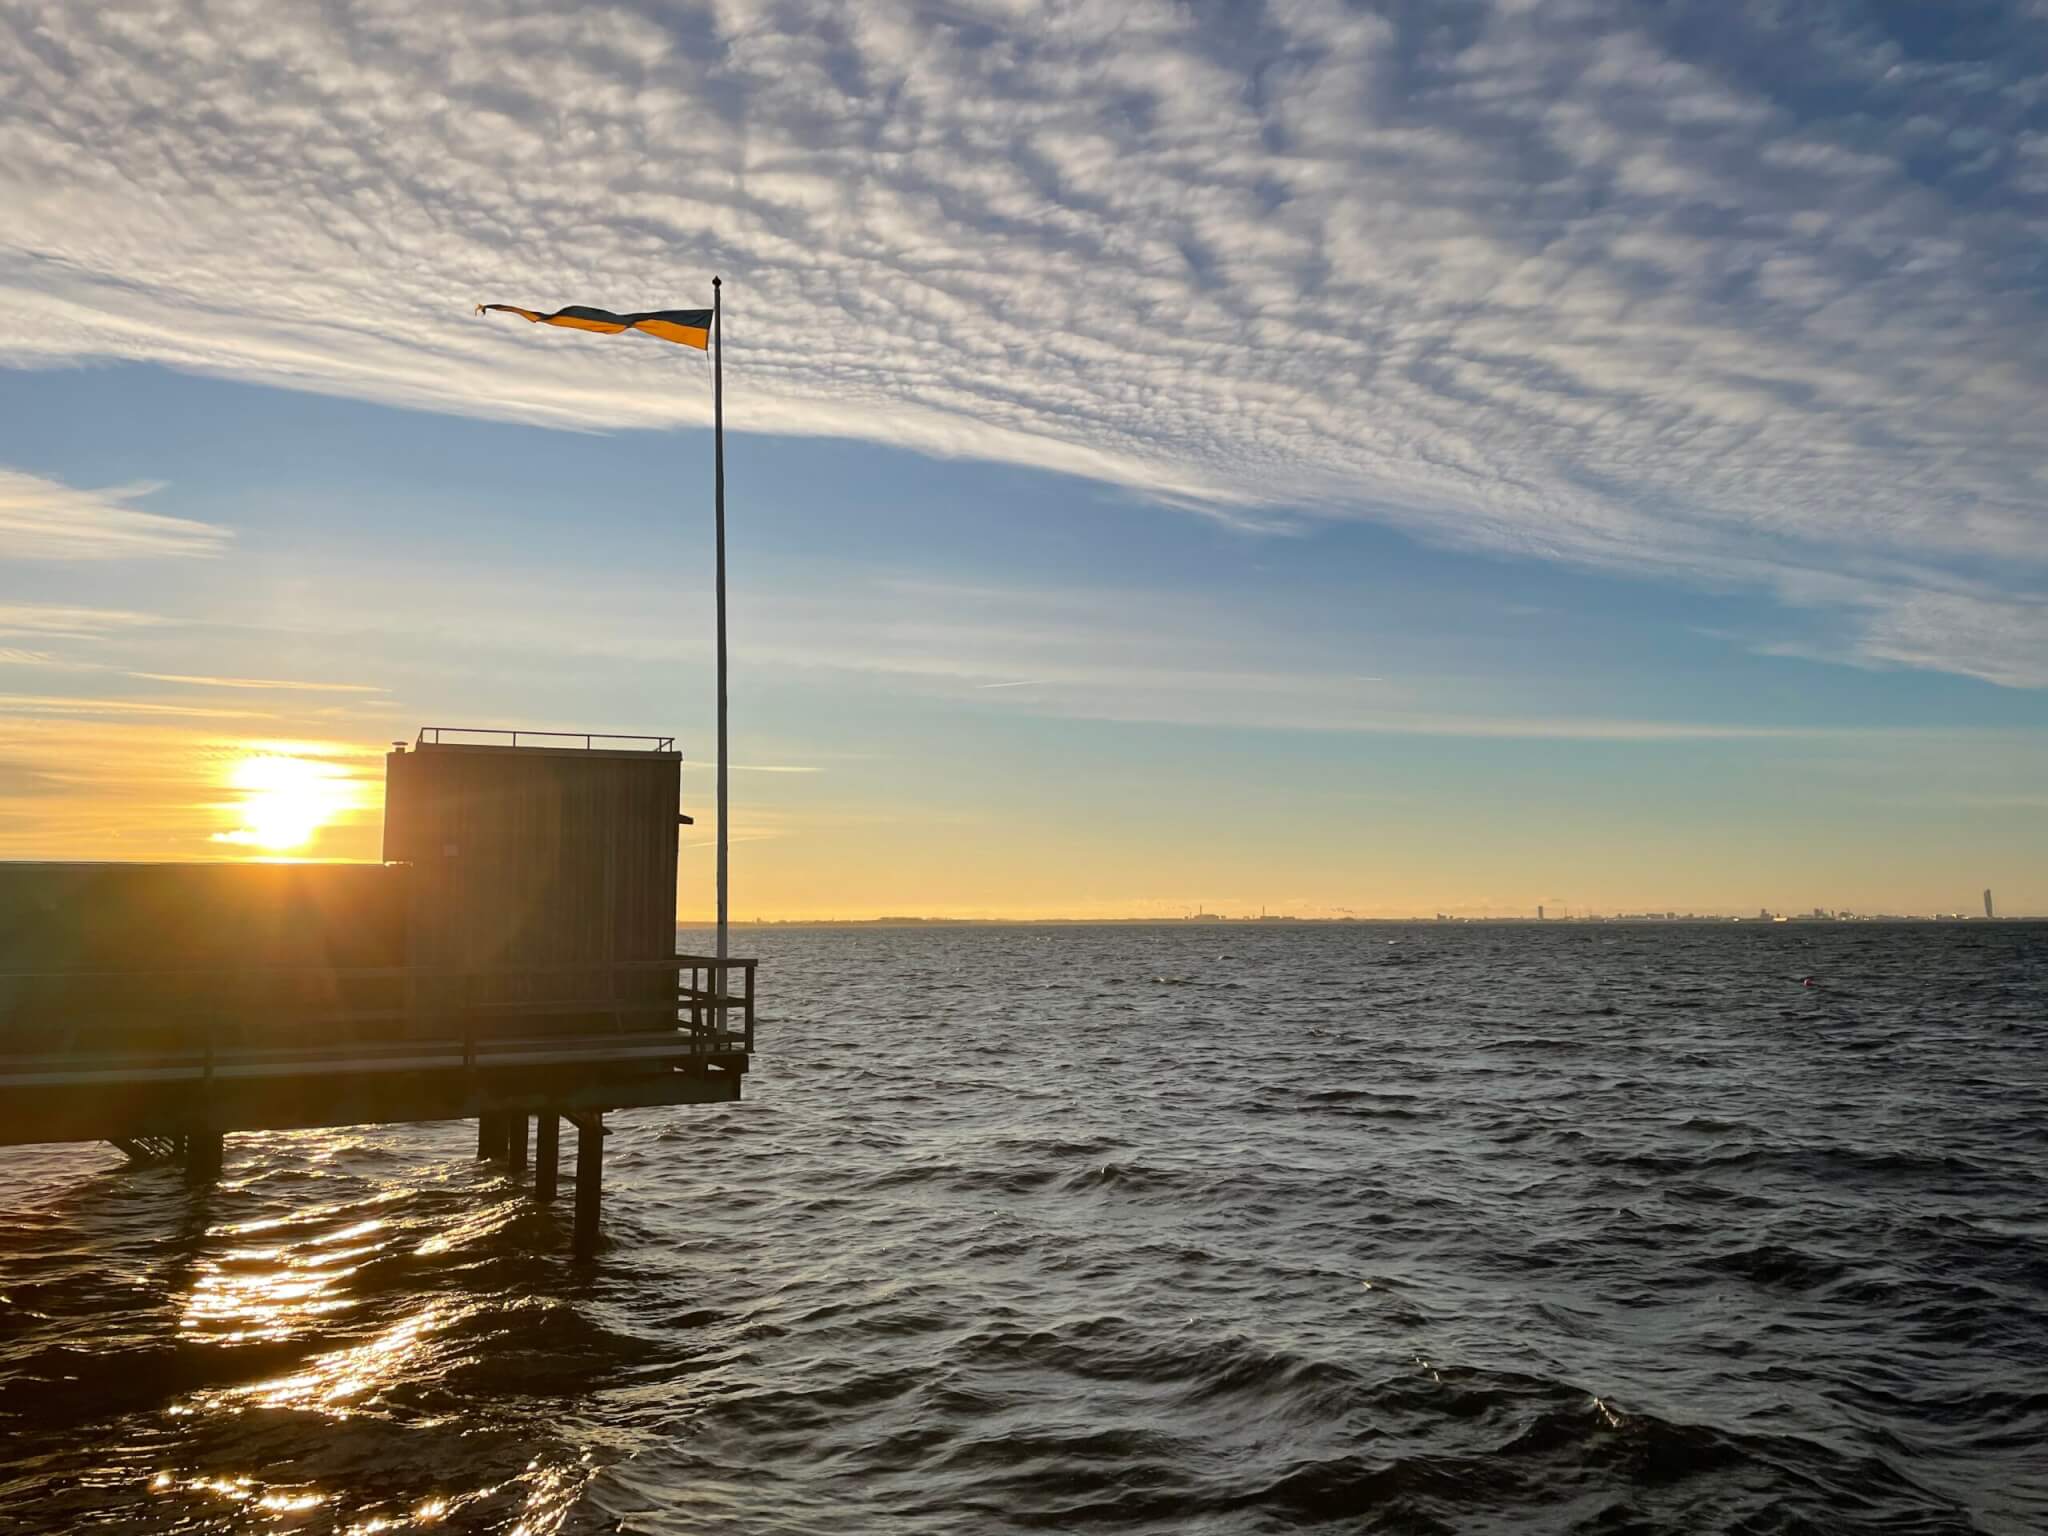
f in the tank is constant (explanation here), so only ω/H need to be conserved, meaning that the current needs to either follow lines of constant depth, or compensate for any depth change by changing its rotation. I have described in this post what that means for the flow in our tank: We expect — and observe visually (see picture on top of this post) — that an ice shelf that is tilted such that it is slowly decreasing the water depth will force the current down the slope of the canyon, until it reaches the deepest point, turns, and moves up again.
But now Nadine has plotted the actual measured data, and we see the same thing! Below you see a plot of the flow field on a level just below the upper edge of the canyon. I have drawn in where the ice shelf is situated and where the contours of the channel are, and, most importantly, that the flow field shows exactly the behaviour we were hoping for!
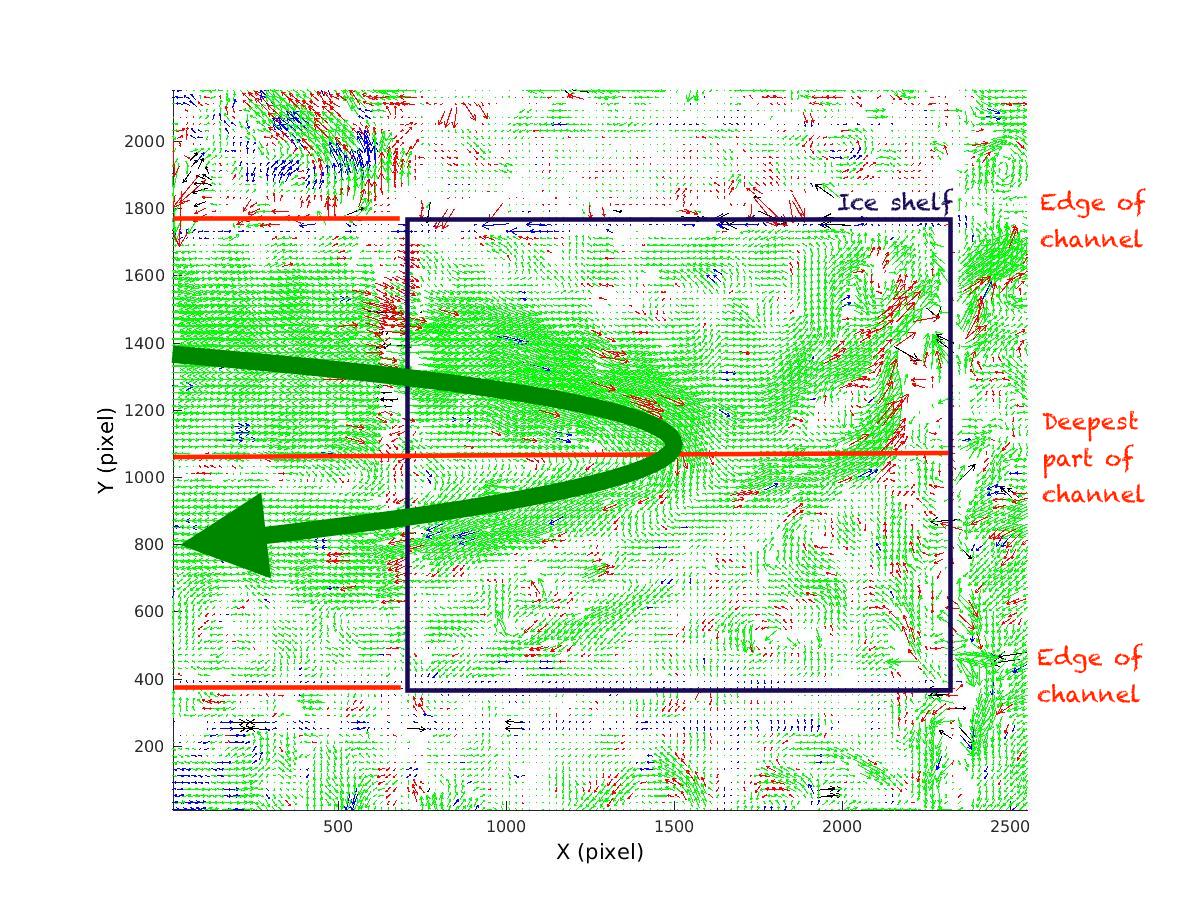
Observed flow field underneath the tilted ice shelf
The messy flow field where the contours of the ice shelf are drawn in is probably because the data that is being plotted has been calculated from pictures that were taken from above the tank, through the ice shelf, so we don’t have good data in those spots. But all in all, we are very happy! And almost ready to call it a day. Almost ready, except it is still too exciting to think about our experiments… ;-)