Tag: melting ice cubes experiment
On melting ice cubes and molecular diffusion of heat
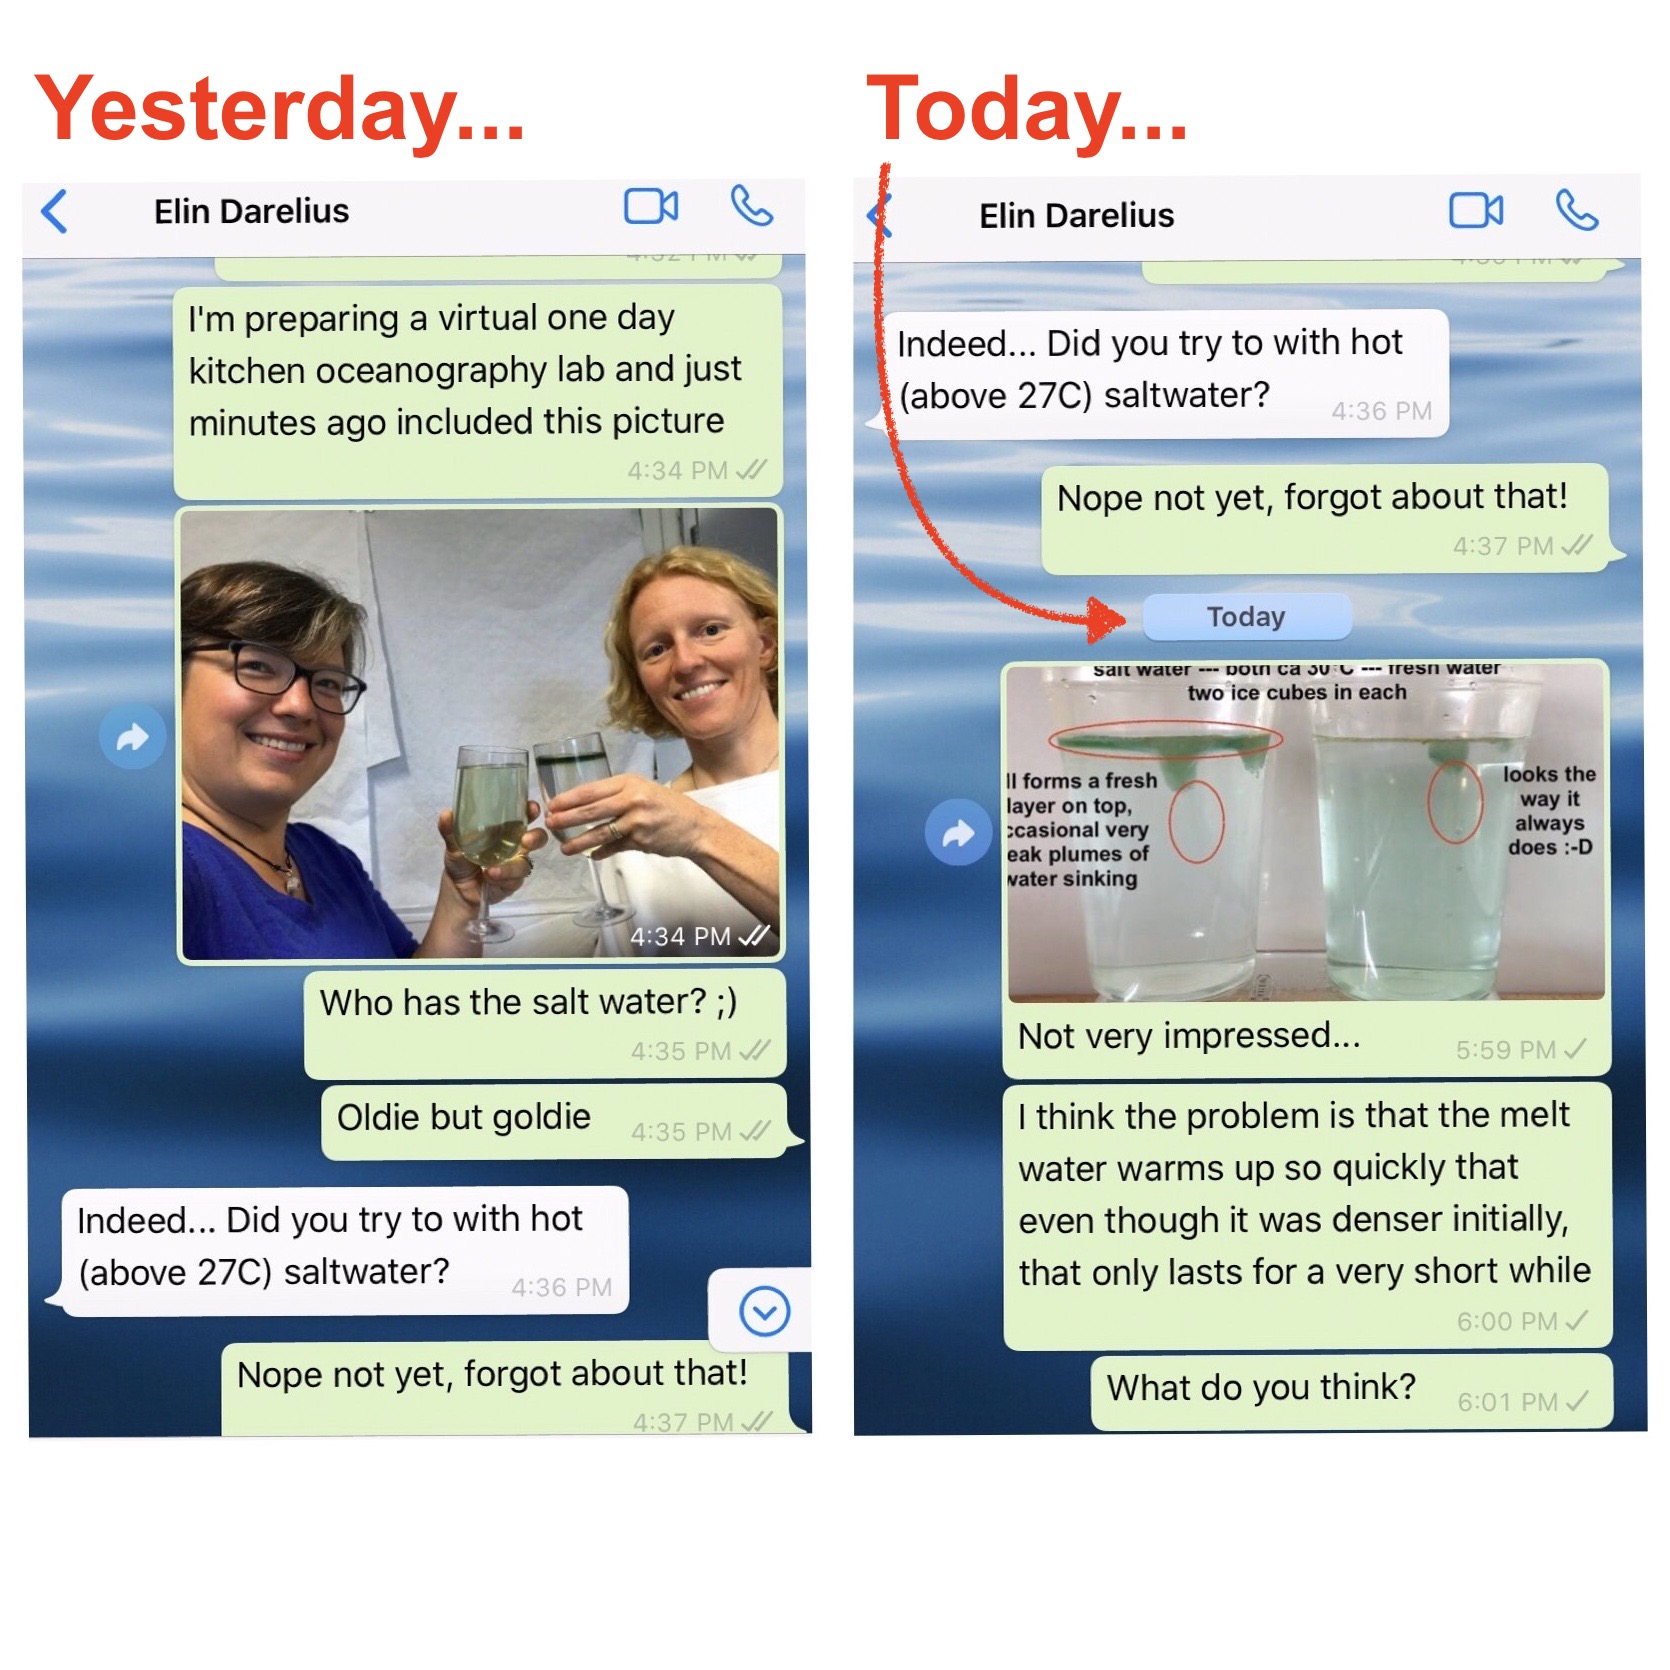
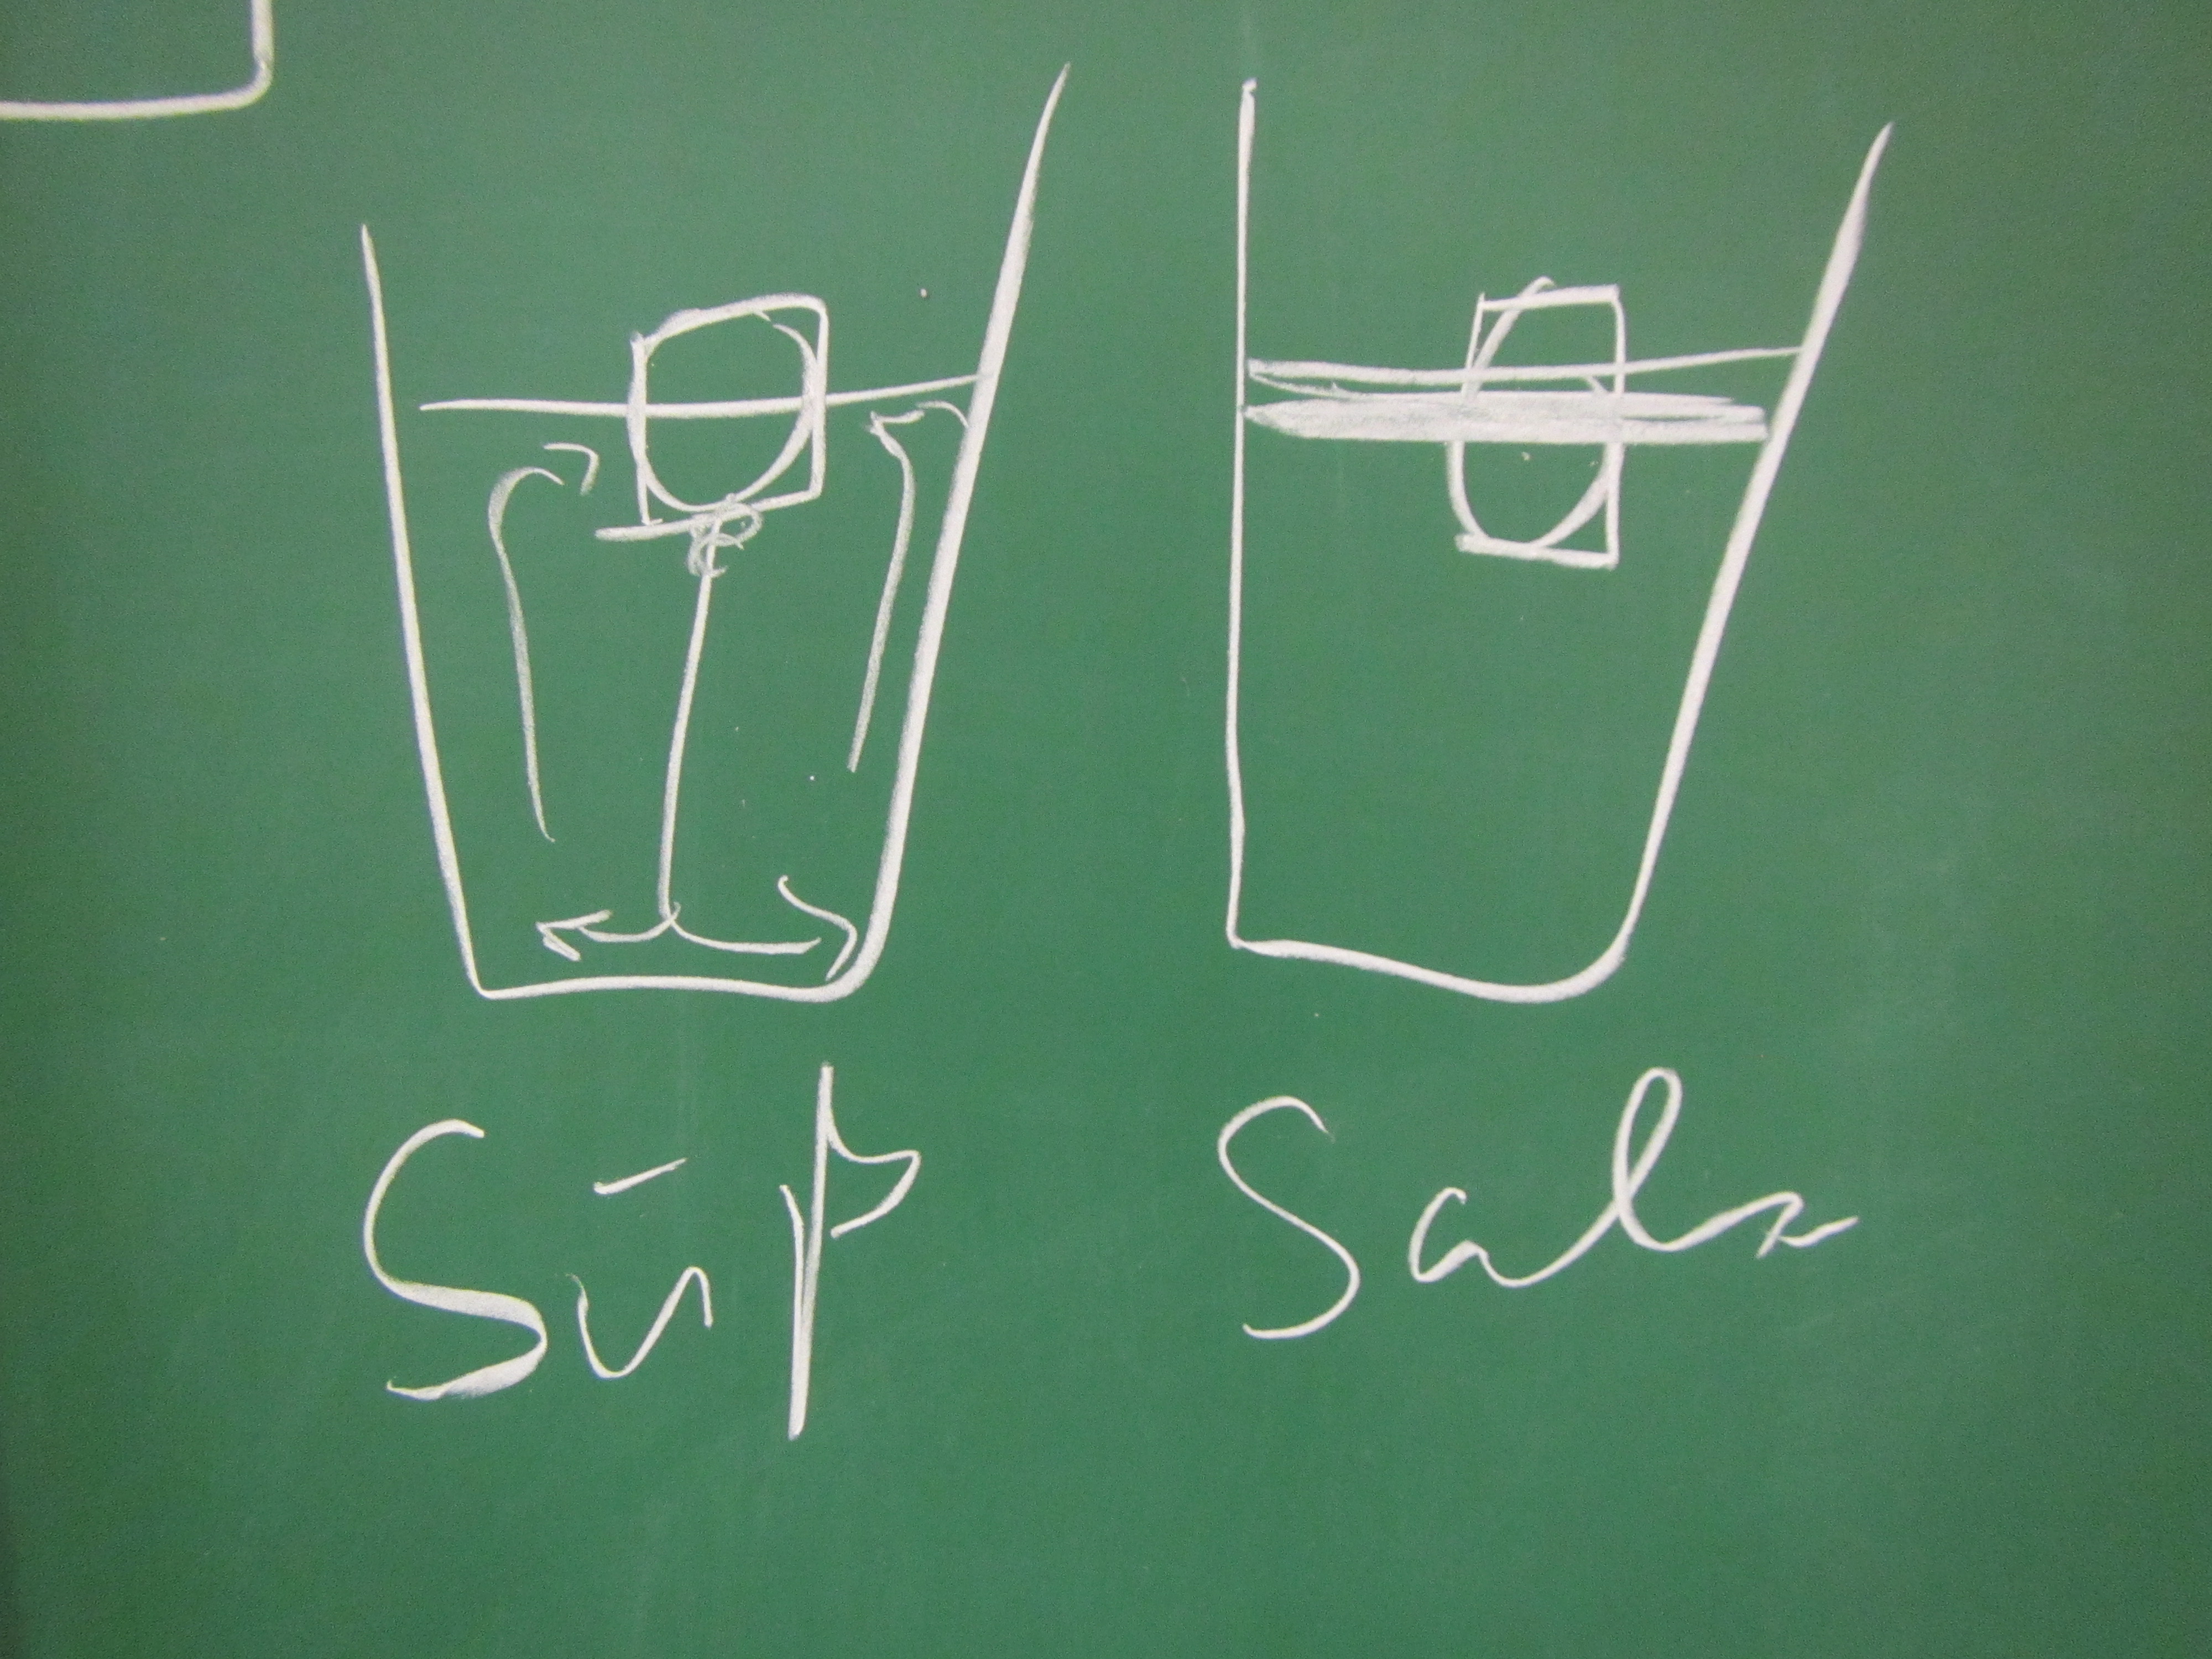
First of all, let me say how much I love having chats like the one Elin and I had over the weekend (which you only see the very beginning of above). I had gotten into a bit of a rut kitchen oceanography-wise, which, I am happy to report, is over now! Thanks, Elin! :-) One […]

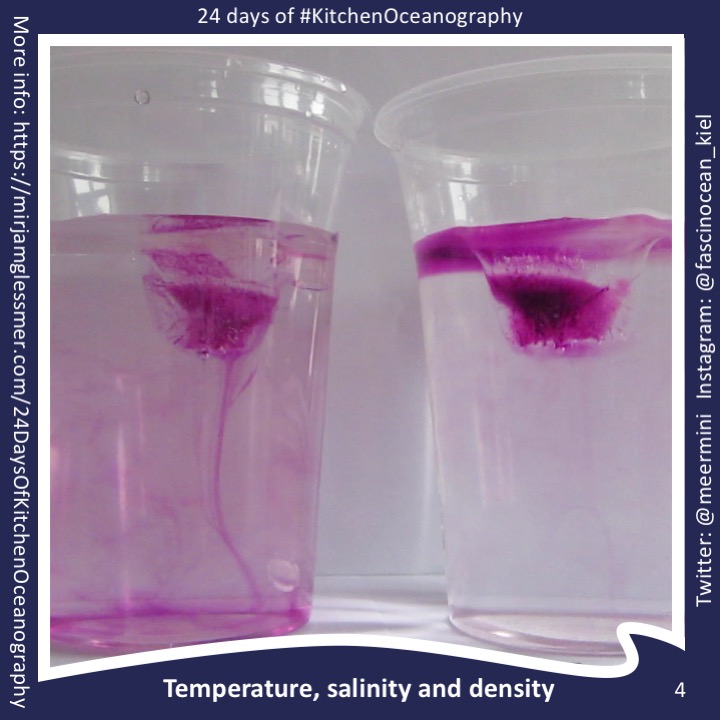
Ice cubes melting in fresh water and salt water
Today we are doing the melting ice cubes experiment in fancy glasses, because Elin is giving a fancy lecture tonight: The Nansen Memorial Lecture of the Norwegian Science Academy in Oslo! Cheers! We each had green ice cubes in our glasses, but one of our glasses contained fresh water and the other one salt water, […]

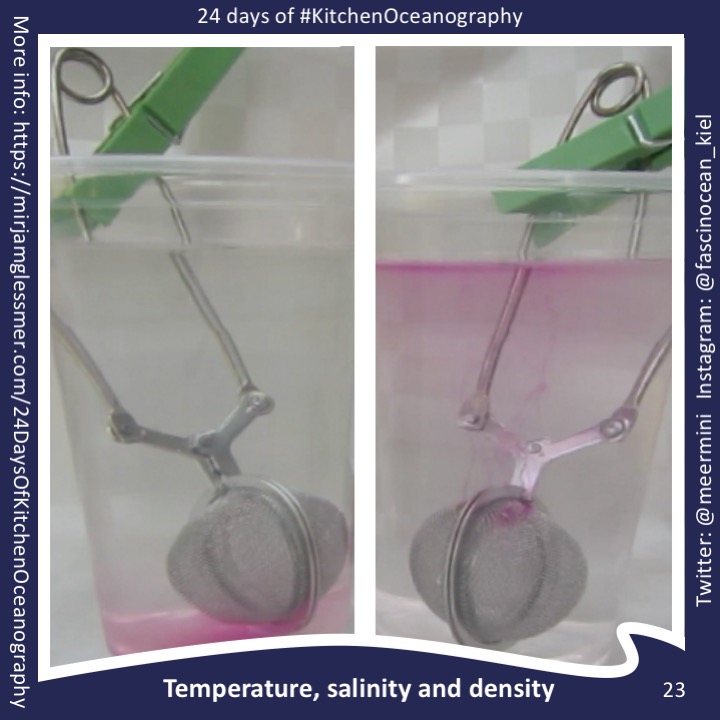
Experiment: Ice cubes melting in fresh water and salt water
Explore how melting of ice cubes floating in water is influenced by the salinity of the water. Important oceanographic concepts like density and density driven currents are visualized and can be discussed on the basis of this experiment. Context Audience This hands-on experiment is suited for many different audiences and can be used to achieve a wealth […]
Melting ice cubes experiment — observing the finer details
If you don’t know my favourite experiment for practically all purposes yet (Introduction to experimenting? Check! Thermohaline circulation? Check! Lab safety? Check! Scientific process? Check! And the list goes on and on…), check it out here. (Seriously, of you don’t recognize the experiment from the picture below, you need to read up on it, it’s […]
Teacher training at Lotseninsel
As I mentioned yesterday, I recently contributed to a teacher training on Lotseninsel, a tiny island on the Baltic Sea coast. The training was run by the Ozean:Labor of the Kieler Forschungswerkstatt, and we spent Friday to Sunday there. I’m going to show you some impressions of that weekend here. At first, it did not look […]
Melting ice cubes & thermal imaging camera
I haven’t talked about my favourite experiment in a long time (before using it last week in the MeerKlima congress and suddenly talking about it all the time again), because I felt like I had said everything there is to say (see a pretty comprehensive review here) BUT! a while back my colleagues started playing with a […]
My workshop at MeerKlima.de
Today I ran a workshop at the MeerKlima.de congress in Hamburg: A congress for high school students, organised by a student committee. The large lecture theatre of the chemistry department at the University of Hamburg was crowded for the opening lecture by Mojib Latif: For my workshop, however, we set a limit of 40 participants due […]
Workshop prep and a riddle
Looking at the picture below, can you guess which experiment I am going to do at the MeerKlima.de workshop? Yep, my favourite experiment — melting ice cubes! :-) And I am obviously prepared for several extensions of the classic experiment should the students be so inclined… Now I only need to get the ice cubes from […]
Considered exemplary: My “ice cubes melting in fresh water and salt water” in the “on the cutting edge” teaching collection! :-)
After reading recently that I am being considered the queen of the melting ice cube (aaaaw, thank you!!!), having my movies of the experiment featured in Elin Darelius and Petra Langebroek’s article on “fun in the kitchen”, and hearing that the activity I posted on the “On The Cutting Edge”‘s website using the very same experiment has been […]
Using the “melting ice cube” experiment to let future instructors experience inquiry-based learning.
Using the “melting ice cube” experiment to let future instructors experience inquiry-based learning. I recently (well, last year, but you know…) got the chance to fill in for a colleague and teach part of a workshop that prepares teaching staff for using inquiry-based learning in their own teaching. My part was to bring in an experiment […]
Oceanography PBL workshop and case
My awesome colleague Marisa ran another workshop on Problem-Based Learning (PBL) in which I was lucky enough to assist. For the last workshop for people who are planning to use PBL in their teaching, we used the solar eclipse to build a case around. Since this time we weren’t as lucky to have a solar eclipse happening on […]
Ice cubes melting at the bottom of the beakers
Because surely there is one more post in this topic? ;-) For those of you who haven’t heard about the “melting ice cube” obsession of mine, please check out the links to other posts at the end of this post. For everybody else’s sake, let’s dive right in! When Kristin and I ran the workshop […]
Why folic acid might be good for people, but not so good for tank experiments
I had to do the complete series of experiments, of course… The other day I mentioned that I had used salt from my kitchen for the “ice cubes melting in fresh and salt water” experiment, and that that salt was the super healthy one that was both iodized and containing folic acid. And what happened […]
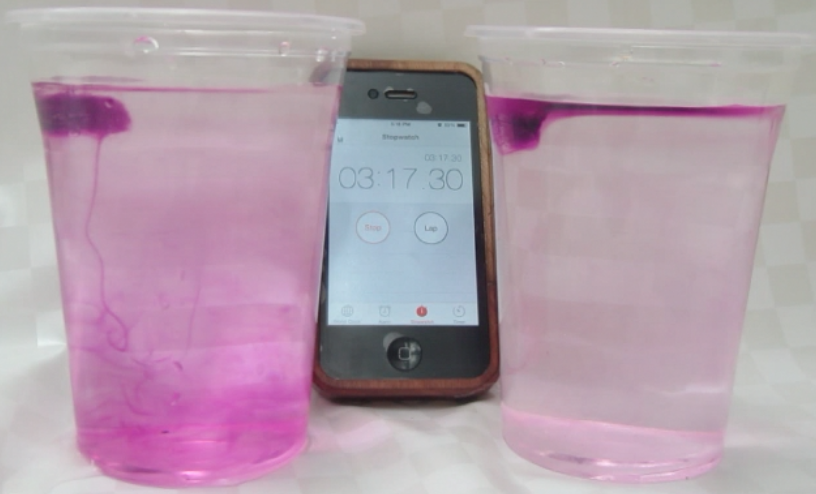
Melting ice cubes, again
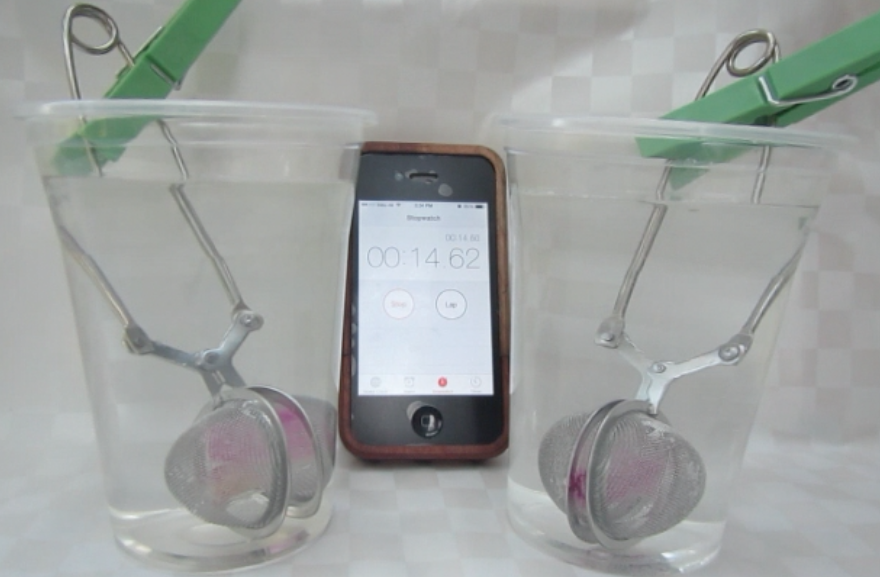
Somehow I am stuck on this demonstration! I can’t let go of this experiment. Last time I posted about it, someone (Hallo Papa!) complained about the background and how I should set a timer and a ruler next to the beakers for scale. The background and timer I did something about, but the ruler I […]
Conducting experiments at EMSEA14
Kristin’s and my workshop at EMSEA14. As I mentioned before, Kristin Richter and I are running the workshop “Conducting oceanographic experiments in a conventional classroom anywhere” at the European Marine Science Educator’s Association Meeting in Gothenburg, Sweden. There is quite an active Twitter crowd around, so you can follow the storyfied meeting or look out for […]
Melting ice cubes reloaded
Or why you should pay attention to the kind of salt you use for your experiments. The melting ice cubes in salt and fresh water is one of my favorites that I haven’t written about in a long time, even though (or possibly: because) I wrote a whole series about it last year (see links at […]
Guest post: The mystery of the cold room
Guest post by Kristin Richter! Today I’m excited to bring to you a guest post from Innsbruck, Austria, written by my friend Kristin Richter. Kristin ran the oceanography lab in Bergen before I took over, and she is a total enabler when it comes to deciding between playing with water, ice and food dye, or doing “real” […]
Dangers of blogging, or ice cubes melting in fresh water and salt water
When students have read blog posts of mine before doing experiments in class, it takes away a lot of the exploration. Since I was planning to blog about the CMM31 course, I had told students that I often blogged about my teaching and asked for their consent to share their images and details from our […]
Melting ice cubes – what contexts to use this experiment in (post 4/4)
What contexts can the “ice cubes melting in fresh water and in salt water” experiment be used in? As you might have noticed, I really like the “ice cubes melting in fresh water and in salt water” experiment. Initially, I had only three posts planned on the topic (post 1 and 2 showing different variation […]
Melting ice cubes – one experiment, many ways (post 3/4)
Different didactical settings in which the “ice cubes melting in fresh and salt water” experiment can be used. In part 1 and 2 of this series, I showed two different ways of using the “ice cubes melting in fresh water and salt water” experiment in lectures. Today I want to back up a little bit […]
Ice cubes melting in fresh water and salt water (post 2/4)
The “ice cubes melting in fresh water and salt water” experiment the way I usually use it in class. — Edit — For an updated description of this experiment please go to this page! — Edit — You might remember the “ice cubes melting in fresh water and salt water experiment” from a couple of […]
Ice cubes melting in salt water and freshwater (post 1/4)
Experiment to visualize the effects of density differences on ocean circulation. This is the first post in a series on one of my favorite in-class experiments; I have so much to say about it that we’ll have to break it up into several posts. Post 1 (this post) will present one setup of the experiment, […]