Tag Archives: hands-on experiment

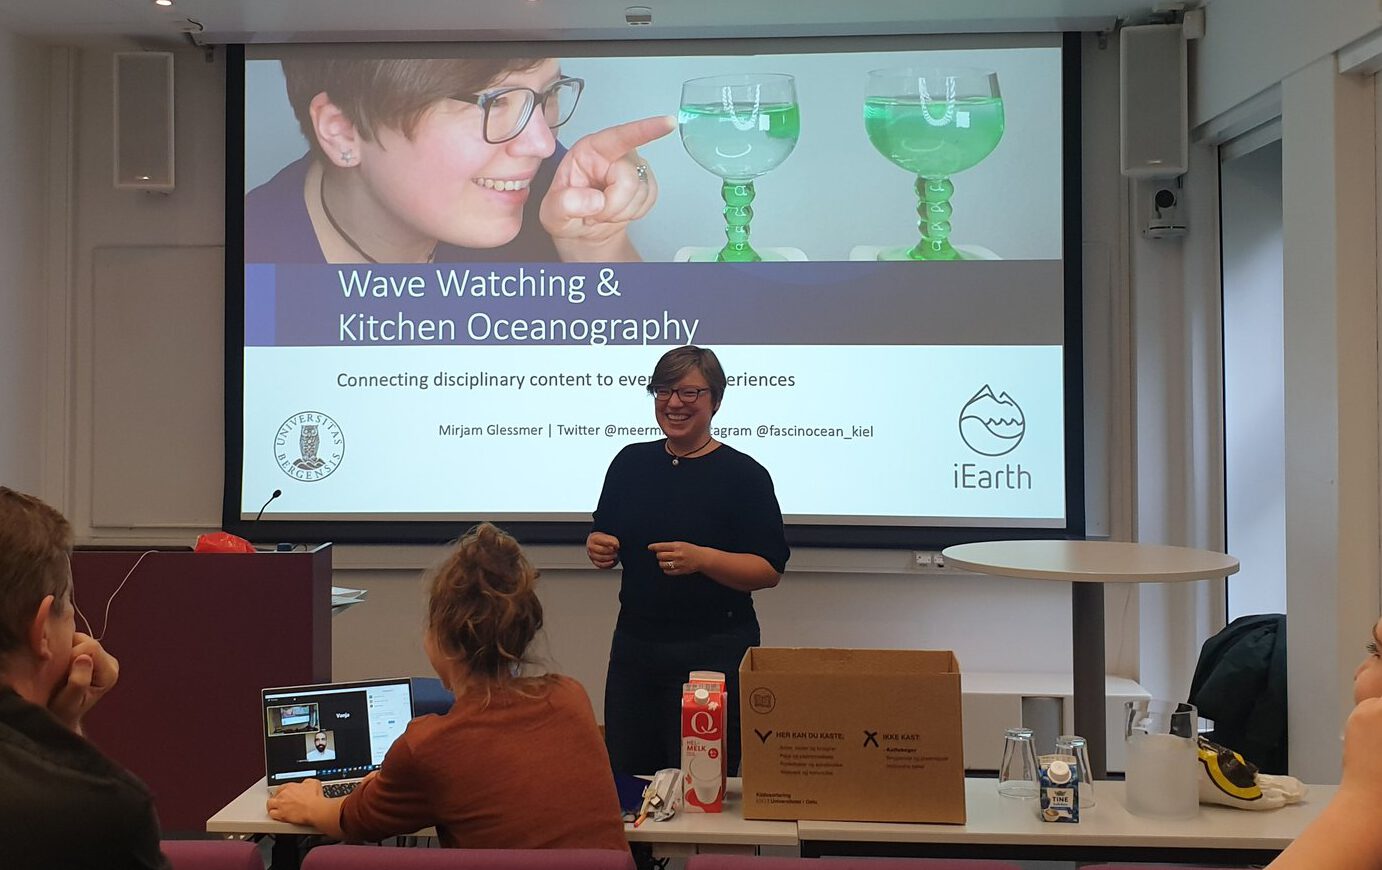
Using coffee in a talk on kitchen oceanography

I have been a bit quiet on here recently, because I had so many exciting projects going on that I did not manage to document them in real time (well, not on here anyway, but partly on my Insta).

One of those projects is on #KitchenOceanography with coffee, where I have compiled a lot of interesting experiments into a postcard. And the postcards arrived yesterday! (Thanks, Vanja, for picking them up!)

My super cool new postcards in front of the first slide of my presentation, because I had to take a picture when they arrived and that was the only background available :-D

Juuust in time for the “Hammer talk” presentation that I was scheduled to give at the Geo department of the University of Oslo. Where — you guessed it — I invited people to play with coffee!

Lots of things happening in coffees everywhere!

And I was so excited to see how well people played, and how beautiful the stratifications turned out!

Diffusive layers formed by double-diffusive mixing in a milk-coffee mixture

Here is even an internal wave on the stratification!

Thanks for coming and for playing! :)

My kids’ article on the formation of sea ice is out!

I recently published an article about how sea ice forms which, I think, turned out pretty well. But the coolest thing is the illustration that Jessie Miller did to go along with the article:

Illustration by Jessie Miller for my article published in Frontiers Young Minds, used with permission

Seeing this illustration (and, of course, having the article published) was a super nice surprise during the busy run-up to my big event, which is actually happening right now (good thing I know how to schedule blog posts ;-)). The illustration makes me suuuuper happy because to me it really captures what the article is about and, more importantly, what my goal in writing the article was. And I feel seen and understood in a profound way, and reminded of who I am. Never underestimate the power of #scicart! Thank you, Jessie!

Reference:

Glessmer, M. S. (2019) How Does Ice Form in the Sea? Front. Young Minds 7:79. doi: 10.3389/frym.2019.00079

Experiment: Ice cubes melting in fresh water and salt water

Explore how melting of ice cubes floating in water is influenced by the salinity of the water. Important oceanographic concepts like density and density driven currents are visualized and can be discussed on the basis of this experiment.

Context

Audience

This hands-on experiment is suited for many different audiences and can be used to achieve a wealth of different learning goals. Audience ranges from first-graders over undergraduates in physical oceanography to outreach activities with the general public. Depending on the audience, this activity can be embedded in very different contexts: For children, either in their physics teaching to motivate learning about concepts like density, or in the context of learning about the climate system and ocean circulation. For college/university students the activity can either be used in physics teaching to get a different view on density; in oceanography/Earth science to talk about ocean circulation and processes that are important there; to motivate the scientific process; or to practice writing lab reports (you can be sure that students will at some point be tasting the water to make sure they didn’t accidentally swap the salt water and fresh water cup – a great teachable moment for a) Never putting anything in your mouth in a laboratory setting, and b) Always documenting exactly what you are doing because stuff that you think you will definitely remember obviously isn’t remembered that clearly after all). For the general public, this is typically a stand-alone activity.

Skills and concepts that students must have mastered

It helps if the concept of density is known, but the experiment can also be used to introduce or deepen the understanding of the concept.

How the activity is situated in the course

I use this activity in different ways: a) as a simple in-class experiment that we use to discuss the scientific method, as well as what needs to be noted in lab journals and what makes a good lab report, or density-driven circulation; b) to engage non-majors or the general public in thinking about ocean circulation, what drives ocean currents, … in one-off presentations.


Goals

Content/concepts goals for this activity

Students learn about concepts that are important not only in physical oceanography, but in any physical or Earth science: density in general; density of water in particular, depending on the water’s temperature and salinity; how differences in density can drive currents both in the model and in the world ocean; how different processes acting at the same time can lead to unexpected results; how to model large scale processes in a simple experiment. After finishing the activity, they can formulate testable hypotheses, are able to reason based on density how a flow field will develop and they can compare the situations in the cups to the “real” ocean.

Higher order thinking skills goals for this activity

Students learn about and practice the use of the scientific method: formulation of hypotheses, testing, evaluating and reformulating.

Other skills goals for this activity

Students practice writing lab reports, making observations, working in groups.


Description and Teaching Materials

Materials

(per group of 2-4 students):

  • 1 clear plastic cup filled with room-temperature salt water (35psu or higher, i.e. 7 or more tea spoons of table salt per liter water), marked as salt water (optional)
  • 1 clear plastic cup filled with room-temperature fresh water, marked as fresh water (optional)
  • 2 ice cubes
  • liquid food dye either in drop bottle, with a pipette or with a straw as plunging syphon

Description

Before the experiment is started, students are asked to make a prediction which ice cube will melt faster, the one in salt water or the one in fresh water. Students discuss within their groups and commit to one hypothesis.
Students then place the ice cubes into the cups and start a stop watch/note the time. Students observe one of the ice cube melting faster than the other one. When it becomes obvious that one is indeed melting faster, a drop of food dye can be added on each of the ice cubes to color the melt water. Students take the time until each of the ice cubes has melted completely.

Discussion

The ice cube in the cup containing the fresh water will melt faster, because the (fresh) melt water is colder than the room-temperature fresh water in the cup. Hence its density is higher and it sinks to the bottom of the cup, being replaced by warmer waters at the ice cube. In contrast, the cold and fresh melt water in the salt water cup is less dense than the salt water, hence it forms a layer on top of the salt water and doesn’t induce a circulation like the one in the fresh water cup. The circulation is clearly visible as soon as the food dye is added: While in the freshwater case the whole water column changes color, only a thin meltwater layer on top of the salt water is colored (for clarification, see images in the presentation below)


Teaching Notes and Tips

Students usually assume that the ice cube in salt water will melt faster than the one in fresh water, “because salt is used to de-ice streets in winter”. Have students explicitly state their hypothesis (“the one in salt water will melt faster!”), so when they measure the time it takes the ice cubes to melt, they realize that their experiment does not support their hypothesis and start discussing why that is the case. (Elicit the misconception, so it can be confronted and resolved!)

My experience with this experiment is that all groups behave very consistently:

  • At least 80% of your audience will be very sure that the ice cube in salt water will melt faster than the one in fresh water. The other 20% will give the correct hypothesis, but only because they expect a trick question, and they will most likely not be able to come up with an explanation.
  • You can be 100% sure that at least in one group, someone will say “oh wait, which was the salt water again?” which hands you on a plate the opportunity to say “see — this is a great experiment to use when talking about why we need to write good documentations already while we are doing the experiment!”
  • You can also be 100% sure that in that group, someone will taste the water to make sure they know which cup contains the salt water. Which lets you say your “see — perfect experiment to talk about lab safety stuff! Never ever put things in your mouth in a lab!”
  • You can also be sure, that people come up with new experiments they want to try.
    • At EMSEA14, people asked what would happen if the ice cubes were held at the bottom of the beaker.
    • At a workshop on inquiry-based learning, people asked what the dye would do if there was no ice in the cups, just salt water and fresh water. Perfect opportunity to say “try! Then you’ll know! And btw — isn’t this experiment perfect to inspire the spirit of research (or however you would say that in English – “Forschergeist” is what I mean!). This is what you see in the pictures in this blogpost.

It is always a good idea to have plenty of spare ice cubes and salt/fresh water at room temperature ready so people can run the experiment again if they decide to either focus on something they didn’t observe well enough the first time round, or try a modified experiment like the ones described above.

A reviewer of this activity asked how easily students overcome the idea that water in the cup has to have just one temperature. In my experience this is not an issue at all – students keep “pointing” and thereby touching the cups, and in the thin-walled plastic cups I typically use the temperature gradient between “cold” melt water and “warm” salt water is easily felt. The (careful!) touching of the cups can also be explicitly encouraged.

Different ways to use this experiment

This experiment can be used in many different ways depending on the audience you are working with.

  • Demonstration: If you want to show this experiment rather than having students conduct it themselves, using colored ice cubes is the way to go (see experiment here). The dye focuses the observer’s attention on the melt water and makes it much easier to observe the experiment from a distance, on a screen or via a projector. Dying the ice cubes makes understanding much easier, but it also diminishes the feeling of exploration a lot – there is no mystery involved any more. And remember in order for demonstrations to increase the learning outcome, they need to be embedded in a larger didactical setting, including forming of hypotheses before the experiment is run and debriefing afterwards.
  • Structured activity: For an audience with little knowledge about physics, you might want to start with a very structured activity, much like the one described above. Students are handed (non-colored) ice cubes, cups with salt water and fresh water and are asked to make a prediction about which of the ice cubes is going to melt faster. Students test their hypothesis, find the results of the experiment in support with it or not, and we discuss. This is how I usually use this experiment in class (see discussion here).The advantage of using this approach is that students have clear instructions that they can easily follow. Depending on how observant the group is, instructions can be very detailed (“Start the stop watch when you put the ice cubes in the water. Write down the time when the first ice cube has melted completely, and which of the ice cubes it was. Write down the time when the second ice cube has melted completely. …”) or more open (“observe the ice cubes melting”).
  • Problem-solving activity: Depending on your goals with this experiment, you could also consider making it a problem-solving activity: You would hand out the materials and ask the students to design an experiment to figure out which of the cups contains fresh water and which salt water (no tasting, of course!). This is a very nice exercise and students learn a lot from designing the experiment themselves.
  • Open-ended investigation: In this case, students are handed the materials, knowing which cup contains fresh and salt water. But instead of being asked a specific question, they are told to use the materials to learn as much as they can about salt water, fresh water, temperature and density.As with the problem-solving exercise, this is a very time-intensive undertaking that does not seem feasible in the framework we are operating in. Also it is hard to predict what kind of experiments the students will come up with, and if they will learn what you want them to learn. On the other hand, students typically learn much more because they are free to explore and not bound by a specific instruction from you, so maybe give it a try?
  • Problem-based learning: This experiment is also very well suited in a Problem-Based Learning setting, both to work on the experiment itself or, as we did, to have instructors experience how problem-based learning works so they can use it in their own teaching later. Find a suggested case and a description of our experiences with it here.
  • Inquiry-based learning: Similarly as with Problem-Based Learning, this experiment can be used to let future instructors experience the method of inquiry-based learning from a student perspective. For my audience, people teaching in STEM, this is a nice case since it is close enough to their topics so they can easily make the transfer from this case to their own teaching, yet obscure enough that they really are learners in the situation.

Pro tip: If you are not quite sure how well your students will be able to cope with this experiment, prepare ice cubes dyed with food coloring and use them in a demonstration if students need more help seeing what is going on, or even let students work with colored ice cubes right from the start. If ice cubes and hence melt water are dyed right away, it becomes a lot easier to observe and deduct what is happening. Feel free to bring the photos or time lapse movie below as a backup, too!

dyed_ice_cubes_01

Dyed ice cubes about to be put into fresh water (left) and salt water (right)

dyed_ice_cubes_02

When the ice cubes start melting, it becomes very clear that they do so in different manners. In the left cup, the cold meltwater from the ice cube is denser than the lukewarm water in the cup. Hence it sinks to the bottom of the beaker and the water surrounding the ice cube is replaced by warmer water. On the right side, the lukewarm salt water is denser than the cold melt water, hence the cold meltwater floats on top, surrounding the ice cube which therefore melts more slowly than the one in the other cup.

dyed_ice_cubes_03

The ice cube in the fresh water cup (left) is almost completely gone and the water column is fairly mixed with melt water having sunk to the bottom of the beaker. The ice cube in the salt water cup (right) is still a lot bigger and a clear stratification is visible with the dyed meltwater on top of the salt water.

And here a time-lapse movie of the experiment.

Another way to look at the experiment: With a thermal imaging camera!

screen-shot-2017-06-11-at-17-12-29

Cold (dark purple) ice cubes held by warm (white-ish) fingers over room-temperature (orange) cups with water

screen-shot-2017-06-11-at-17-12-55

After a while, both cups show very different temperature distributions. The left one is still room temperature(-ish) on top and very cold at the bottom. The other one is very cold on top and warmer below.

screen-shot-2017-06-11-at-17-13-20

When you look in from the top, you see that in the left cup the ice has completely melted (and the melt water sunk to the bottom), whereas in the right cup there is still ice floating on top.

Assessment

Depending on the audience I use this experiment with, the learning goals are very different. Therefore, no one assessment strategy can be used for all different applications. Below, I am giving examples of what are possible ways to assess specific learning goals:

– Students apply the scientific process correctly: Look at how hypotheses are stated (“salt melts ice” is not a testable hypothesis, “similar-sized ice cubes will melt faster in salt water than in fresh water of the same temperature” is).

– Students are able to determine what kind of density-driven circulation will develop: Suggest modifications to the experiment (e.g. ice cubes are made from salt water, or ice cubes are held at the bottom of the cups while melting) and ask students to predict what the developing circulation will look like.

– Students can make the transfer from the flow field in the cup to the general ocean circulation: Let students compare the situation in the cup with different oceanic regions (the high Arctic, the Nordic Seas, …) and argue for which of those regions displays a similar circulation or what the differences are (in terms of salinity, temperature, and their influence on density).

In general, while students run the experiment, I walk around and listen to discussions or ask questions if students aren’t already discussing. Talking to students it becomes clear very quickly whether they understand the concept or not. Asking them to draw “what is happening in the cup” is a very useful indicator of how much they understand what is going on. If they draw something close to what is shown on slide 28 of the attached slide show, they have grasped the main points.


Equipment

Don’t worry, it is totally feasible to bring all the equipment you need with you to run the experiment anywhere you want. This is what we brought to EMSEA14 to run the workshop three times with 40 participants each:

EMSEA14_list

What we brought to EMSEA14 to run workshops on the ice cubes melting in fresh and salt water experiment

In one big grocery bag:

  • 4 ice cube trays
  • 4 ice cube bags (backup)
  • 2 thermos flasks (to store ice cubes)
  • 1 insulating carrier bag (left)
  • 4 empty 1.5l water bottles to mix & store salt water in
  • 1 tea spoon for measuring salt
  • 500g table salt
  • 21 clear plastic cups for experiments
  • 10 clear plastic cups to hand out ice cubes in
  • 11 straws (as pipettes)
  • 1 flask of food dye
  • 11 little cups with lids to hand out food dye in
  • nerves of steel (not shown :-))

And if you are my friend, you might also get the “ice cube special” — a pink bucket with all you will ever need to run the experiment! Below is what the ice cube experiment kit looks like that I made for Marisa, with labels and everything…

IMG_4202

An “ice cube experiment” kit that I made for a friend. Want one, too?

References and Resources

This activity has been discussed before, for example here:

I have also written about it a lot on my blog, see posts tagged “melting ice cubes experiment“.

P.S.: This text originally appeared on my website as a page. Due to upcoming restructuring of this website, I am reposting it as a blog post. This is the original version last modified on November 4th, 2015.

I might write things differently if I was writing them now, but I still like to keep my blog as archive of my thoughts.

Melting ice cubes experiment — observing the finer details

If you don’t know my favourite experiment for practically all purposes yet (Introduction to experimenting? Check! Thermohaline circulation? Check! Lab safety? Check! Scientific process? Check! And the list goes on and on…), check it out here. (Seriously, of you don’t recognize the experiment from the picture below, you need to read up on it, it’s awesome! :-))

dyed_ice_cubes_02

Susann and I got funding from PerLe (our university’s project to support teaching innovation) to add a couple of cool new features to Susann’s “intro to meteorology” lecture, and doing a hands-on experiment with 50 students in a lecture theatre in their second lecture was only one of the first of many more to come.

We used the experiment to introduce the students to oceanic circulation, and this experiment is, in my experience, very engaging and sparks curiosity, as well as being very nicely suited as a reminder that things are not as easy as they seem to be when you see those nice plots of the great conveyor belt and all the other simplified plots that you typically see in intro-level lectures. Especially understanding that there are many different processes at play simultaneously, and that they have different orders of magnitude and might act in different directions helps counteract the oversimplified views of the climate system that might otherwise be formed.

I usually use dye to make it easier to observe what’s going on in the experiment (either by freezing it directly into the ice cubes as shown in the picture on top of this blog post, or by dripping it onto the melting ice cubes when students have started to observe that — counter to their intuition — the ice cube in the fresh water cup is melting faster than the one in the salt water cup).  We had dye at hand, but I decided on the spur of the moment to not use it, because the students were already focussing on other, more subtle, aspects that the dye would only distract from:

The shape of the ice cubes

In many of the student groups, the most prominent observation was that the shape of the melting ice cubes was very different in the fresh water and salt water case. In the fresh water case, the ice cube melted from the sides inwards: as a cylindrical shape with a radius that was decreasing over time, but in any instance more or less constant for all depths. In the salt water case, however, the ice cube melted upwards: The top did not melt very much at all, but the deeper down you looked the more was melting away. Why?

Condensation on the sides of the cup

Another observation that I prompted was in what regions the cups showed condensation. In the fresh water case, there was a little condensation going on everywhere below the water line, and sometimes there were vertical streaks down from where the ice cube was touching the wall. In the salt water case, there was only a small band of intense condensation close to the water level.

This, not surprisingly, looks very similar to what a thermal imaging camera sees when observing the experiment (as described in this post).

screen-shot-2017-06-11-at-17-12-55

Taken together, those two observations are quite powerful in explaining what is going on, and it seemed to be a fun challenge for the students to figure out why there was condensation on the outside of the cups in the first place (does condensation occur in warmer or colder places?), what it meant that different places ended up being warmer or colder, and how all of that is connected to global ocean circulation. Definitely an experiment I would recommend you do! :-)

My favorite demonstration of the coolest mixing process: Salt fingering!

I am updating many of my old posts on experiments and combining multiple posts on the same topic to come up with a state-of-the-art post, so you can always find the best materials on here. And today I would like to present you my favorite experiment: Salt fingering!

Check out the new page I made for salt fingering!

IMG_9084

Self-portrait with salt fingers

As you guys might have noticed, I’ve been playing around with my site a quite bit. My blog has moved to mirjamglessmer.com/blog in order to make room for static pages of my favorite experiments or teaching tips right at the landing site mirjamglessmer.com. What do you think? Good idea? Did you notice anything that isn’t quite working yet or do you have advice or wishes? Let me know!

Tides in a glass

A very simple experiment to show how waves can travel around an ocean basin.

I wrote these instructions for a book project that I was lucky enough to get involved in at the very last minute and figured I could just share them here, too. Why not try a new style every once in a while? You tidal purists out there – come up with a better experiment if you aren’t happy with this one! :-)

  • Age: 6 years and above
  • Group size: 1-3 per group
  • Time: 15 min
  • Topic: Tides in enclosed basins 

Resources and Materials:

  • 1 clear plastic cup
  • 1 waterproof pen
  • water

Introduction:

[In a previous experiment] we have learned how tides are caused by the sun and the moon. In the picture there, we see the two “mountains” of water that form on either sided of the earth. The earth rotates underneath those two “mountains” of water, which is what causes high tides twice a day.

But what happens when those “mountains” of water reach a coast? Clearly the continents are not flooded twice a day every day, so the “mountains” of water cannot travel all the way around the globe undisturbed. What does happen instead is that the tidal wave will propagate around the rim of an ocean basin, even in semi-enclosed basins like the North Sea, which we will show in the experiment below.

  1. Fill the plastic cup approximately half full with water.
  2. Mark the still water level with a permanent marker.
  3. Gently start twirling the cup and observe how the water level starts changing: On one side of the cup it rises, on the other side it falls.
  4. Continue twirling the cup and observe how the “mountain” of water moves all the way round the cup, leaning against the side of the cup, and how opposite of the “mountain” a “valley” forms that also travels around the cup.
  5. Mark those two new water levels: The higher one is the high tide line of your ocean in a cup, the lower one the low tide line.
Tides_MSB

Figure 1: Twirl a cup filled with water to see how tides propagate around an ocean basin

This is how high tide and low tide travel around an ocean basin. In the real world, though, coastlines are not as smooth as the walls of a cup, and also ocean basins are connected to each other, so tides in different basins interact. For a real world example, look at the tides in the North Sea, shown in Figure 2.

Tides2_MSB

Figure 2: Simplified timing of tides in the North Sea.


Water seeks its level.

A solution for the siphon problem of the fjord circulation experiment.

After having run the fjord circulation experiments for several years in a row with several groups of students each year, Pierre and I finally figured out a good way to keep the water level in the tank constant. As you might remember from the sketch in the previous post or can see in the figure below, initially we used to have the tank separated in a main compartment and a reservoir.

 But there were a couple of problems associated with this setup. Once, the lock separating the two parts of the tank fell over during the experiment. Then there are bound to be leaks. Sometimes we forget to empty the reservoir and the water level rises to critical levels. In short, it’s a hassle.

So the next year, we decided to run the experiment in a big sink and tip the tank slightly, so that water would just flow out at the lower end at the same rate that it was being added on the other side. Which kinda worked, but it was messy.

So this year, we came up with the perfect solution. The experiment is still being run in a sink, but now a hose, completely filled with water, connects the main tank with a beaker. The hight of the rim of the beaker is set to the desired water level of the big tank. Now when we add water to the big tank, there is an (almost – if the hose isn’t wide enough) instant outflow, so the water level in the tank stays the same.

Tankausfluss

New setup: A bubble-free hose connecting the tank and a reservoir to regulate the water level in the tank.

This way, we also get to regulate the depth from where the outflowing water is being removed. Neat, isn’t it?