Category Archives: other

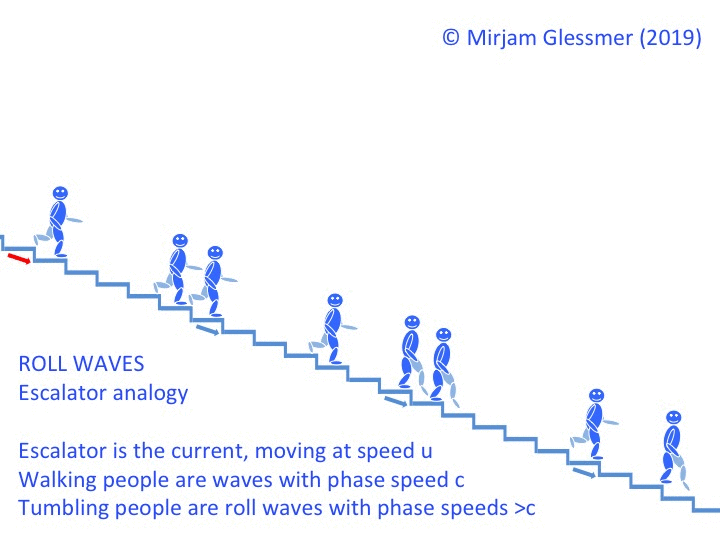
Guest post by Alice Langhans: Scientific reasons why the ocean boosts mental health

My friend Alice runs a really interesting Instagram account that I love following. She posts about being a PhD student in physics didactics, does #experimentalfriday (which you might remember from her recent guest post on my blog), gives helpful advice for mental health topics and takes beautiful pictures. Check it out — @scied_alice. A couple of days ago she posted about having found some research on how proximity to the ocean and a person’s state of mind are connected. So obviously I had to ask whether she would write about it for my blog, and I am super stoked she did! Here is what she writes:

Scientific reasons why the ocean boosts mental health

When was the last time you were at the sea and just took in everything it offered? The smell of salty water, the light breeze on your skin, the sound of rolling waves. Do you remember the feeling it gave you? That sense of calmness and relaxation, the inner peace and quiet, ultimately setting you in a state of easy meditation, giving you that break from everyday life you just needed? The impact of the ocean on physical, mental and emotional well-being seems so obvious and intuitive but there is actual scientific research on that topic. Who wouldn’t want to understand what exactly is going on in the humans’ mind and body when encountered with the ocean or any great body of water? So let me tell you about some of the findings I stumbled upon, researching a short post on why I myself like to live at the coast of the Baltic Sea.

I Golden Bay Beach, Malta (Picture by Alice Langhans)

It seems like yesterday, that the professor giving a speech at my graduation ceremony talked about the happiness level in several states in Germany and how lucky we are if we get a job in Schleswig-Holstein, which scored the happiest state several years in a row now (Schlinkert & Raffelhüschen, 2018). I had to smile because at that moment I had already taken a job in Kiel, the state capitol of Schleswig-Holstein. Apparently, the proximity to the coast and the access to blue (water) space has shown to have a positive effect on well-being. This could be one factor explaining the happiness level in Schleswig-Holstein, because the state is enclosed between the North and the Baltic Sea on each side and everyone I know enjoys that advantage to its fullest by spending lots of time at the waterfront. According to a British study, citizens living at the coast report better physical and mental health (White, Alcock, Wheeler, & Depledge, 2013)and Japanese colleagues, Peng and Yamashita(2016), concluded that people with ocean view from their homes were calmer than their inland neighbors. And if you are thinking of choosing a retirement home at the coast, they have good news as well: positive psychological effects were highest for elderly people.

IIBay of Kiel, Laboe, Germany (picture by Alice Langhans)

There seems to be something happening to people when visiting the beach or waterfront and scientific research finds answers to that in our senses. The feeling of calmness, relaxation and peace is stimulated by the view of the blue space. A study conducted in Wellington, NZ showed lower psychological distress in people with visibility of what they called blue space, images of the Pacific Ocean and the Tasman Sea (Nutsford, Pearson, Kingham, & Reitsma, 2016). Neuroscientist Michael Merzenich claims that being in the clear and simple environment of the ocean, humans have a sense of security and safety because it’s a stable and predictable environment (Yeoman, 2013). Makes sense, doesn’t it? Because everything unusual is instantly outstanding against the calm and flat horizon.

III Dingli Cliffs, Malta (Picture by Alice Langhans)

And there is even more to a visit to the beach than just the view of water. It’s the sheer sound of incoming waves that soothes the mind and relaxes the spirit. Sounds with wave patterns were found to be the most relaxing because they lower the cortisol level, a stress hormone and activate the parasympathetic nervous system, slowing us down and promoting relaxation (Heiser, 2017). This has the same effect as meditation.

IV Hargen an Zee, Netherlands (Picture by Alice Langhans)

So the next time you’re at the beach: Take everything in, take a deep breath, concentrate on your body and the calmness the ocean triggers in you and enhance those positive effects the ocean has on you! Enjoy!

References

Heiser, C. (2017). What the beach does to your brain. Retrieved from https://www.nbcnews.com/better/health/what-beach-does-your-brain-ncna787231

Nutsford, D., Pearson, A. L., Kingham, S., & Reitsma, F. (2016). Residential exposure to visible blue space (but not green space) associated with lower psychological distress in a capital city. Health & Place, 39, 70–78. https://doi.org/10.1016/j.healthplace.2016.03.002

Peng, C., & Yamashita, K. (2016). Effects of the Coastal Environment on Well-being. Journal of Coastal Zone Management, 19(2). https://doi.org/10.4172/2473-3350.1000421

Deutsche Post DHL. (2018). Deutsche Post Glücksatlas 2018: Weiter hohe Lebenszufriedenheit in Deutschland. Retrieved from https://www.dpdhl.com/content/dam/dpdhl/de/media-relations/press-releases/2018/pm-gluecksatlas-20181011.pdf

White, M. P., Alcock, I., Wheeler, B. W., & Depledge, M. H. (2013). Coastal proximity, health and well-being: Results from a longitudinal panel survey. Health & Place, 23, 97–103. https://doi.org/10.1016/j.healthplace.2013.05.006

Yeoman, B. (2013). Why the Beach Makes Us Happy. Retrieved from http://barryyeoman.com/2013/02/beach-happiness-neuroconservation/

Playing with roll wave animations

I love how powerful Powerpoint is, at the same time there surely is a way out there to create these kind of animations with a little less copy & pasting, and especially without manually moving tons of stuff by juuust a tiny little bit from frame to frame?

How would you build these kinds of pictures? I’m even considering Matlab at this point (which I really don’t think would be such a stupid idea after all)

This is an animated gif. If it isn’t playing, I have no idea why not… It is playing on Twitter (link here)

Fictitious forces (4/5): Coriolis – how not to teach it

Some demonstrations are really not as clever as we thought they might be.

We have talked about how to teach aspects of the Coriolis force recently, and just to spice it up: here is one thing that I tried that totally didn’t work out.

The idea was to have one student slowly and steadily turn a balloon around its axis to mirror the Earth’s spin, and another one drawing on the balloon with a sharpie.

The context was a class where many students didn’t have any physics background, and we wanted to understand atmospheric circulation, and why trade winds don’t blow straight north-south (or south-north on the Southern Hemisphere). And I still think that this demonstration kind of works for this specific purpose.

IMG_5092

The problem though: If you have a balloon and a sharpie, drawing one single trajectory and going “oh, I got it! So that is why the trade winds have a velocity component to the west!” (like I naively had imagined) is NOT what happens.

What happens instead is that students will draw tons of trajectories. And not only the ones that, even in this overly simplified system, show what I wanted them to see. Nope. They will also draw following a constant latitude, and then be confused as to why Coriolis force doesn’t seem to be acting. Or draw south-to-north on the Northern Hemisphere, and be confused why things are being deflected to the left. (And don’t get me wrong: this is good! They should start exploring. And they should be finding the limitations of demonstrations!)

IMG_5093Now. All of those issues that come up are things you can talk about and that can be explained. But I’m wondering whether this demo didn’t cause more harm than good, since the impression that might have stuck in the end is that Coriolis deflection only works under very specific circumstances, but most of the time it does not.

So this is not a demonstration I would recommend!


On vorticity

I’ve promised a long time ago to write a post on vorticity (Hallo Geli! :-)). So here it comes!

Vorticity is one of the concepts in oceanography that is often taught via its mathematical formulation, and which is therefore pretty difficult to grasp for those of us with less mathematical training. But it’s also a concept that you can have an intuitive grasp of, and I’ll try to show you how.

The easiest way to imagine what “vorticity” is, is to think of a little float in a flow. In a vorticity-free flow, that little float will always keep its orientation (see below). However if there is a shear in the flow, i.e. the flow field carries vorticity, it will start to turn.

vorticity1

Flow fields without vorticity (top) and with vorticity (bottom).

This even holds true for vortices: There are vorticity-free vortices as well as those that carry vorticity (as the name “vortex” would suggest).

vorticity2

Vorticity-laden and vorticity-free vortex. In the left plot, angular velocity of all particles is the same. In the right plot, angular velocity increases the closer you get to the center of the vortex.

If you think back to the discussion on a tank spinning up to reach solid body rotation, you might recognize that only the vortex with vorticity moves like a solid body. To me, a solid body is basically a fluid with so much friction in it, that molecules cannot change their position relative to each other. And that serves as my memory hook for one condition for the formation of vorticity – the flows must have viscous forces and friction in it.

This sounds very theoretical, but there are a lot of instances where you can spot vorticity in real life, for example twigs caught up twirling in eddies at the edge of streams are clearly moving in a vorticity-filled environment. Below, for example, the stream is clearly not vorticity-free.

Did this help a little? Or what else might help?

Transit of Venus and upcoming solar eclipse on March 20th!

In 2012, I happened to be at an ESWN workshop in Madison, WI, when, during one of the breaks, one of the participants mentioned that it might be possible to get into the historic Washburn Observatory to watch Venus’ transit. Of course I had to go!

We stood in a very long queue under overcast skies for a very long time. We slowly approached the observatory, all the while watching people ahead of us go in and leave disappointed – due to the clouds all they could see when inside were live streams from other observatories. Still, there was a lot of people still in front of us. We had dinner plans and we knew that we would have to be very lucky to make it in and out of the observatory and to the restaurant on time. Half our group left in order to not be late at dinner. The rest of us stayed, still hoping.

And then we were finally inside! The observatory itself was impressive enough, but then right when we were inside, the sun broke through the clouds. All the astronomers who had been there for hours and not seen anything got super excited, as did, of course, the rest of us. Having waited all that time, knowing that we would very likely not be able to see a thing, and then coming in the moment the skies were opening up? Unbelievable. I still get excited thinking about this 3 years later.

DSCF6448

Projection of the transit of Venus, observed at the Washburn Observatory in Madison, WI, on June 6th, 2012

The projection on the screen shown above only shows a small area of the sun, zoomed in on Venus. You can imagine the size of the projected sun by looking at the curvature on the upper left: That’s the real rim of the Sun, the rest of the circle is just due to the telescope. Watch a (very shaky) movie to get an impression of what it looked like:

So why am I telling you about this today? Because on Friday, there’ll be a solar eclipse and you should totally make sure to watch it! It won’t be a total eclipse where I’m at, but still, I’m looking forward to it! :-)

How can we use interactive flow simulations in teaching of hydrodynamics?

That was quite a teaser on Wednesday, wasn’t it? I said I had the solution to any hydrodynamics problem you might want to illustrate. So here we go:

I recently had the privilege to be given a private demonstration of the “Elbe” flow solver, which is being developed at Hamburg University of Technology. Elbe allows for near real time simulation of non-linear flows, and can be run in an interactive mode.

Look at the Karman vortex street below (their movie, not mine!) – doesn’t it remind you of the vortex street on a plate?

Now. How can we use such an awesome tool in teaching?

There are a couple of scenarios I could imagine.

1) Re-create flow fields.

This is mainly to help students get “a feel” for how a flow reacts to obstacles.

Provide students with a picture of a current field and ask them to recreate it as closely as possible. This is not about creating the exact same field, but about recognizing characteristics of a flow field and what might have caused them. Examples could include a Karman vortex street or a Kelvin Helmholtz instability.

Elbe_01

Possible sketches of A) Karman vortex street and B) Kelvin Helmholtz instabilities as examples for flow fields that students could be asked to recreate using Elbe.

In the above examples, students need to recognize, for example, that while a vortex street can be formed in a single-phase flow, a Kelvin Helmholtz instability typically forms on the boundary of layers of different densities in a shear flow (but could also form in a single continuous fluid), and recreate this in the model.

2) Visualize hydrodynamic concepts.

Here we would name a concept and ask students to set up a flow field that visualizes it. They might submit an annotated snapshot, for example. Possible examples are

– difference between stream lines, path lines and streak lines

– hydrodynamic paradox

– dead water

Elbe_02

Hydrodynamic paradox. Moored ships are pulled towards each other because the flow is faster between them than upstream of them. (yes, the current in the picture is coming from the left, yet the ships are drawn as if the current was coming from the right. Shit happens.)

3) Test engineering applications.

Here we could imagine giving students different shapes and asking them to find their optimal position in a flow field, for example the pitch of a given wing profile to maximize lift, or the relative placement of a ship’s hull and a submerged ball for maximum canceling of waves.

4) Understanding of limitations of model and/or theory. 

In some cases, students might be able to find optimal solutions from theory. In those cases it might be interesting to have them model those solutions and compare results with theoretical values. Can they come up with reasons why the modeled answers are likely different from the theoretical ones?

So far, so good. But how do we make sure that students don’t spend an insane amount of time fiddling with the nitty gritty details of the model, but focus on understanding hydrodynamics?

Combination of individual and group work

One idea might be to have students work individually on defining the important parameters (for example one- versus two-phase flow, obstacle at fixed position or moving, shape of obstacle) and then have them work in groups on putting those parameters into the model. If we were to grade this, we could give individual grades for individual answers to the first part, and then add a group grade in form of bonus points for a good model.

Model as a tool rather than the ultimate goal

Another idea would be to let them use the model as a tool rather than as the final application. As in students could be allowed to play with the model in order to, for example, figure out an approximate shape of an obstacle, and then they sketch their solution and annotate (e.g. “The longer X, the less turbulent region Y”). This would let them experience and explore hydrodynamics.

Peer-review

Whether or not a concept has been visualized well can be judged by the instructor, or it can become a learning activity in itself, for example as peer-review. Figuring out whether a visualization is correct or how it could be improved supports a deeper understanding of the concept as well as all kinds of interpersonal skills. In order to keep this interesting for students, several concepts could be visualized by different students and it can be made sure that the one students work on themselves is not the same as the one they will review later.

I am really excited to really start developing ideas on how to use this model in teaching. How would you use it?

Exploding water balloons – again!

I am usually very motivated to write posts for this blog, but for some reason today I’m not. I have interesting posts scheduled for next week, don’t you worry, but today was supposed to be a review of some literature on teaching and learning, and I just cannot be bothered. So instead you’ll get this:

Wasserbombe

Yep. I like playing with water!

As you’ll see in the movie below: All it takes to make a crappy mood go away are about two exploding water balloons and a camera that can do slow motion! :-)

Guest post: ‘OCEAN DRIFTERS – a secret world beneath the waves’

Today, I am very excited to share with you a guest post by Dr Richard Kirby, who recently produced an amazingly beautiful film on plankton (linked at the very bottom of this post, a MUST SEE!)

Dr Richard Kirby – the Plankton Pundit @planktonpundit, tells us why it is important not to overlook the plankton:

Plankton are the ocean’s drifters. The plankton is an amazing diversity of life forms that get their collective name from the Greek word Planktos, which means wanderer or drifter, since what unites all these creatures is that none can swim against a flow of water; they all drift at the mercy of the ocean currents. The plankton are incredibly important. They bring life to our seas through the plankton food web and the marine food chain it supports, and they play a major role in the Earth’s carbon cycle to influence our climate and weather. While the majority of the plankton are microscopic and so hidden from view, they also include the largest invertebrates on Earth – the jellyfish.

The plankton live mainly at the sea’s sunlit surface. Here, the microscopic phytoplankton begin the plankton food web underpinning life in the sea. These plant-like cells photosynthesise, using the energy in sunlight to combine carbon dioxide with water to create sugar and oxygen. In this way the phytoplankton begin the marine food chain. The phytoplankton are grazed by the herbivorous zooplankton (animal plankton) that in turn are eaten by other carnivorous zooplankton to create the plankton food web that supports life in the sea. Without the plankton the oceans would be a barren wilderness, there would be no fish, sharks or whales, no crabs, mussels, starfish or worms on the seabed or upon the seashore (many bottom-dwelling creatures begin their life in the plankton). Without the marine food chain there would also be no seabirds in the sky, and no penguins or polar bears on the ice.

The plankton do much more than just support the marine food web, however. As mentioned above, the plankton also play a central role in the global carbon cycle. You can find out how they do this by watching Richard’s remarkable Ocean Drifters film (see below) that is narrated by Sir David Attenborough. This short film not only reveals the incredible beauty of the plankton and their amazing and intriguing adaptations to life at the surface of the sea, but it describes how these tiny creatures influence our climate to have a global impact far greater than their size would suggest. The film also importantly, reveals how we are currently influencing the plankton with ramifications for the marine food chain and the ecology of the seas.

To find out more, visit Richard’s website http://www.planktonpundit.org.

Dr Richard Kirby is also the leader of the global Secchi Disk project www.secchidisk.org, the world-wide citizen science project engaging sailors in a study of the phytoplankton.

Dictionary oceanography terms English-Norwegian-German – Work in progress: we need you!

For anyone interested: a couple of years ago we started working on a collection of translations of oceanography terms in English, Norwegian and German. If you find it useful, please feel free to use and share it!

Oceanography terms: English – Norwegian – German

This dictionary is definitely a work in progress. If you find typos, better translations, if you are missing terms – give me a shout and I am happy to fix it. If you think this is super useful and would like to help develop it further (or just add to it whenever you just looked up a new term anyway and want to write it down somewhere you won’t lose it): I’d love to have you on board! Let me know and I’ll give you editing permissions on the document.

Also if you are a meteorologist, paleontologist, climate scientist or someone from any other related discipline and want to expand the scope to include your speciality, or if you want to add a new language – you are very welcome to join us!

Thanks to Eli, Sindre and Kjetil for helping me getting this started!