Tag Archives: vorticity

Rotating tank experiments on a cone

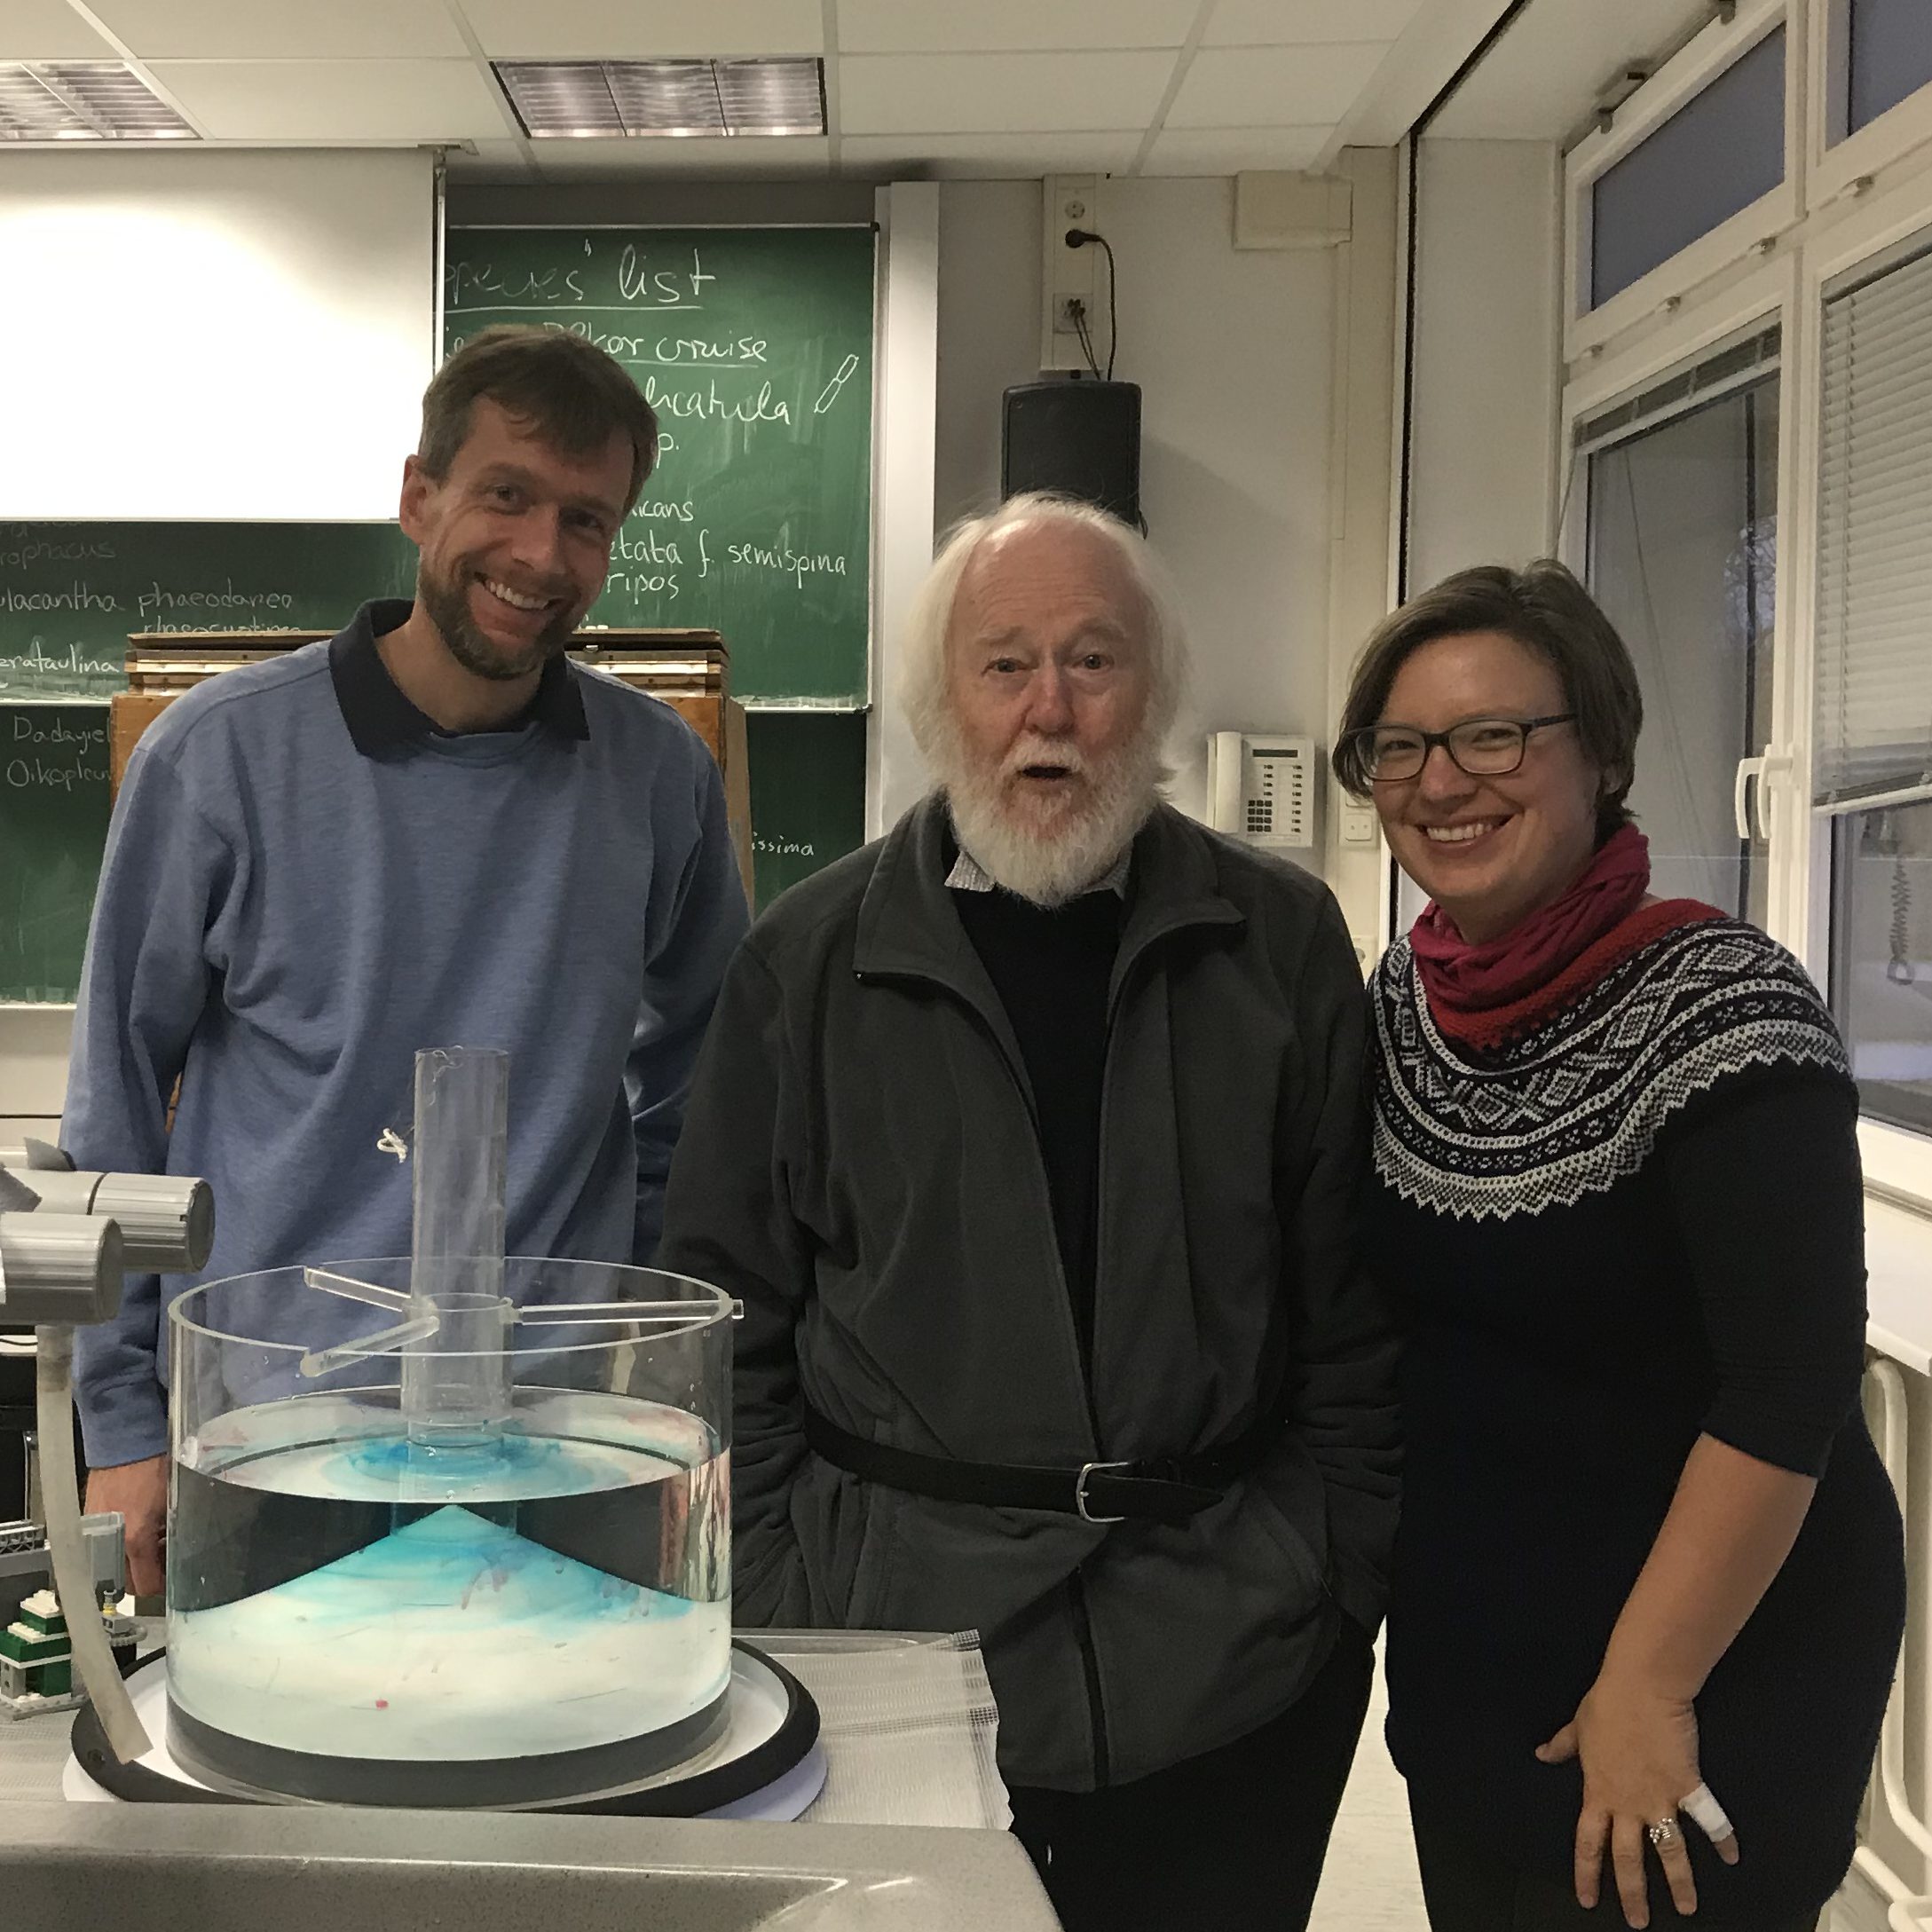
I had so much fun playing with rotating tank experiments on a cone this afternoon! And with Torge Martin (who I have the awesome #DryTheory2JuicyReality project with) and Rolf Käse (who got me into tank experiments with an amazing lab course back in 2004, that I still fondly remember). We tried so many different things, that I will at some point have to describe in detail, but for now I just need to share the excitement ;-)

Here, for example, a blue fish-shaped ice cube. This experiment is pretty much the topographic Rossby wave experiment described here, except now we aren’t on an inclined plane, but on a cone. Which is basically an infinitely long inclined plane — the ice cube doesn’t encounter a boundary as it travels west, it just goes round and round the tank until it melts. And look at the cool Rossby waves!

Then we did another one of our favourite experiments, the Hadley cell circulation. What was really fascinating to observe was how turbulence the turbulence that was introduced by dripping dye into the tank changed scales. At first, we had the typical 3D pattern with plumes shooting down. But over time, the pattern became more and more organized, larger, and 2D. See below: The blue dye had been in the tank for a little longer than the red dye, so the structures look completely different. But interesting to keep that in mind when interpreting structures we observe!

Here is another view of the same experiment. Since we are cooling in the middle and rotating very slowly (about 3 rotations per minute), the eddy structures aren’t completely 2D, but they are influenced by an overturning component.

This looks even cooler when done on a cone. Can you see how there is both an overturning component (i.e. the plumes running down the slope) and then still a strong column in the middle?

This just looks so incredibly beautiful!

And one last look on the eddies that develop. We saw that there are cyclonic eddies happening in the center of the tank and anti-cyclonic eddies at the edge. Since we are on a cone, I could imagine that it’s just due to conservation of vorticity. Stuff that develops near the center and moves down the slope needs to spin cyclonically since the columns are being stretched, and on the other hand things that develop near the edge must move up the slope, thus columns being compressed. What do you think? What would be your explanation?

Topographic Rossby wave

Finally trying the topographic Rossby wave experiment I wrote about theoretically here!

And it is working — ok-ish. If you know what you are looking for, you can kind of see it. So check out the picture above so you know what you expect to see below ;-) We are rotating the tank fairly rapidly (and there are a lot of inertial oscillations in the water even after a long spinup, don’t know why) and then slow it down just a little bit to create a current relative to the topography.

So it turns out that following instructions better might actually have been a good idea. We will do that some other day on a different rotating table.

Here is what we did today:

Setup of the topographic Rossby wave experiment

For a demonstration of topographic Rossby waves, we want the Coriolis parameter f to stay constant but have the depth H change. We use the instructions by geosci.uchicago.edu as inspiration for our experiment and

  • build a shallow ridge into the tank. My solution: Take a 2.3 cm (outer) diameter hose, tape it to the bottom of a tank to achieve a ridge with smooth edges
  • important difference to the geosci.uchicago.edu setup: We are just using our cylindrical tank without a solid cylinder in the middle. Therefore our ridge goes all the way across the tank. Main reason is that our rotating tank’s camera sits on six rods, so at fast rotations it is very difficult to insert dye and I thought this way might be easier. But that might not actually be true…
  • 10 cm water depth
  • spin up the tank to approximately 26 rpm (23 seconds for 10 rotations == 36.5 on the display of GFI’s large rotating table)
  • wait for it to reach solid body rotation (ca 10 min)
  • introduce dye upstream of the ridge,
  • reduce rotation slightly, to approximately 23 rpm (26 seconds for 10 rotations == 33 on the display of GFI’s large rotating table) so the water inside the tank moves relative to the tank itself, and thus has to cross the ridge which is fixed to the tank
  • watch it change from laminar flow to eddies downstream of the ridge. Hopefully ;-)

Vorticity and Rossby waves

Usually when we talk about waves on this blog, we talk about surface- or sometimes internal waves, but my waves almost always oscillate vertically. Today, we’ll mix things up a little: Rossby waves are waves in the horizontal plane. They exist for example as oscillations on the atmosphere’s jet stream. In order to understand what causes them, we need the concept of vorticity, which I will go over first before giving examples for Rossby waves.

Vorticity

Vorticity is a measure of how much a fluid is rotating. Generally speaking, once a fluid is in rotation, it wants to keep rotating (as we saw for example with the bottom Ekman layers in a rotating tank, where the water inside kept on rotating after the tank was stopped, until it was slowed down by friction). There are several components that are at play here — the rotation that we see when looking at eddies, the rotation of the Earth, and others — which I will go over in the following.

Relative vorticity

The easiest way to imagine what “vorticity” is (and the only one that I’ve talked about on this blog, see here), is to think of a little float in a flow. In a vorticity-free flow, that little float will always keep its orientation (see below). However if there is shear in the flow, i.e. the flow field carries vorticity, it will start to turn.

vorticity1

Flow fields without vorticity (top) and with vorticity (bottom). 

Relative vorticity is what we see for example when looking al leaves swirling in rivers.

Planetary vorticity

Since the Earth is turning (and all the water on it with it), the water also carries planetary vorticity, i.e. the rotation of the Earth, which is the Coriolis parameter. The Coriolis parameter is largest at the poles and zero at the equator, meaning the rotation changes with latitude.

The rotation of the Earth is clearly important enough for us to want to spin our tanks to simulate its effects on ocean currents.

Absolute vorticity

The sum of relative and planetary vorticity is called absolute vorticity: This is how much any fluid column is rotating in total, including all possible components of rotation (which are only the two mentioned above, but still…).

Potential vorticity

One more factor that can influence the rotation of a fluid parcel is the water depth. When water depth increases, columns of water get expanded vertically (since, for continuity reasons, they still have to go all the way from surface to bottom, even if the distance is now larger) or, if water depth decreases, squished. Similarly to figure skaters that stretch or crouch to increase or decrease their rotation, the expansion of a column of water leads to a change in its rotation.

Potential vorticity is defined as absolute vorticity over water depth.

Conservation of potential vorticity leads to waves

Potential vorticity is conserved, so if water depth, planetary vorticity changes or relative vorticity changes, something else has to change to compensate. And if water changes how much it is rotating, this leads to meanders in currents, i.e. waves.

Depth is constant, but latitude changes: Planetary Rossby waves

Planetary vorticity changes with latitude, therefore if a water parcel moves in north-south direction over constant water depth, its relative vorticity needs to change in order for potential vorticity to be conserved. This leads to so-called planetary Rossby waves, where currents in the ocean or the atmosphere start oscillating in north-south direction (see figure below).

At position 1, a fluid parcel gets for any random reason pushed northward. As it moves north, its planetary vorticity increases and its relative vorticity therefore has to decrease to compensate (2). This leads to southward movement, but the initial latitude (3) is overshot a little (4). This again leads to a change in relative vorticity (4), which brings the water parcel back to its initial latitude (5), but it overshoots again… So this mechanism leads to a wave-like motion in the horizontal plane, with the phase of the wave propagating westward.

This can happen at any latitude, even at the equator where “equatorial planetary Rossby waves” occur. At the equator f=0, but as soon as the water column has moved slightly north or south from the equator, f kicks in and drives the water column back to the equator (where it then overshoots, is turned back, overshoots again…….).

Latitude is constant but depth changes: Topographic waves

If a current encountered a ridge, the water depth changes and the current thus gets deflected. This motion is called topographic wave: When a water column gets stretched, it gains relative vorticity, making it rotate cyclonically. When it runs into shallower water, it loses relative vorticity and starts turning the other way.

I’m hoping to set up demonstrations for both types of Rossby waves soon. Stay tuned! :-)

On vorticity

I’ve promised a long time ago to write a post on vorticity (Hallo Geli! :-)). So here it comes!

Vorticity is one of the concepts in oceanography that is often taught via its mathematical formulation, and which is therefore pretty difficult to grasp for those of us with less mathematical training. But it’s also a concept that you can have an intuitive grasp of, and I’ll try to show you how.

The easiest way to imagine what “vorticity” is, is to think of a little float in a flow. In a vorticity-free flow, that little float will always keep its orientation (see below). However if there is a shear in the flow, i.e. the flow field carries vorticity, it will start to turn.

vorticity1

Flow fields without vorticity (top) and with vorticity (bottom).

This even holds true for vortices: There are vorticity-free vortices as well as those that carry vorticity (as the name “vortex” would suggest).

vorticity2

Vorticity-laden and vorticity-free vortex. In the left plot, angular velocity of all particles is the same. In the right plot, angular velocity increases the closer you get to the center of the vortex.

If you think back to the discussion on a tank spinning up to reach solid body rotation, you might recognize that only the vortex with vorticity moves like a solid body. To me, a solid body is basically a fluid with so much friction in it, that molecules cannot change their position relative to each other. And that serves as my memory hook for one condition for the formation of vorticity – the flows must have viscous forces and friction in it.

This sounds very theoretical, but there are a lot of instances where you can spot vorticity in real life, for example twigs caught up twirling in eddies at the edge of streams are clearly moving in a vorticity-filled environment. Below, for example, the stream is clearly not vorticity-free.

Did this help a little? Or what else might help?

On drawing on the board by hand in real time

Drawing by hand on the board in real time rather than projecting a finished schematic?

It is funny. During my undergrad, LCD projectors were just starting to arrive at the university. Many of the classes I attended during my first years used overhead projectors and hand-written slides, or sometimes printed slides if someone wanted to show really fancy things like figures from a paper. Occasionally people would draw or write on the slides during class, and every room that I have ever been taught in during that time did have several blackboards that were used quite frequently.

These days, however, things are differently. At my mom’s school, many classrooms don’t even have blackboards (or whiteboards) any more, but instead they have a fancy screen that they can show things on and draw on (with a limited number of colors, I think 3?). Many rooms at universities are similarly not equipped with boards any more, and most lectures that I have either seen or heard people talk about over the last couple of years exclusively use LCD projectors that people hook up to their personal laptops.

On the one hand, that is a great development – it is so much easier to show all kinds of different graphics and also to find and display information on the internet in real time. On the other hand, though, it has become much more difficult to talk students through graphics slowly enough that they can draw with you as you are talking and at the same time understand what they are drawing.

Sketch of the mechanisms causing westward intensification of subtropical gyres – here the “before” stage where the symmetrical gyre would spin up since the wind is inputting more vorticity that is being taken out by other mechanisms.

The other day, I was teaching about westward intensification in subtropical gyres. For that, I wanted to use the schematics above and below, showing how vorticity input from the wind is balanced by change in  vorticity through change in latitude as well as through friction with the boundary. I had that schematic in my powerpoint presentation, even broken down into small pieces that would be added sequentially, but at last minute decided to draw it on the whiteboard instead.

Sketch of the mechanisms causing westward intensification of subtropical gyres – here the “after” stage – the vorticity input by wind is balanced by energy lost through friction with the western boundary in an asymmetrical gyre. Voila -your western boundary current!

And I am convinced that that was a good decision. Firstly, drawing helped me mention every detail of the schematic, since I was talking about what I was drawing while drawing it. When just clicking through slides it happens much more easily that things get forgotten or skipped. Secondly, since I had to draw and talk at the same time, the figure only appeared slowly enough on the board that the students could follow every step and copy the drawing at the same time. And lastly, the students saw that it is actually possible to draw the whole schematic from memory, and not just by having learned it by heart, but by telling the story and drawing what I was talking about.

Does that mean that I will draw every schematic I use in class? Certainly not. But what it does mean is that I found it helpful to remember how useful it is to draw occasionally, especially to demonstrate how I want students to be able to talk about content: By constructing a picture from scratch, slowly building and adding on to it, until the whole theory is completed.