Tidal mixing on a (fjord’s) sill
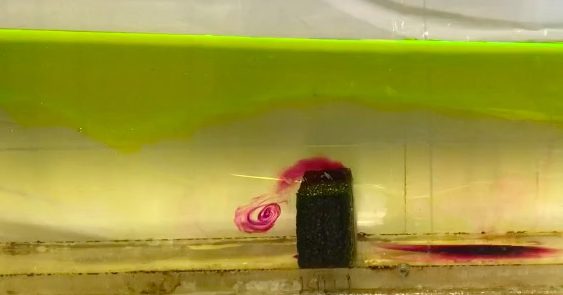
A pink swirl going across a styrofoam block underneath a layer of yellow water? What’s going on here?
The picture was taken in a water tank, simulating the circulation of water masses in a fjord. A fjord is a long and narrow bay, usually with a sill that is separating the bay from the open ocean. And those sills play an important role in on the one hand preventing water exchange between the fjord and the open ocean (because everything below sill depth has a really hard time getting across the sill) and on the other hand mixing water masses inside and outside of the fjord (which we see visualized with the pink dye).
And here is why the sill is so important: Every time the tide goes in or out of the fjord (so pretty much all the time), the sill acts as an obstacle to the water that wants to go in or out. And flow across a ridge tends to create mixing downstream of the ridge.
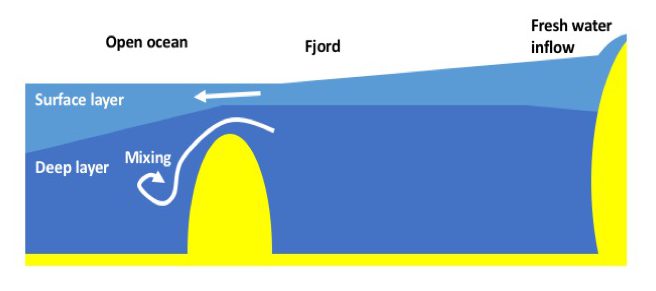
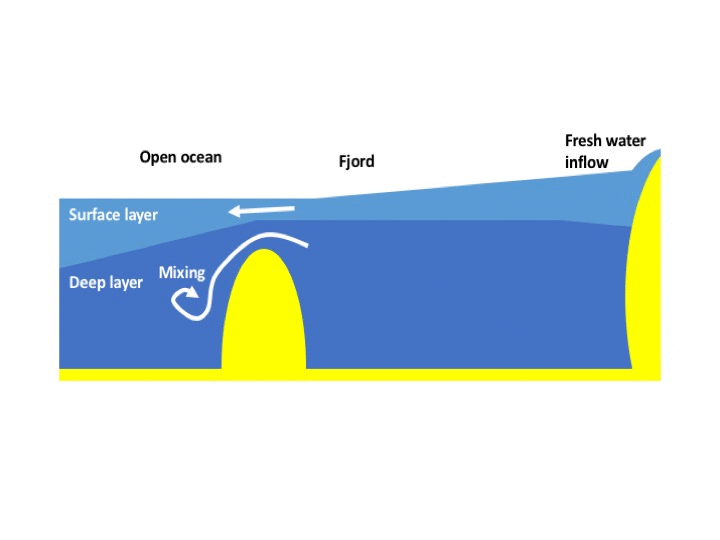
In the picture below, we see a sketch of the situation in an outgoing tide, which is what we also see represented in the photo above: Water wants to push out of the fjord and has to accelerate to get through the much smaller cross section where the sill is located. This leads to strong currents and strong mixing “downstream” of the obstacle.
Except that “downstream” is on the other side of the sill only a couple of hours later, when the tide is pushing water into the fjord, but is again hindered by the sill.
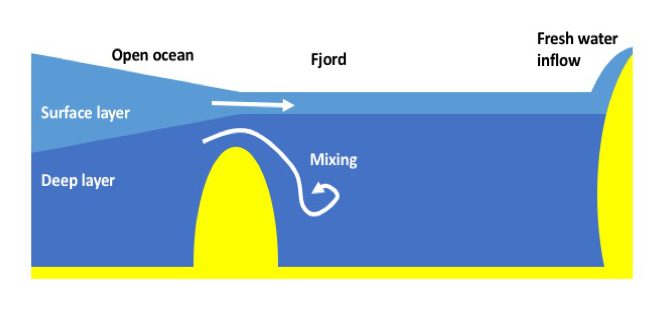
So what is happening is this: The tidal current goes in and out, and mixing occurs on one or the other side of the sill. So the situation looks like this:
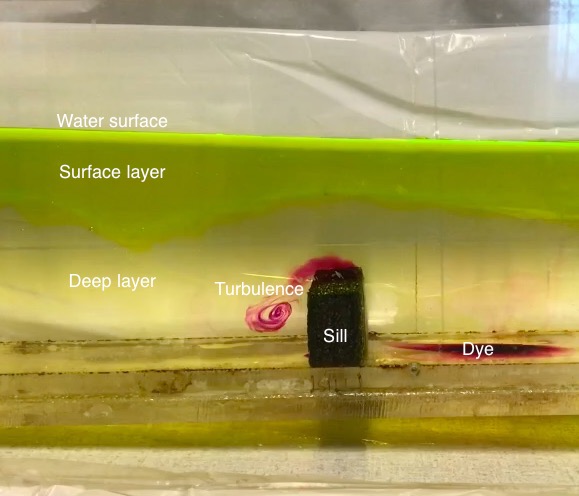
This is what that looks like in our tank (the “tidal waves” are generated by lifting the right end of the tank and then just slushing back and forth):
Of course, in reality we don’t see pink swirls, and the surface layer isn’t a different color from the deep layer, either. But that’s why tank experiments are so cool: They show us what’s going on deep below the waves, that we can otherwise only deduce from complicated measurements of temperatures, salinities or mixing rates, which require highly specialized equipment, a research ship, and lots of technical know how to process and analyse and display. Which, of course, is also being done, but this demonstration gives a quick and easy visual representation of the processes at play at sills all around the world.
P.S.: The photos in this blog post were taken when I ran the fjord circulation experiment with Steffi and Ailin at GFI earlier this year. I am posting about this again now because I wanted to use the picture for other purposes and realized that I never actually wrote about this feature in as much detail as it deserves!
Spin down — lots of shear instabilities in our tank! | Dr. Mirjam S. Glessmer says:
[…] When you stop a rotating tank, lots of stuff happens and it is usually very impressive to watch. Sometimes we stop tanks on purpose to show for example the development of Ekman layers, but sometimes we are just done with an experiment and then get to see cool stuff to see just as part of cleaning up. […]