Tag Archives: teaching

#TeachingTuesday: Student feedback and how to interpret it in order to improve teaching

Student feedback has become a fixture in higher education. But even though it is important to hear student voices when evaluating teaching and thinking of ways to improve it, students aren’t perfect judges of what type of teaching leads to the most learning, so their feedback should not be taken onboard without critical reflection. In fact, there are many studies that investigate specific biases that show up in student evaluations of teaching. So in order to use student feedback to improve teaching (both on the individual level when we consider changing aspects of our classes based on student feedback, as well as at an institutional level when evaluating teachers for personnel decisions), we need to be aware of the biases that student evaluations of teaching come with.

While student satisfaction may contribute to teaching effectiveness, it is not itself teaching effectiveness. Students may be satisfied or dissatisfied with courses for reasons unrelated to learning outcomes – and not in the instructor’s control (e.g., the instructor’s gender).
Boring et al. (2016)

What student evaluations of teaching tell us

In the following, I am not presenting a coherent theory (and if you know of one please point me to it!), these are snippets of current literature on student evaluations of teaching, many of which I found referenced in this annotated literature review on student evaluations of teaching by Eva (2018). The aim of my blogpost is not to provide a comprehensive literature review, rather than pointing out that there is a huge body of literature that teachers and higher ed administrators should know exists somewhere out there, that they can draw upon when in doubt (and ideally even when not in doubt ;-)).

6 second videos are enough to predict teacher evaluations

This is quite scary, so I thought it made sense to start out with this study. Ambady and Rosenthal (1993) found that silent videos shorter than 30 seconds, in some case as short as 6 seconds, significantly predicted global end-of-semester student evaluations of teachers. These are videos that do not even include a sound track. Let this sink in…

Student responses to questions of “effectiveness” do not measure teaching effectiveness

And let’s get this out of the way right away: When students are asked to judge teaching effectiveness, that answer does not measure actual teaching effectiveness.

Stark and Freishtat (2014) give “an evaluation of course evaluations”. They conclude that student evaluations of teaching, though providing valuable information about students’ experiences, do not measure teaching effictiveness. Instead, ratings are even negatively associated with direct measures of teaching effectiveness and are influenced by gender, ethnicity and attractiveness of the instructor.

Uttl et al. (2017) conducted a meta-analysis of faculty’s teaching effectiveness and found that “student evaluation of teaching ratings and student learning are not related”. They state that “institutions focused on student learning and career success may want to abandon [student evaluation of teaching] ratings as a measure of faculty’s teaching effectiveness”.

Students have their own ideas of what constitutes good teaching

Nasser-Abu Alhija (2017) showed that out of five dimensions of teaching (goals to be achieved, long-term student development, teaching methods and characteristics, relationships with students, and assessment), students viewed the assessment dimension as most important and the long-term student development dimension as least important. To students, the grades that instructors assigned and the methods they used to do this were the main aspects in judging good teaching and good instructors. Which is fair enough — after all, good grades help students in the short term — but that’s also not what we usually think of when we think of “good teaching”.

Students learn less from teachers they rate highly

Kornell and Hausman (2016) review recent studies and report that when learning is measured at the end of the respective course, the “best” teachers got the highest ratings, i.e. the ones where the students felt that they had learned the most (which is congruent with Nasser-Abu Alhija (2017)’s findings of what students value in teaching). But when learning was measured during later courses, i.e. when meaningful deep learning was considered, other teachers seem to have more effective. Introducing desirable difficulties is thus good for learning, but bad for student ratings.

Appearances can be deceiving

Carpenter et al. (2013) compared a fluent video (instructor standing upright, maintaining eye contact, speaking fluidly without notes) and a disfluent video (instructor slumping, looking away, speaking haltingly with notes). They found that even though the amount of learning that took place when students watched either of the videos wasn’t influenced by the lecturer’s fluency or lack thereof, the disfluent lecturer was rated lower than the fluent lecturer.

The authors note that “Although fluency did not significantly affect test performance in the present study, it is possible that fluent presentations usually accompany high-quality content. Furthermore, disfluent presentations might indirectly impair learning by encouraging mind wandering, reduced class attendance, and a decrease in the perceived importance of the topic.”

Student expect more support from their female professors

When students rate teachers effectiveness, they do that based on their assumption of how effective a teacher should be, and it turns out that they have different expectations depending on the gender of their teachers. El-Alayi et al. (2018) found that “female professors experience more work demands and special favour requests, particularly from academically entitled students”. This was both true when male and female faculty reported on their experiences, as well as when students were asked what their expectations of fictional male and female teachers were. 

Student teaching evaluations punish female teachers

Boring (2017) found that even when learning outcomes were the same for students in courses taught by male and female teachers, female teachers received worse ratings than male teachers. This got even worse when teachers didn’t act in accordance to the stereotypes associated with their gender.

MacNell et al. (2015) found that believing that an instructor was female (in a study of online teaching where male and female names were sometimes assigned according to the actual gender of the teacher and sometimes not) was sufficient to rate that person lower than an instructor that was believed (correctly or not) to be male.

White male students challenge women of color’s authority, teaching competency, and scholarly expertise, as well as offering subtle and not so subtle threats to their persons and their careers

This title was drawn from the abstract of Pittman (2010)’s article that I unfortunately didn’t have access to, but thought an important enough point to include anyway.

There are very many more studies on race, and especially women of color, in teaching contexts, which all show that they are facing a really unfair uphill battle.

Students will punish a percieved accent

Rubin and Smith (1990) investigated “effects of accent, ethnicity, and lecture topic on undergraduates’ perceptions of nonnative English-speaking teaching assistants” in North America and found that 40% of undergraduates avoid classes instructed by nonnative English-speaking teaching assistants, even though the actual accentedness of teaching assistants did not actually influence student learning outcomes. Nevertheless, students judged teaching assistants they perceived as speaking with a strong accent as poorer teachers.

Similarly, Sanchez and Khan (2016) found that “presence of an instructor accent […] does not impact learning, but does cause learners to rate the instructor as less effective”.

Student will rate minorities differently

Ewing et al. (2003) report that lecturers that were identified as gay or lesbian received lower teaching ratings than other lecturers with undisclosed sexual orientation when they, according to other measures, were perfoming very well. Poor teaching performance was, however, rated more positively, possibly to avoid discriminating against openly gay or lesbian lecturers.

Students will punish age

Stonebraker and Stone (2015) find that “age does affect teaching effectiveness, at least as perceived by students. Age has a negative impact on student ratings of faculty members that is robust across genders, groups of academic disciplines and types of institutions”. Apparently, when it comes to students, from your mid-40ies on, you aren’t an effective teacher any more (unless you are still “hot” and “easy”).

Student evaluations are sensitive to student’s gender and grade expectation

Boring et al. (2016) find that “[student evaluation of teaching] are more sensitive to students’ gender bias and grade expectations than they are to teaching effectiveness.

What can we learn from student evaluations then?

Pay attention to student comments but understand their limitations. Students typically are not well situated to evaluate pedagogy.
Stark and Freishtat (2014)

Does all of the above mean that student evaluations are biased in so many ways that we can’t actually learn anything from them? I do think that there are things that should not be done on the basis of student evaluations (e.g. rank teacher performance), and I do think that most times, student evaluations of teaching should be taken with a pinch of salt. But there are still ways in which the information gathered is useful.

Even though student satisfaction is not the same as teaching effectiveness, it might still be desirable to know how satisfied students are with specific aspects of a course. And especially open formats like for example the “continue, start, stop” method are great for gaining a new perspective on the classes we teach and potentially gaining fresh ideas of how to change things up.

Also tracking ones own evaluation over time is helpful since — apart from aging — other changes are hopefully intentional and can thus tell us something about our own development, at least assuming that different student cohorts evaluate teaching performance in a similar way. Also getting student feedback at a later date might be helpful, sometimes students only realize later which teachers they learnt from the most or what methods were actually helpful rather than just annoying.

A measure that doesn’t come directly from student evaluations of teaching but that I find very important to track is student success in later courses. Especially when that isn’t measured in a single grade, but when instructors come together and discuss how students are doing in tasks that build on previous courses. Having a well-designed curriculum and a very good idea of what ideas translate from one class to the next is obviously very important.

It is also important to keep in mind that, as Stark and Freishtat (2014) point out, statistical methods are only valid if there are enough responses to actually do statistics on them. So don’t take very few horrible comments to heart and ignore the whole bunch of people who are gushing about how awesome your teaching is!

P.S.: If you are an administrator or on an evaluation committee and would like to use student evaluations of teaching, the article by Linse (2017) might be helpful. They give specific advice on how to use student evaluations both in decision making as well as when talking to the teachers whose evaluations ended up on your desk.

Literature:

Ambady, N., & Rosenthal, R. (1993). Half a minute: Predicting teacher evaluations from thin slices of nonverbal behavior and physical attractiveness. Journal of Personality and Social Psychology, 64(3), 431–441. https://doi.org/10.1037/0022-3514.64.3.431

Boring, A. (2017). Gender biases in student evaluations of teachers. Journal of Public Economics, 145(13), 27–41. https://doi.org/10.1016/j.jpubeco.2016.11.006

Boring, A., Dial, U. M. R., Ottoboni, K., & Stark, P. B. (2016). Student evaluations of teaching (mostly) do not measure teaching effectiveness. ScienceOpen Research, (January), 1–36. https://doi.org/10.14293/S2199-1006.1.SOR-EDU.AETBZC.v1

Carpenter, S. K., Wilford, M. M., Kornell, N., & Mullaney, K. M. (2013). Appearances can be deceiving: Instructor fluency increases perceptions of learning without increasing actual learning. Psychonomic Bulletin & Review, 20(6), 1350–1356. https://doi.org/10.3758/s13423-013-0442-z

El-Alayi, A., Hansen-Brown, A. A., & Ceynar, M. (2018). Dancing backward in high heels: Female professors experience more work demands and special favour requests, particularly from academically entitled students. Sex Roles. https://doi.org/10.1007/s11199-017-0872-6

Eva, N. (2018), Annotated literature review: student evaluations of teaching (SET), https://hdl.handle.net/10133/5089

Ewing, V. L., Stukas, A. A. J., & Sheehan, E. P. (2003). Student prejudice against gay male and lesbian lecturers. Journal of Social Psychology, 143(5), 569–579. http://web.csulb.edu/~djorgens/ewing.pdf

Kornell, N. & Hausman, H. (2016). Do the Best Teachers Get the Best Ratings? Front. Psychol. 7:570. https://doi.org/10.3389/fpsyg.2016.00570

Linse, A. R. (2017). Interpreting and using student ratings data: Guidance for faculty serving as administrators and on evaluation committees. Studies in Educational Evaluation, 54, 94- 106. https://doi.org/10.1016/j.stueduc.2016.12.004

MacNell, L., Driscoll, A., & Hunt, A. N. (2015). What’s in a name: Exposing gender bias in student ratings of teaching. Innovative Higher Education, 40(4), 291– 303. https://doi.org/10.1007/s10755-014-9313-4

Nasser-Abu Alhija, F. (2017). Teaching in higher education: Good teaching through students’ lens. Studies in Educational Evaluation, 54, 4-12. https://doi.org/10.1016/j.stueduc.2016.10.006

Pittman, C. T. (2010). Race and Gender Oppression in the Classroom: The Experiences of Women Faculty of Color with White Male Students. Teaching Sociology, 38(3), 183–196. https://doi.org/10.1177/0092055X10370120

Rubin, D. L., & Smith, K. A. (1990). Effects of accent, ethnicity, and lecture topic on undergraduates’ perceptions of nonnative English-speaking teaching assistants. International Journal of Intercultural Relations, 14, 337–353. https://doi.org/10.1016/0147-1767(90)90019-S

Sanchez, C. A., & Khan, S. (2016). Instructor accents in online education and their effect on learning and attitudes. Journal of Computer Assisted Learning, 32, 494–502. https://doi.org/10.1111/jcal.12149

Stark, P. B., & Freishtat, R. (2014). An Evaluation of Course Evaluations. ScienceOpen, 1–26. https://doi.org/10.14293/S2199-1006.1.SOR-EDU.AOFRQA.v1

Stonebraker, R. J., & Stone, G. S. (2015). Too old to teach? The effect of age on college and university professors. Research in Higher Education, 56(8), 793–812. https://doi.org/10.1007/s11162-015-9374-y

Uttl, B., White, C. A., & Gonzalez, D. W. (2017). Meta-analysis of faculty’s teaching effectiveness: Student evaluation of teaching ratings and student learning are not related. Studies in Educational Evaluation, 54, 22-42. http://dx.doi.org/10.1016/j.stueduc.2016.08.007

#TeachingTuesday: Some things I read about making good lecture videos

Just imagine you had written an article on “Student Satisfaction and Learning Outcomes in Asynchronous Online Lecture Videos”, like Choe et al. (2019) did. What excellent timing to inform teaching decisions all around the world!

Choe et al. compare 8 different video styles (all of which can be watched as supplementary material to the article which is really helpful!), 6 to replace “normal lectures” and two that complement them, to investigate the influence of video style on both how much students are learning from each, and how they feel watching them.

The “normal lecure” videos were different combinations of the lecturer and information on slides/blackboards/tablets/…: a “classic classroom” where the lecturer is filmed in front of a blackboard and a screen, a “weatherman” style in front of a green screen on which the lecture slides are later imposed, a “learning glass” where the lecturer is seen writing on a board, a “pen tablet” where the lecturer can draw on the slides, a “talking head” where the lecturer is superimposed on the slides in a little window, and “slides on/off” where the video switches between showing slides or the lecturer.

And the good news: Turns out that the style you choose for your recorded video lecture doesn’t really affect student learning outcomes very much. Choe et al. did, however, deduce strengths and weaknesses of each of the lecture formats, and from that come up with a list of best practices for student engagement, which I find very helpful. Therein, they give tips for different stages of the video production, related to the roles (lecturer and director of the video), and content covered in the videos, and these are really down-to-earth, practical tips like “cooler temperatures improve speaker comfort”.  And of course all the things like “not too much text on slides” and “readable font” are mentioned, too; always a good reminder!

One thing they point out that I wasn’t so clear to me before is that it’s important that the lecturer is visible and that they maintain eye contact with the camera. Of course that adds a layer of difficulty to recording lectures — and a lot of awkward feelings and extra work in terms of what to wear and actually having to shower and stuff — but in the big scheme of things if it creates a better user experience, maybe it’s not such a big sacrifice. Going forward, I’ll definitely keep that in mind!

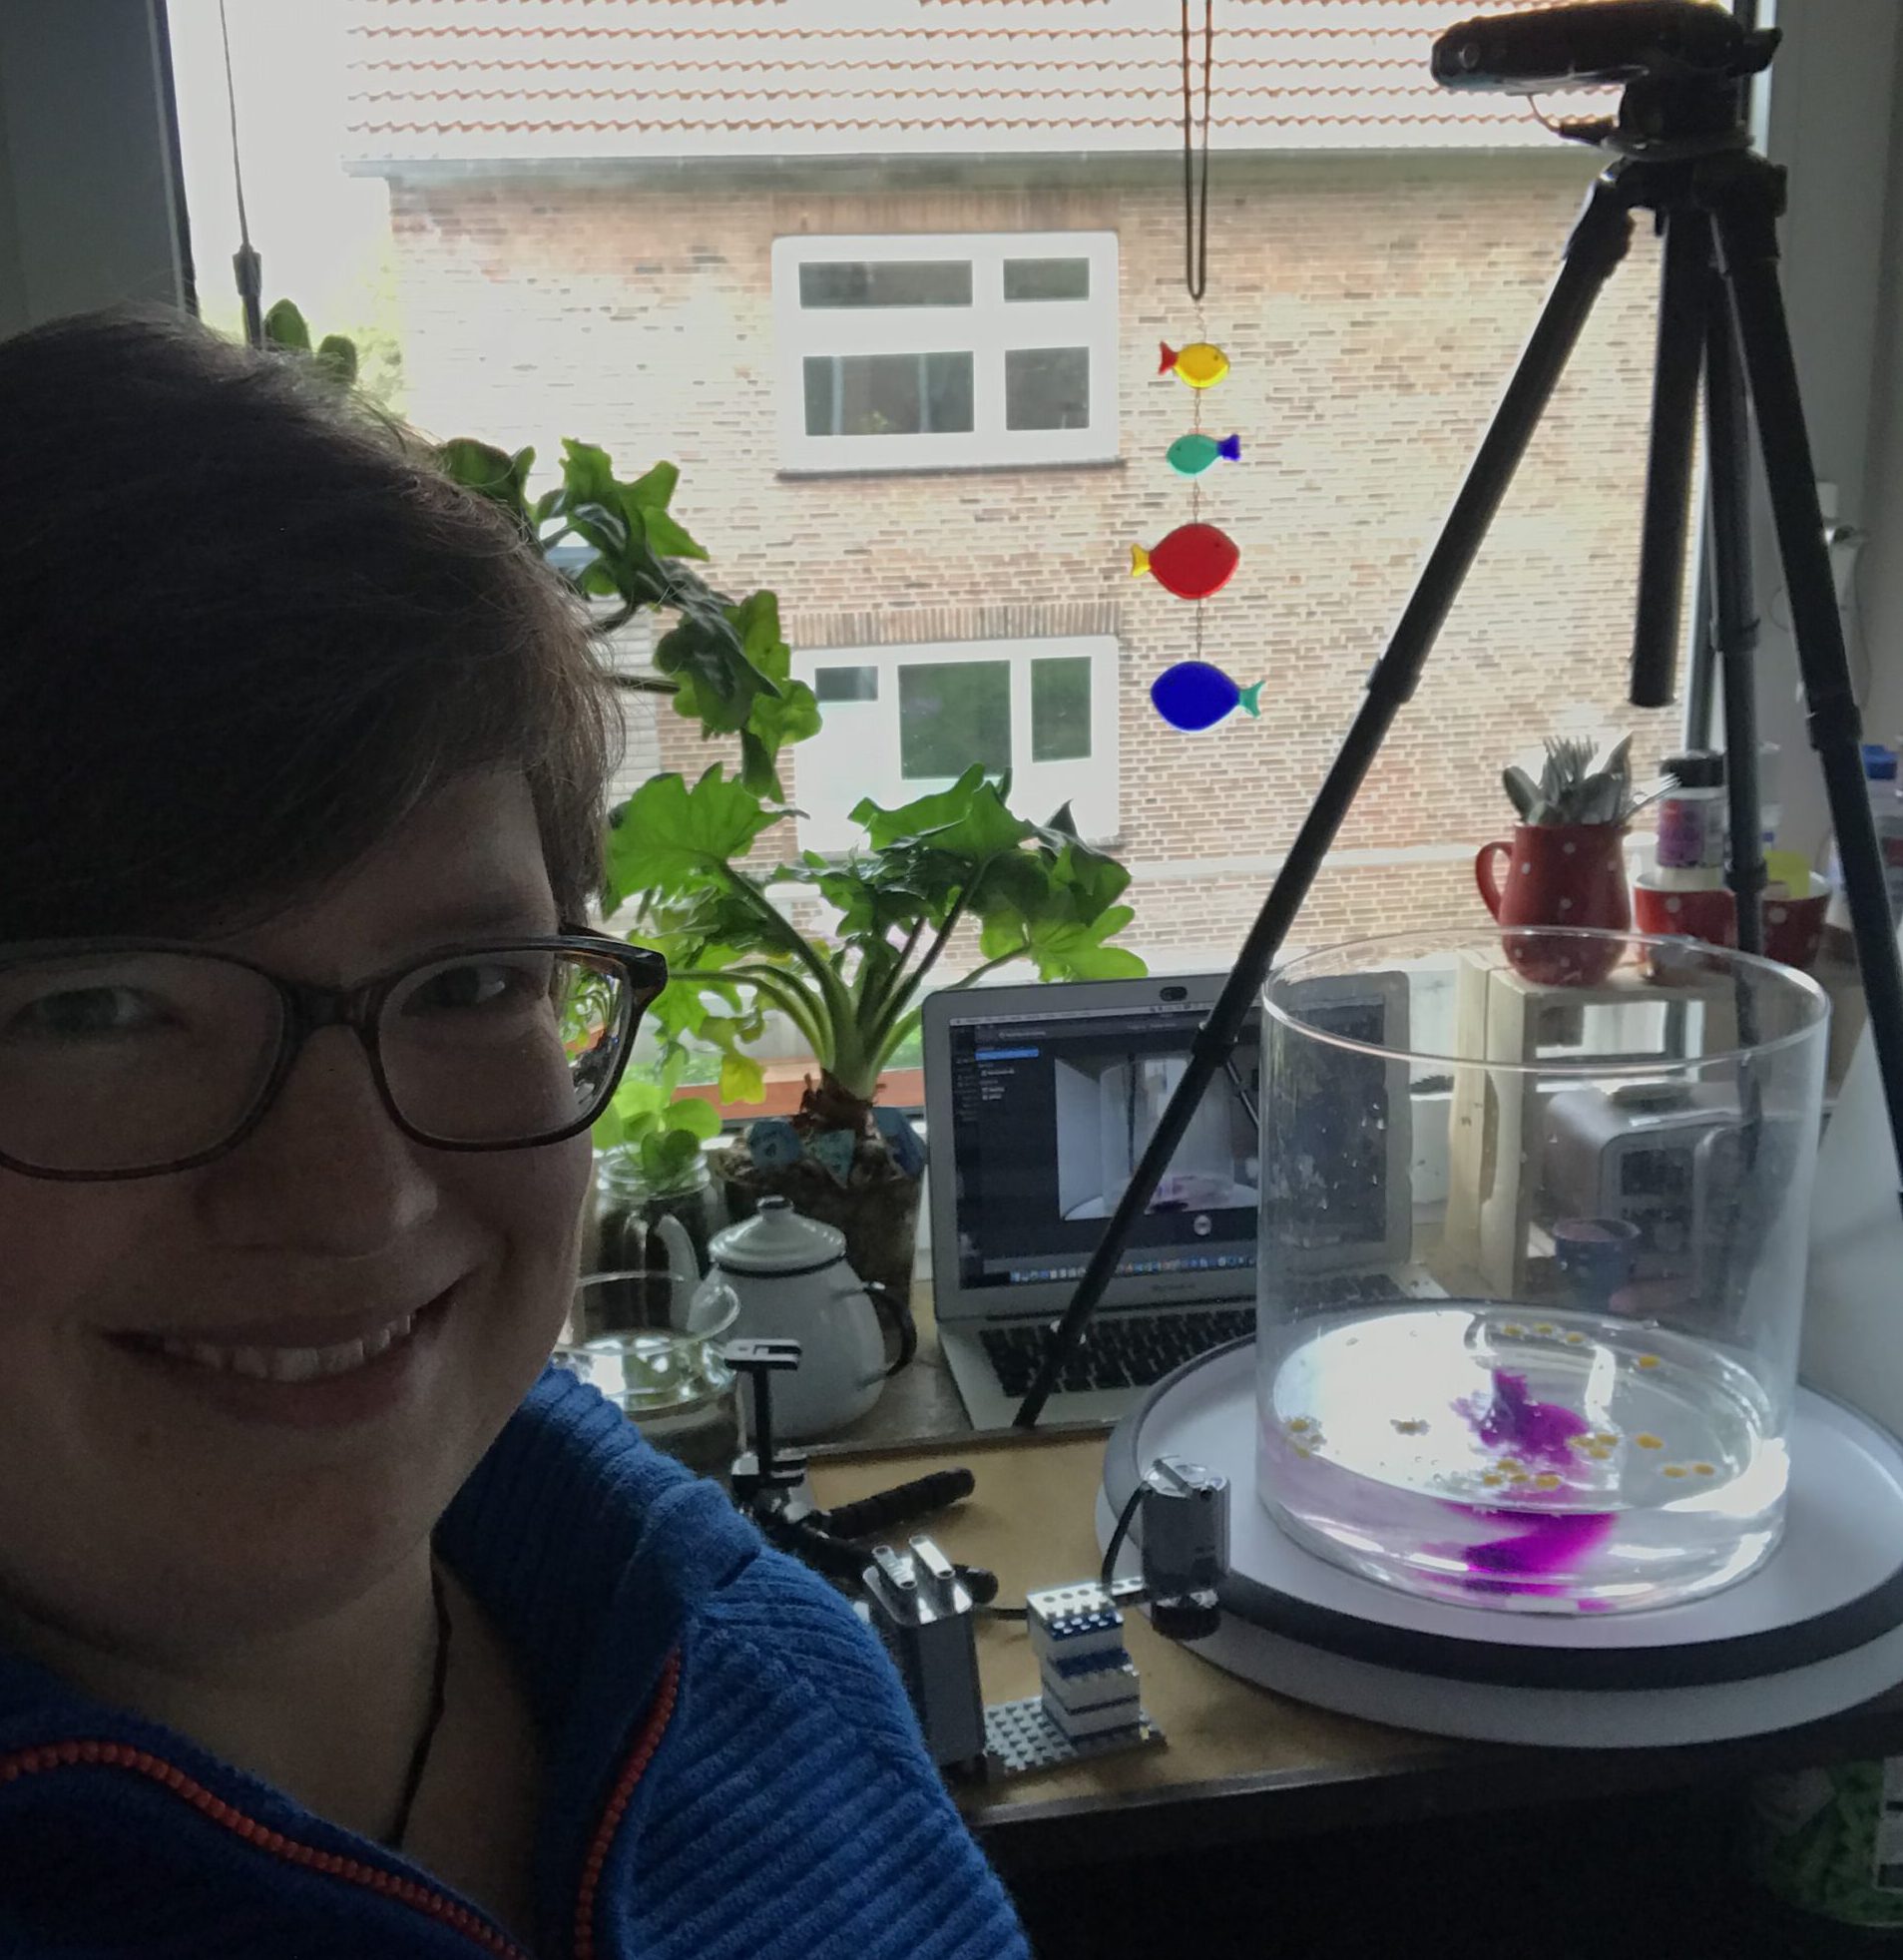
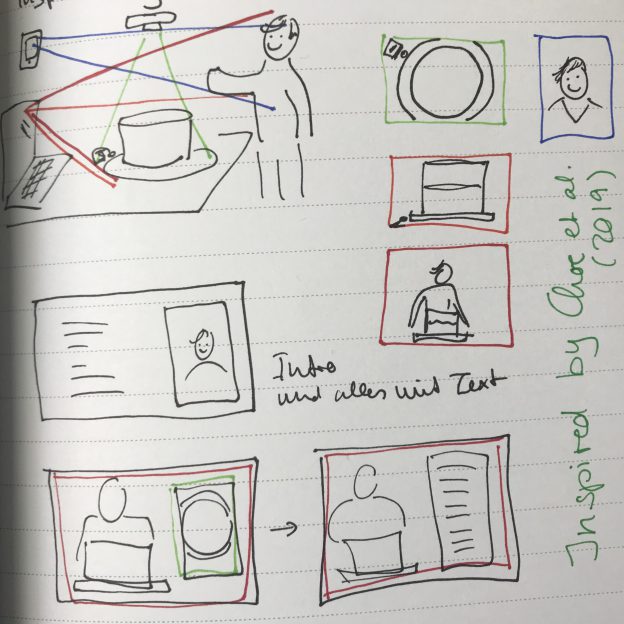
Especially making the distinction between the roles of “lecturer” and “director” was a really helpful way for me to think about making videos, even though I am playing both roles myself. But it reminds me of how many considerations (should) go into a video besides “just” giving the lecture! If you look at the picture above, you’ll see that I’ve started sketching out what I want to be able to show on a future video, and what that means for how many cameras I need, where to place them, and how to orient them (portrait or landscape). When I made the (german) instructions for kitchen oceanography, I filmed myself in portrait mode, thinking of posting them to my Instagram stories, but then ended up editing a landscape video for which I then needed to fill all the awkward space around the portrait movie. Would have been helpful to think about it in these terms before!

Choe et al. even include a “best practice” video in their supplementary material, which I find super helpful. Because even though in some cases it might be feasible to professionally produce lectures in a studio, but that’s not what I (or most people frantically producing video lectures) these days have access to. So seeing something that is professionally produced but that doesn’t (seem) to require incredibly complicated technology or fancy editing is reassuring. In fact, even though the lecturer appears to have been filmed in front of a green screen, I think in the end it’s not too unsimilar to what I did in the (german) instructions for kitchen oceanography mentioned above: A lecturer on one side, the slides (in a portrait format) on the other.

In addition to the six “lecture” videos, there was a “demo” video where the lecturer showed a simple demonstration, and an “interview” video, where the lecturer was answering questions that were shown on a screen (so no second person there). Those obviously can’t replace a traditional lecture, but can be very useful for specific learning outcomes!

The “demo” type video is the one I am currently most interested in, since that’s where I can best contribute my expertise in a niche where other people appreciate getting some input. Also, according to Choe at al., students found that type of video engaging, entertaining, and of high learning value. All the more reason for me to do a couple more demo videos over the next couple of days, I’m already on it!

References:

Ronny C. Choe, Zorica Scuric, Ethan Eshkol, Sean Cruser, Ava Arndt, Robert Cox, Shannon P. Toma, Casey Shapiro, Marc Levis-Fitzgerald, Greg Barnes, and H. Crosbie (2019). “Student Satisfaction and Learning Outcomes in Asynchronous Online Lecture Videos”, CBE—Life Sciences Education, Vol. 18, No. 4. Published Online: 1 Nov 2019
https://doi.org/10.1187/cbe.18-08-0171

“Excursion week” in Oceanography 101 while physically distancing

My friend’s university recently decided that “excursion week” (a week in May during which there are no lectures or exercises or anything happening at university to make time for field courses during the semester) is cancelled this year. Which is, of course, not surprising given the current situation, but it isn’t cancelled as in “go have a week of vacation”, it’s cancelled as in “one more week of lectures”. Which is putting even more of a burden on people who are already struggling to provide students with the best teaching they can in a new, online setting. To help my friend out (as well as anybody else who might be teaching intro to oceanography classes right now), I’ve collected a couple of ideas of how to fill this week in a way that’s keeping at least a bit of the spirit of exploration alive.

Learning about concepts, observations, experimentation

Of course I can’t give you a solution that perfectly replaces a field course by something that isn’t a fieldcourse. But that doesn’t mean that many of the learning outcomes usually associated with field courses can’t be had in non-fieldcourse settings.

What are the learning outcomes that you care about most? Understanding of specific concepts? Then maybe those concepts, even though most impressively seen at the location where you typically go for your field course, can be observed in other places, too, if students are guided to find them. Or learning to observe following a specific protocol? Then maybe this protocol can be followed (or mostly followed) while collecting a different type of data than it is usually used on. Here are a couple of suggestions of ways to do this:

A: Field course at home

There are two different scenarios that I think can work well here: Having students explore the world right outside their home with a focus on topics from their course, or having them explore the enormous amount of available datasets on the internet.

A.1: Exploring the neighbourhood

Assuming students are able to walk around outside their homes (as they currently are where I’m at), having them explore the neighbourhood. There are different kinds of tasks that could work depending on your learning outcomes:

A.1.1: Find examples of specific science concepts

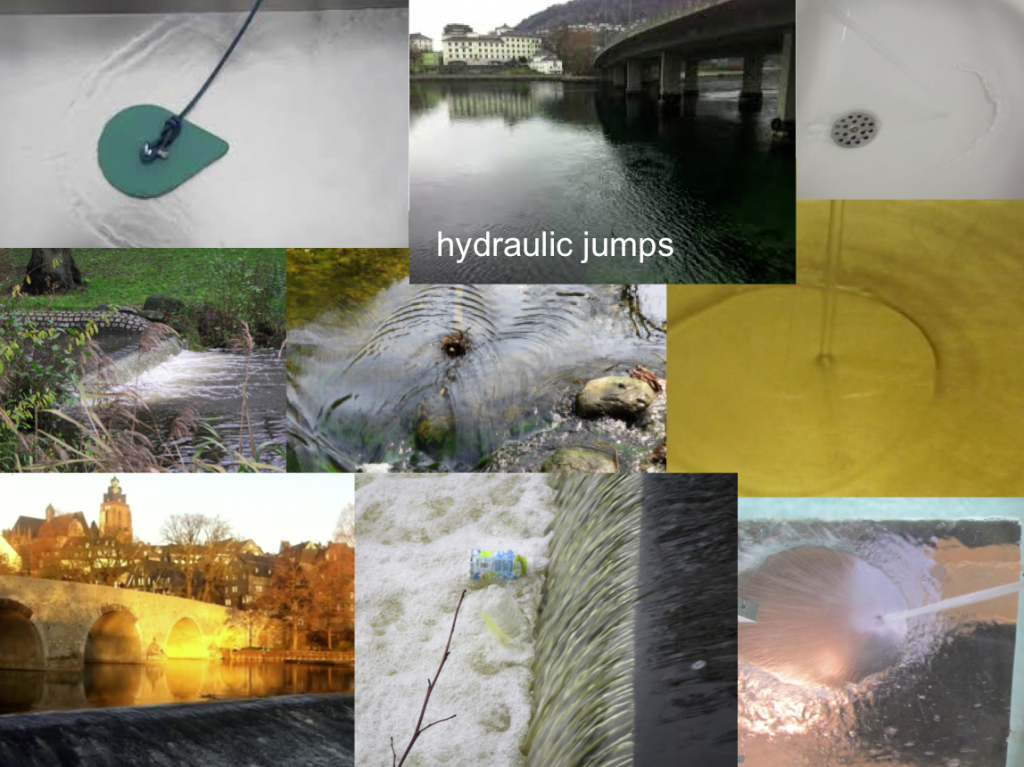
The tasks can be very specific (“find examples of hydraulic jumps“, “observe tidal flows in a river by watching moored structures move“) or not so specific (“pick a topic related to our class and find a way to observe it”). I think this is a really nice task because it helps students discover how prevalent the concepts are in their daily lives, rather than being something that only exists in books and lectures and really far-away locations that field courses would go to. Careful, as you see with my wave watching, this can get addictive!

A.1.2: Explain something you know for sure they will be able to observe

If you know where your students currently are, you can also ask them to observe specific features and explain them (“Make a time series of positions of that moored structure in the tidal river and relate the positions to the tidal cycle“, or for tons of ideas in Bergen see #BergenWaveWatching on Elin’s blog). This is also a really nice task, again because it brings concepts from the lecture into students’ real lives. It’s also maybe a little easier to relate to the rest of your course since you have a better idea of what they will be observing and interpreting.

A.2: Exploring the interwebs

This is just a quick side note, but of course there are TONS of data available on the internet. From observations of salinity, temperature, pressure mounted on seals in Antarctica, to winds and waves observed from satellites. Many of them even come with interfaces ready to do easy plots. And I’ve been a big fan of the lovely people on Twitter (shoutout to @aida_alvera and @remi_wnd particularly, I always love your posts!) that post interesting features from recent satellite images. So much to discover! Trying that for myself has been on my to do list for quite a while. You’d think I would find time for it during Corona isolation, wouldn’t you?

A.3: Ask others for observations that students can work with

Kinda like what I do with #friendlywaves where people send me pictures of waves and I try to explain the physics I see (while dreaming that it’s me on that ship in Lofoten…). This would be so much fun if students took pictures of interesting features they saw (or went through their old pics) and then shared them and asked each other for ideas what might have happened there. Or if you asked people to take pictures for you, or accessed webcams (like this one, looking at Saltstraumen, the strongest tidal current!), took screenshots and analysed those. I’d totally be in!

[Edit 13.5.2020: Here is a cool example of a virtual field course that was done at UNIS, using videos of field sites and discussing them in groups]

B: Kitchen Oceanography

Of course, #KitchenOceanography is my solution to everything. Need to make a class more interesting? Bring some #KitchenOceanography to the classroom! Can’t teach in-person classes but want people to still have hands-on experiences? Let them do #KitchenOceanography at home! Feel down in isolation and need something to cheer you up? Do some #KitchenOceanography!

So here are a couple of ways to have students do #KitchenOceanography while physically distancing.

B.1: Following my 24 days of #KitchenOceanography

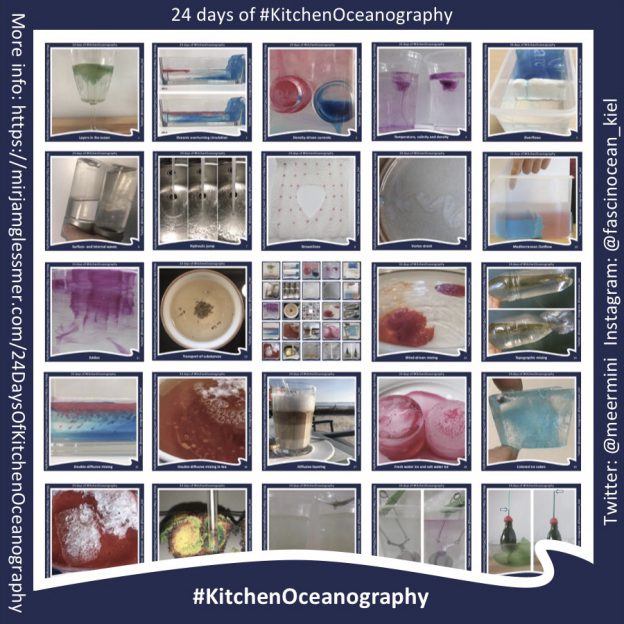
If you haven’t seen my 24 days of #KitchenOceanography yet, you might want to check it out. If you want to give your students a recipe for kitchen oceanography, there is probably something in there that works with your Oceanography 101 class! You could ask them to do one experiment that you find most relevant to your class, or pick one they find most interesting, or distribute all 24 experiments over all the students and have them report back.

And even though I’m so depriciatingly talking about “recipes” and structured activities, be assured that for most students things won’t end after they’ve done the experiment. There is ALWAYS something they observe that they still want to figure out, so there will be more experimentation going on than you expect!

B.2: Problem solving

This is a little more difficult to do if you and your students only communicate electronically and you can’t give them physical samples to investigate (but if you can place samples somewhere where students can easily and safely pick them up, you could for example give them salt water samples and ask them to figure out the sample’s salinity, or give them a fresh water and a salt water sample and ask them to figure out which one is which only using ice cubes). But there are still tons of ways problem solving can be practiced, for example by asking students to figure out ways to measure temperature, salinity and density.

B.3: Open-ended investigation

This is the most fun way to do kitchen oceanography, but depending on whether students have ever done these kinds of experiments before or not, it might be worth starting with a more guided kitchen oceanography experiment. But ultimately, this is where you ask students to figure things out in their kitchens. Currently on the list of things I want to try when I get the time (again, how is Corona isolation not the time for this kind of stuff? But somehow it isn’t): Can I actually see a change in the refraction of a spoon in a glass of very cold salt water as compared to warm fresh water? How big is that density effect? Would I be able to see the spoon bend where it goes through a density stratification in my glass? I bet you, once I start playing with this, that’s that for that evening!

C: Bonus idea: Ocean podcasts & books

There are two oceanography-themed podcasts that I really enjoy listening to (and I’m not a podcast person!): Climate Scientists and Treibholz. Both would be great to listen to interviews with super cool scientists while dreaming yourself away to expeditions to the Arctic or Antarctica. There is so much to learn from other people’s experiences in the field — why not ask students to listen to other people’s experiences with a focus on either the science, or the methods, or anything else?

And of course there are tons of books that would lend themselves to that, too, for example xplorer’s diaries. Nansen’s “Farthest North” (1897) for example fits super well if you wanted to talk about the discovery of dead water

Bringing it all together

The big question is: Once your students have done the tasks of finding/producing and describing phenomena, what do they do with that? It might not come as a surprise, but I think that they should be encouraged to publicly share them on the internet. Both because it’s a good opportunity for them to build their scicomm profile, but also because there are surpisingly many people who get really excited about (read here how Prof. Tessa M Hill‘s student Robert Dellinger posted a video of an overturning circulation on his 70-ish follower Twitter account, and the video has, as of  April 16th, 70 retweets and 309 likes!) and that’s such a motivating feedback for them!

Of course, the sharing and excited reactions could also happen within your university’s learning management system, but honestly … no. Ask them to share it via social media! I, for one, am definitely more than happy to comment and ask questions and share my excitement there! :-)

Supporting conceptual understanding of the Coriolis force through laboratory experiments

My friend Pierré and I started working on this article when both of us were still working at the Geophysical Institute in Bergen. It took forever to get published, mainly because both of us had moved on to different jobs with other foci, so maybe it’s not a big deal that it took me over a year to blog it? Anyway, I still think it is very important to introduce any kind of rotating experiments by first making sure people don’t harbour misconceptions about the Coriolis effect, and this is the best way we came up with to do so. But I am happy to hear any suggestions you might have on how to improve it :-)

Supporting Conceptual Understanding of the Coriolis Force Through Laboratory Experiments

By Dr. Mirjam S. Glessmer and Pierré D. de Wet

Published in Current: The Journal of Marine Education, Volume 31, No 2, Winter 2018

Do intriguing phenomena sometimes capture your attention to the extent that you haveto figure out why they work differently than you expected? What if you could get your students hooked on your topic in a similar way?

Wanting to comprehend a central phenomenon is how learning works best, whether you are a student in a laboratory course or a researcher going through the scientific process. However, this is not how introductory classes are commonly taught. At university, explanations are often presented or developed quickly with a focus on mathematical derivations and manipulations of equations. Room is seldom given to move from isolated knowledge to understanding where this knowledge fits in the bigger picture formed of prior knowledge and experiences. Therefore, after attending lectures and even laboratories, students are frequently able to give standard explanations and manipulate equations to solve problems, but lack conceptual understanding (Kirschner & Meester, 1988): Students might be able to answer questions on the laws of reflection, yet not understand how a mirror works, i.e. why it swaps left-right but not upside-down (Bertamini et al., 2003).

Laboratory courses are well suited to address and mitigate this disconnect between theoretical knowledge and practical application. However, to meet this goal, they need to be designed to focus specifically on conceptual understanding rather than other, equally important, learning outcomes, like scientific observation as a skill or arguing from evidence (NGSS, 2013), calculations of error propagations, application of specific techniques, or verifying existing knowledge, i.e. illustrating the lecture (Kirschner & Meester, 1988).

Based on experience and empirical evidence, students have difficulties with the concept of frames of reference, and especially with fictitious forces that are the result of using a different frame of reference. We here present how a standard experiment on the Coriolis force can support conceptual understanding, and discuss the function of employing individual design elements to maximize conceptual understanding.

HOW STUDENTS LEARN FROM LABORATORY EXPERIMENTS

In introductory-level college courses in most STEM disciplines, especially in physics-based ones like oceanography or meteorology and all marine sciences, laboratory courses featuring demonstrations and hands-on experiments are traditionally part of the curriculum.

Laboratory courses can serve many different and valuable learning outcomes: learning about the scientific process or understanding the nature of science, practicing experimental skills like observation, communicating about scientific content and arguing from evidence, and changing attitudes (e.g. Feisel & Rosa, 2005; NGSS, 2013; Kirschner & Meester, 1988; White, 1996). One learning outcome is often desired, yet for many years it is known that it is seldomly achieved: increasing conceptual understanding (Kirschner & Meester, 1988, Milner-Bolotin et al., 2007). Under general dispute is whether students actually learn from watching demonstrations and conducting lab experiments, and how learning can be best supported (Kirschner & Meester, 1988; Hart et al., 2000).

There are many reasons why students fail to learn from demonstrations (Roth et al., 1997). For example, in many cases separating the signal to be observed from the inevitably measured noise can be difficult, and inference from other demonstrations might hinder interpretation of a specific experiment. Sometimes students even “remember” witnessing outcomes of experiments that were not there (Milner-Bolotin et al., 2007). Even if students’ and instructors’ observations were the same, this does not guarantee congruent conceptual understanding and conceptual dissimilarity may persist unless specifically addressed. However, helping students overcome deeply rooted notions is not simply a matter of telling them which mistakes to avoid. Often, students are unaware of the discrepancy between the instructors’ words and their own thoughts, and hear statements by the instructor as confirmation of their own thoughts, even though they might in fact be conflicting (Milner-Bolotin et al., 2007).

Prior knowledge can sometimes stand in the way of understanding new scientific information when the framework in which the prior knowledge is organized does not seem to organically integrate the new knowledge (Vosniadou, 2013).The goal is, however, to integrate new knowledge with pre-existing conceptions, not build parallel structures that are activated in context of this class but dormant or inaccessible otherwise. Instruction is more successful when in addition to having students observe an experiment, they are also asked to predict the outcome before the experiment, and discuss their observations afterwards (Crouch et al., 2004). Similarly, Muller et al. (2007) find that even learning from watching science videos is improved if those videos present and discuss common misconceptions, rather than just presenting the material textbook-style. Dissatisfaction with existing conceptions and the awareness of a lack of an answer to a posed question are necessary for students to make major changes in their concepts (Kornell, 2009, Piaget, 1985; Posner et al., 1982). When instruction does not provide explanations that answer students’ problems of understanding the scientific point of view from the students’ perspective, it can lead to fragmentation and the formation of synthetic models (Vosniadou, 2013).

One operationalization of a teaching approach to support conceptual change is the elicit-confront-resolve approach (McDermott, 1991), which consists of three steps: Eliciting a lingering misconception by asking students to predict an experiment’s outcome and to explain their reasons for the prediction, confronting students with an unexpected observation which is conflicting with their prediction, and finally resolving the matter by having students come to a correct explanation of their observation.

HOW STUDENTS TRADITIONALLY LEARN ABOUT THE CORIOLIS FORCE

The Coriolis force is essential in explaining formation and behavior of ocean currents and weather systems we observe on Earth. It thus forms an important part of any instruction on oceanography, meteorology or climate sciences. When describing objects moving on the rotating Earth, the most commonly used frame of reference would be fixed on the Earth, so that the motion of the object is described relative to the rotating Earth. The moving object seems to be under the influence of a deflecting force – the Coriolis force – when viewed from the co-rotating reference frame. Even though the movement of an object is independent of the frame of reference (the set of coordinate axes relative to which the position and movement of an object is described is arbitrary and usually made such as to simplify the descriptive equations of the object), this is not immediately apparent.

Temporal and spatial frames of reference have been described as thresholds to student understanding (Baillie et al., 2012, James, 1966; Steinberg et al., 1990). Ever since its first mathematical description in 1835 (Coriolis, 1835), this concept is most often taught as a matter of coordinate transformation, rather than focusing on its physical relevance (Persson, 1998). Most contemporary introductory books on oceanography present the Coriolis force in that form (cf. e.g. Cushman-Roisin, 1994; Gill, 1982; Pinet, 2009; Pond and Pickard, 1983; Talley et al., 2001; Tomczak and Godfrey, 2003; Trujillo and Thurman, 2013). The Coriolis force is therefore often perceived as “a ‘mysterious’ force resulting from a series of ‘formal manipulations’” (Persson, 2010). Its unintuitive and seemingly un-physical character makes it difficult to integrate into existing knowledge and understanding, and “even for those with considerable sophistication in physical concepts, one’s first introduction to the consequences of the Coriolis force often produces something analogous to intellectual trauma” (Knauss, 1978).

In many courses, helping students gain a deeper understanding of rotating systems and especially the Coriolis force, is approached by presenting demonstrations, typically of a ball being thrown on a merry-go-round, showing the movement simultaneously from a rotating and a non-rotating frame (Urbano & Houghton, 2006), either in the form of movies or simulations, or in the lab as demonstration, or as a hands-on experiment[i]. After conventional instruction that exposed students to discussions and simulations, students are able to do calculations related to the Coriolis force.

Nevertheless, when confronted with a real-life situation where they themselves are not part of the rotating system, students show difficulty in anticipating the movement of an object on a rotating body. In a traditional Coriolis experiment (Figure1), for example, a student launches a marble from a ramp on a rotating table (Figure 2A, B) and the motion of the marble is observed from two vantage points: where they are standing in the room, i.e. outside of the rotating system of the table; and on a screen that displays the table, as captured by a co-rotating camera mounted above it. When asked, before that experiment, what path the marble on the rotating surface will take, students report that they anticipate observing a deflection, its radius depending on the rotation’s direction and rate. After having observed the experiment, students report that they saw what they expected to see even though it never happened. Contextually triggered, knowledge elements are invalidly applied to seemingly similar circumstances and lead to incorrect conclusions (DiSessa & Sherin, 1988; Newcomer, 2010). This synthetic model of always expecting to see a deflection of an object moving on a rotating body, no matter which system of reference it is observed from, needs to be modified for students to productively work with the concept of the Coriolis force.
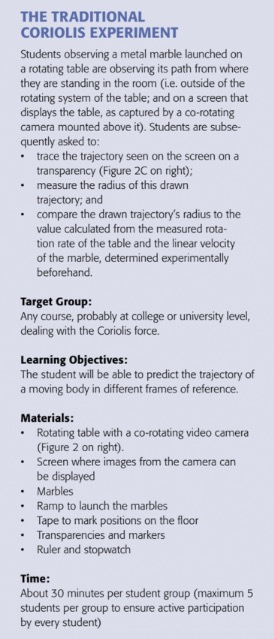
Figure 1: Details of the Coriolis experiment

Figure 1: Details of the Coriolis experiment

Despite these difficulties in interpreting the observations and understanding the underlying concepts, rotating tables recently experienced a rise in popularity in undergraduate oceanography instruction (Mackin et al., 2012) as well as outreach to illustrate features of the oceanic and atmospheric circulation(see for example Marshall and Plumb, 2007). This makes it even more important to consider what students are intended to learn from such demonstrations or experiments, and how these learning outcomes can be achieved.
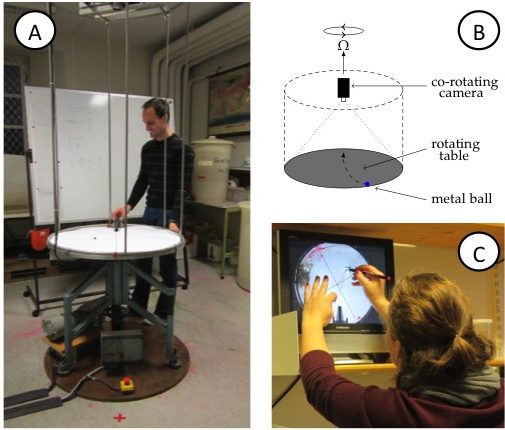
Figure 2A: View of the rotating table including the video camera on the scaffolding above the table. B: Sketch of the rotating table, the mounted (co-rotating) camera, and the marble on the table. C: Student tracing the curved trajectory of the marble on a transparency. On the screen, the experiment is shown as captured by the co-rotating camera, hence in the rotating frame of reference. 

Figure 2A: View of the rotating table including the video camera on the scaffolding above the table. B: Sketch of the rotating table, the mounted (co-rotating) camera, and the marble on the table. C: Student tracing the curved trajectory of the marble on a transparency. On the screen, the experiment is shown as captured by the co-rotating camera, hence in the rotating frame of reference.

A RE-DESIGNED HANDS-ON INTRODUCTION TO THE CORIOLIS FORCE

The traditional Coriolis experiment, featuring a body on a rotating table[ii], observed both from within and from outside the rotating system, can be easily modified to support conceptual understanding.

When students of oceanography are asked to do a “dry” experiment (in contrast to a “wet” one with water in a tank on the rotating table) on the Coriolis force, at first, this does not seem like a particularly interesting phenomenon to students because they believe they know all about it from the lecture already. The experiment quickly becomes intriguing when a cognitive dissonance arises and students’ expectations do not match their observations. We use an elicit-confront-resolve approach to help students observe and understand the seemingly conflicting observations made from inside versus outside of the rotating system (Figure 3). To aid in making sense of their observations in a way that leads to conceptual understanding the three steps elicit, confront, and resolve are described in detail below.
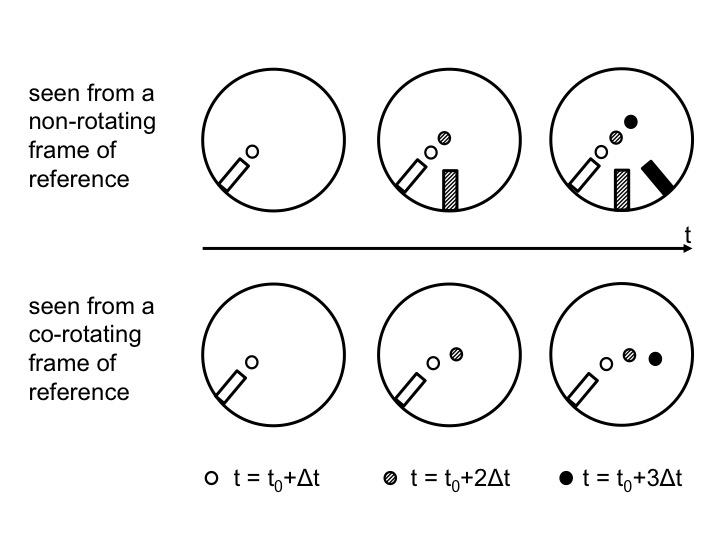
Figure 3: Positions of the ramp and the marble as observed from above in the non-rotating (top) and rotating (bottom) case. Time progresses from left to right. In the top plots, the positions are shown in inert space. From left to right, the current positions of the ramp and marble are added with gradually darkening colors. In the bottom plots, the ramp stays in the same position relative to the co-rotating observer, but the marble moves and the current position is always displayed with the darkest color.

Figure 3: Positions of the ramp and the marble as observed from above in the non-rotating (top) and rotating (bottom) case. Time progresses from left to right. In the top plots, the positions are shown in inert space. From left to right, the current positions of the ramp and marble are added with gradually darkening colors. In the bottom plots, the ramp stays in the same position relative to the co-rotating observer, but the marble moves and the current position is always displayed with the darkest color.

2. What do you think will happen? Eliciting a (possibly) lingering misconception

Students have been taught in introductory lectures that any moving object in a counter-clockwise rotating system (i.e. in the Northern Hemisphere) will be deflected to the right. They are also aware that the extent to which the object is deflected depends on its velocity and the rotational speed of the reference frame. In our experience, due to this prior schooling, students expect to see a Coriolis deflection even when they observe a rotating system “from the outside”. When the conventional experiment is run without going through the additional steps described here, students often report having observed the (non-existent) deflection.

By activating this prior knowledge and discussing what students anticipate observing under different conditions before the actual experiment is conducted, the students’ insights are put to the test. This step is important since the goal is to integrate new knowledge with pre-existing conceptions, not build parallel structures that are activated in context of this class but dormant or inaccessible otherwise. Sketching different scenarios (Fan, 2015; Ainsworth et al., 2011) and trying to answer questions before observing experiments support the learning process since students are usually unaware of their premises and assumptions (Crouch et al., 2004). Those need to be explicated and documented (even just by saying them out loud) before they can be tested, and either be built on, or, if necessary, overcome. 

We therefore ask students to observe and describe the path of a marble being radially launched from the perimeter of the circular, non-rotating table by a student standing at a marked position next to the table, the “launch position”. The marble is observed rolling towards and over the center point of the table, dropping off the table diametrically opposite from the position from which it was launched. So far nothing surprising. A second student – the catcher– is asked to stand at the position where the marble dropped off the table’s edge so as to catch the marble in the non-rotating case. The position is also marked on the floor with tape to document the observation.

Next, the experimental conditions of this thought experiment (Winter, 2015) are varied to reflect on how the result depends on them. The students are asked to predict the behavior of the marble once the table is put into slow rotation. At this point, students typically enquire about the direction of rotation and, when assured that “Northern Hemisphere” counter-clockwise rotation is being applied, their default prediction is that the marble will be deflected to the right. When asked whether the catcher should alter their position, the students commonly answer that the catcher should move some arbitrary angle, but typically less than 90 degrees, clockwise around the table.  The question of the influence of an increase in the rotational rate of the table on the catcher’s placement is now posed. “Still further clockwise”, is the usual answer. This then leads to the instructor’s asking whether a rotational speed exists at which the student launching the marble, will also be able to catch it themselves. Usually the students confirm that such a situation is indeed possible.

2. Did you observe what you expected to see? Confronting the misconception

After “eliciting” student conceptions, the “confront” step serves to show the students the discrepancy between what they expect to see, and what they actually observe. Starting with the simple, non-rotating case, the marble is launched again and the nominated catcher, positioned diametrically across from the launch position, seizes the marble as it falls off the table’s surface right in front of them. As theoretically discussed beforehand, the table is then put into rotation at incrementally increasing rates, with the marble being launched from the same position for each of the different rotational speeds.  It becomes clear that the catcher can – without any adjustments to their position – remain standing diametrically opposite to the student launching the marble – the point where the marble drops to the floor. Hence students realize that the movement of the marble relative to the non-rotating laboratory is unaffected by the table’s rotation rate.

This observation appears counterintuitive, since the camera, rotating with the system, shows the curved trajectories the students had expected; segments of circles with decreasing radii as the rotation rate increases. Furthermore, to add to the confusion, when observed from their positions around the rotating table, the path of the marble on the rotating table appears to show a deflection, too.  This is due to the observer’s eye being fooled by focusing on features of the table, e.g. marks on the table’s surface or the bars of the camera scaffold, relative to which the marble does, indeed, follow a curved trajectory. To overcome this optical illusion, the instructor may ask the students to crouch, diametrically across from the launcher, so that their line of sight is aligned with the table’s surface, i.e. at a zero-zenith angle of observation. From this vantage point, the marble is observed to indeed be moving in a straight line towards the observer, irrespective of the rotation rate of the table. Observing from different perspectives and with focus on different aspects (Is the marble coming directly towards me? Does it fall on the same spot as before? Did I need to alter my position in the room at all?) helps students gain confidence in their observations.

To solidify the concept, the table may again be set into rotation. The launcher and the catcher are now asked to pass the marble to one another by throwing it across the table without it physically making contact with the table’s surface. As expected, the marble moves in a straight line between the launcher and the catcher, whom are both observing from an inert frame of reference. However, when viewing the playback of the co-rotating camera, which represents the view from the rotating frame of reference, the trajectory is observed as curved[iii].

3. Do you understand what is going on? Resolving the misconception

Misconceptions that were brought to light during the “elicit” step, and whose discrepancy with observations was made clear during the “confront” step, are finally resolved in this step. While this sounds very easy, in practice it is anything but. For learning to take place, the instructor needs to aid students in reflecting upon and reassessing previous knowledge by pointing out and dispelling any remaining implicit assumptions, making it clear that the discrepant trajectories are undoubtedly the product of viewing the motion from different frames of reference. Despite the students’ observations and their participation in the experiment this does not happen instantaneously. Oftentimes further, detailed discussion is required. Frequently students have to re-run the experiment themselves in different roles (i.e. as launcheras well as catcher) and explicitly state what they are noticing before they trust their observations.

For this experiment to benefit the learning outcomes of the course, which go beyond understanding of a marble on a rotating table and deal with ocean and atmosphere dynamics, knowledge needs to be integrated into previous knowledge structures and transferred to other situations. This could happen by discussion of questions like, for example: How could the experiment be modified such that a straight trajectory is observed on the screen? What would we expect to observe if we added a round tank filled with water and paper bits floating on it to the table and started rotating it? How are our observations of these systems relevant and transferable to the real world? What are the boundaries of the experiment?

IS IT WORTH THE EXTRA EFFORT? DISCUSSION

We taught an undergraduate laboratory course which included this experiment for several years. In the first year, we realized that the conventional approach was not effective. In the second year, we tried different instructional approaches and settled on the one presented here. We administered identical work sheets before and after the experiment. These work sheets were developed as instructional materials to ensure that every student individually went through the elicit-confront-resolve process. Answers on those worksheets show that all our students did indeed expect to see a deflection despite observing from an inert frame of reference: Students were instructed to consider both a stationary table and a table rotating at two different rates.  They were then asked to, for each of the scenarios, mark with an X the location where they thought the marble would contact the floor after dropping off the table’s surface.  Before instruction, all students predicted that the marble would hit the floor in different spots – diametrically across from the launch point for no rotation, and at increasing distances from that first point with increasing rotation rates of the table (Figure 4). This is the exact misconception we aimed to elicit with this question: students were applying correct knowledge (“in the Northern Hemisphere a moving body will be deflected to the right”) to situations where this knowledge was not applicable: when observing the rotating body and the moving object upon it from an inert frame of reference.
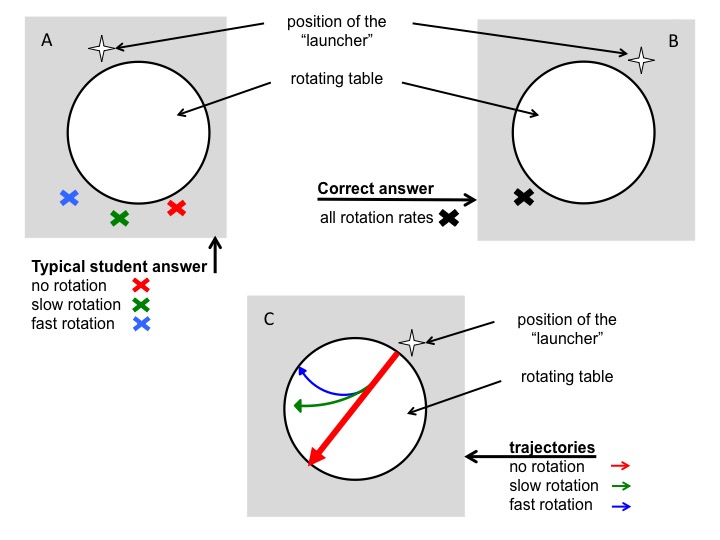
Figure 4A: Depiction of the typical wrong answer to the question: Where would a marble land on the floor after rolling across a table rotating at different rotation rates? B: Correct answer to the same question. C: Correct traces of marbles rolling across a rotating table.

Figure 4A: Depiction of the typical wrong answer to the question: Where would a marble land on the floor after rolling across a table rotating at different rotation rates? B: Correct answer to the same question. C: Correct traces of marbles rolling across a rotating table.

In a second question, students were asked to imagine the marble leaving a dye mark on the table as it rolls across it, and to draw these traces left on the table. In this second question, students were thus required to infer that this would be analogous to regarding the motion of the marble as observed from the co-rotating frame of reference. Drawing this trajectory correctly before the experiment is run does not imply a correct conceptual understanding, since the transfer between rotating and non-rotating frames of references is not happening yet and students draw curved trajectories for all cases. However, after the experiment this question is useful especially in combination with the first one, as it requires a different answer than the first, and an answer that students just learned they should not default to.

The students’ laboratory reports supply additional support of the usefulness of this new approach.  These reports had to be submitted a week after doing the experiment and accompanying work sheets, which were collected by the instructors.  One of the prompts in the lab report explicitly addresses observing the motion from an inert frame of reference as well as the influence of the table’s rotational period on such motion. This question was answered correctly by all students. This is remarkable for three reasons: firstly, because in the previous year with conventional instruction, this question was answered incorrectly by the vast majority of students; secondly, from our experience, lab reports have a tendency to be eerily similar year after year which did not hold true for tis specific question; and lastly, because for this cohort, it is one of very few questions that all students answered correctly in their lab reports, which included seven experiments in addition to the Coriolis experiment. These observations lead us to believe that students do indeed harbor the misconception we suspected, and that the modified instructional approach has supported conceptual change.

CONCLUSIONS

We present modifications to a “very simple” experiment and suggest running it before subjecting students to more advanced experiments that illustrate concepts like Taylor columns or weather systems. These more complex processes and experiments cannot be fully understood without first understanding the Coriolis force acting on the arguably simplest bodies. Supplying correct answers to standard questions alone, e.g. “deflection to the right on the northern hemisphere”, is not sufficient proof of understanding.

In the suggested instructional strategy, students are required to explicitly state their expectations about what the outcome of an experiment will be, even though their presuppositions are likely to be wrong. The verbalizing of their assumptions aids in making them aware of what they implicitly hold to be true. This is a prerequisite for further discussion and enables confrontation and resolution of potential misconceptions. Wesuggest using an elicit-confront-resolve approach even when the demonstration is not run on an actual rotating table, but virtually conducted instead, for example using Urbano & Houghton (2006)’s Coriolis force simulation. We claim that the approach is nevertheless beneficial to increasing conceptual understanding.

We would like to point out that gaining insight from any seemingly simple experiment, such as the one discussed in this article, might not be nearly as straightforward or obvious for the students as anticipated by the instructor. Using an intriguing phenomenon to be investigated experimentally, and slightly changing conditions to understand their influence on the result, is highly beneficial. Probing for conceptual understanding in new contexts, rather than the ability to calculate a correct answer, proved critical in understanding where the difficulties stemmed from, and only a detailed discussion with several students could reveal the scope of difficulties.

ACKNOWLEDGEMENTS

The authors are grateful for the students’ consent to be featured in this article’s figures.


RESOURCES

Movies of the experiment can be seen here:

Rotating case: https://vimeo.com/59891323

Non-rotating case: https://vimeo.com/59891020

Using an old disk player and a ruler in absence of a co-rotating camera: https://vimeo.com/104169112


REFERENCES

Ainsworth, S., Prain, V., & Tytler, R. 2011. Drawing to Learn in Science Science, 333(6046), 1096-1097 DOI: 10.1126/science.1204153

Baillie, C., MacNish, C., Tavner, A., Trevelyan, J., Royle, G., Hesterman, D., Leggoe, J., Guzzomi, A., Oldham, C., Hardin, M., Henry, J., Scott, N., and Doherty, J.2012. Engineering Thresholds: an approach to curriculum renewal. Integrated Engineering Foundation Threshold Concept Inventory 2012. The University of Western Australia, <http://www.ecm.uwa.edu.au/__data/assets/pdf_file/0018/2161107/Foundation-Engineering-Threshold-Concept-Inventory-120807.pdf>

Bertamini, M., Spooner, A., & Hecht, H. (2003). Naïve optics: Predicting and perceiving reflections in mirrors. JOURNAL OF EXPERIMENTAL PSYCHOLOGY HUMAN PERCEPTION AND PERFORMANCE29(5), 982-1002.

Coriolis, G. G. 1835. Sur les équations du mouvement relatif des systèmes de corps. J. de l’Ecole royale polytechnique15: 144–154.

Crouch, C. H., Fagen, A. P., Callan, J. P., and Mazur. E. 2004. Classroom Demonstrations: Learning Tools Or Entertainment?. American Journal of Physics, Volume 72, Issue 6, 835-838.

Cushman-Roisin, B. 1994. Introduction to Geophysical Fluid DynamicsPrentice-Hall. Englewood Cliffs, NJ, 7632.

diSessa, A.A. and Sherin, B.L., 1998. What changes in conceptual change?. International journal of science education20(10), pp.1155-1191.

Durran, D. R. and Domonkos, S. K. 1996. An apparatus for demonstrating the inertial oscillation, BAMS, Vol 77, No 3

Fan, J. (2015). Drawing to learn: How producing graphical representations enhances scientific thinking. Translational Issues in Psychological Science, 1(2), 170-181 DOI: 10.1037/tps0000037

Gill, A. E. 1982. Atmosphere-ocean dynamics(Vol. 30). Academic Pr.

James, E.L., 1966. Acceleration= v2/r. Physics Education1(3), p.204.

Kornell, N., Jensen Hays, M., and Bjork, R.A. (2009), Unsuccessful Retrieval Attempts Enhance Subsequent Learning, Journal of Experimental Psychology: Learning, Memory, and Cognition 2009, Vol. 35, No. 4, 989–998

Hart, C., Mulhall, P., Berry, A., Loughran, J., and Gunstone, R. 2000.What is the purpose of this experiment? Or can students learn something from doing experiments?,Journal of Research in Science Teaching, 37(7), p 655–675

Kirschner, P.A. and Meester, M.A.M., 1988. The laboratory in higher science education: Problems, premises and objectives. Higher education17(1), pp.81-98.

Knauss, J. A. 1978. Introduction to physical oceanography. Englewood Cliffs, N.J: Prentice-Hall.

Mackin, K.J., Cook-Smith, N., Illari, L., Marshall, J., and Sadler, P. 2012. The Effectiveness of Rotating Tank Experiments in Teaching Undergraduate Courses in Atmospheres, Oceans, and Climate Sciences, Journal of Geoscience Education, 67–82

Marshall, J. and Plumb, R.A. 2007. Atmosphere, Ocean and Climate Dynamics, 1stEdition, Academic Press

McDermott, L. C. 1991. Millikan Lecture 1990: What we teach and what is learned – closing the gap, Am. J. Phys. 59 (4)

Milner-Bolotin, M., Kotlicki A., Rieger G. 2007. Can students learn from lecture demonstrations? The role and place of Interactive Lecture Experiments in large introductory science courses.The Journal of College Science Teaching, Jan-Feb, p.45-49.

Muller, D.A., Bewes, J., Sharma, M.D. and Reimann P. 2007.Saying the wrong thing: improving learning with multimedia by including misconceptions, Journal of Computer Assisted Learning (2008), 24, 144–155

Newcomer, J.L. 2010. Inconsistencies in Students’ Approaches to Solving Problems in Engineering Statics, 40th ASEE/IEEE Frontiers in Education Conference, October 27-30, 2010, Washington, DC

NGSS Lead States. 2013. Next generation science standards: For states, by states. National Academies Press.

Persson, A. 1998.How do we understand the Coriolis force?, BAMS, Vol 79, No 7

Persson, A. 2010.Mathematics versus common sense: the problem of how to communicate dynamic meteorology, Meteorol. Appl. 17: 236–242

Piaget, J. (1985). The equilibration of cognitive structure. Chicago: University of Chicago Press.

Pinet, P. R. 2009. Invitation to oceanography. Jones & Bartlett Learning.

Posner, G.J., Strike, K.A., Hewson, P.W. and Gertzog, W.A. 1982. Accommodation of a Scientific Conception: Toward a Theory of Conceptual Change. Science Education 66(2); 211-227

Pond, S. and G. L. Pickard 1983. Introductory dynamical oceanography. Gulf Professional Publishing.

Roth, W.-M., McRobbie, C.J., Lucas, K.B., and Boutonné, S. 1997. Why May Students Fail to Learn from Demonstrations? A Social Practice Perspective on Learning in Physics. Journal of Research in Science Teaching, 34(5), page 509–533

Steinberg, M.S., Brown, D.E. and Clement, J., 1990. Genius is not immune to persistent misconceptions: conceptual difficulties impeding Isaac Newton and contemporary physics students. International Journal of Science Education12(3), pp.265-273.

Talley, L. D., G. L. Pickard, W. J. Emery and J. H. Swift 2011. Descriptive physical oceanography: An introduction. Academic Press.

Tomczak, M., and Godfrey, J. S. 2003. Regional oceanography: an introduction. Daya Books.

Trujillo, A. P., and Thurman, H. V. 2013. Essentials of Oceanography, Prentice Hall; 11 edition (January 14, 2013)

Urbano, L.D., Houghton J.L., 2006. An interactive computer model for Coriolis demonstrations.Journal of Geoscience Education 54(1): 54-60

Vosniadou, S. (2013). Conceptual change in learning and instruction: The framework theory approach. International handbook of research on conceptual change2, 11-30.

White, R. T. 1996. The link between the laboratory and learning. International Journal of Science Education18(7), 761-774.

Winter, A., 2015. Gedankenexperimente zur Auseinandersetzung mit Theorie. In: Die Spannung steigern – Laborpraktika didaktisch gestalten.Schriften zur Didaktik in den IngenieurswissenschaftenNr. 3, M. S. Glessmer, S. Knutzen, P. Salden (Eds.), Hamburg

Endnotes

[i]While tremendously helpful in visualizing an otherwise abstract phenomenon, using a common rotating table introduces difficulties when comparing the observed motion to the motion on Earth. This is, among other factors, due to the table’s flat surface (Durran and Domonkos, 1996), the alignment of the (also fictitious) centrifugal force with the direction of movement of the marble (Persson, 2010), and the fact that a component of axial rotation is introduced to the moving object when launched. Hence, the Coriolis force is not isolated. Regardless of the drawbacks associated with the use of a (flat) rotating table to illustrate the Coriolis effect, we see value in using it to make the concept of fictitious forces more intuitive, and it is widely used to this effect.

[ii]Despite their popularity in geophysical fluid dynamics instruction at many institutions, rotating tables might not be readily available everywhere. Good instructions for building a rotating table can, for example, be found on the “weather in a tank” website, where there is also the contact information to a supplier given: http://paoc.mit.edu/labguide/apparatus.html. A less expensive setup can be created from old disk players or even Lazy Susans, or found on playgrounds in form of merry-go-rounds. In many cases, setting the exact rotation rate is not as important as having a qualitative difference between “slow” and “fast” rotation, which is very easy to realize. In cases where a co-rotating camera is not available, by dipping the marble in either dye or chalk dust (or by simply running a pen in a straight line across the rotating surface), the trajectory in the rotating system can be visualized. The instructional approach described in this manuscript is easily adapted to such a setup.

[iii]We initially considered starting the lab session by throwing the marble diametrically across the rotating table.  Students would then see on-screen the curved trajectory of a marble, which had never made physical contact with the table rotating beneath it, and which was clearly moving in a straight line from thrower to catcher, leading to the realization that it is the frame of reference that is to blame for the marble’s curved trajectory. However, the speed of a flying marble makes it very difficult to observe its curved path on the screen in real time. Replaying the footage in slow motion helps in this regard.  Yet, replacing direct observation with recording and playback seemingly hampers acceptance of the occurrence as “real”. We therefore decided to only use this method to further illustrate the concept, not as a first step.


Bios

Dr. Mirjam Sophia Glessmer, holds a Master of Higher Education and Ph.D. in physical oceanography. She works at the Leibniz Institute of Science and Mathematics Education in Kiel, Germany. Her research focus lies on informal learning and science communication in ocean and climate sciences.

Pierre de Wet is a Ph.D. student in Oceanography and Climatology at the University of Bergen, Norway, and holds a Master in Applied Mathematics from the University of Stellenbosch, South Africa. He is employed by Akvasafe AS, where he works with the analysis and modelling of physical environmental parameters used in the mooring analysis and accreditation of floating fish farms.
Need your help! “Wish list” for a student lab for tank experiments?

I’d love your input: If your student lab for GFD tank experiments had to downsize, but you had to present a “wish list” for a smaller replacement, what would be on that list? Below are my considerations, but I would be super grateful for any additional input or comments! :-)

Background and “boundary conditions”

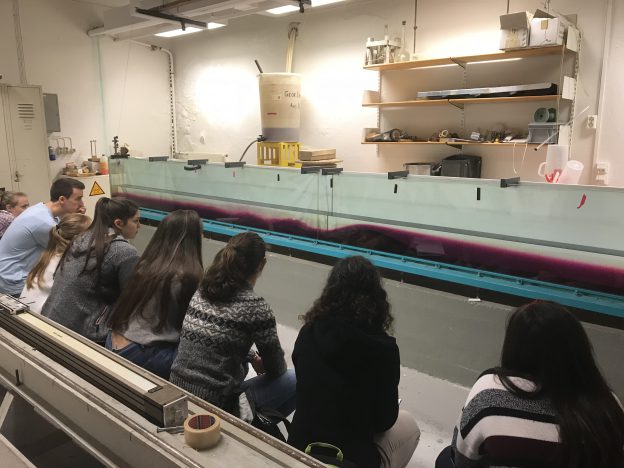
The awesome towing tank that you have come to love (see picture above) will have to be removed to make room for a new cantina. It might get moved into a smaller room, or possibly replaced all together. Here are some external requirements, as far as I am aware of them:

  • the (new) tank should ideally be movable so the (small) room can be used multi-purpose
  • since the new room is fairly small, people would be happy if the new tank was also smaller than the old one
  • the rotating table is kept (and a second, smaller one, exists in the building)
  • There are other, smaller tanks that will be kept for other experiments, dimensions approximately 175x15x40cm and smaller
  • the whole proposal needs to be inexpensive enough so that the likelyhood that it will actually be approved is moderate to fair ;-)

Here are a couple of things I think need to be definitely considered.

Dimensions of the tank

If the tank was to be replaced by a smaller one, how small could the smaller one be?

The dimension of the new tank depend, of course, on the type of experiment that should be done in the tank. Experiments that I have run in the tank that is to be replaced and that in my opinion should definitely be made possible in the new location/tank include

  1. “Dead water”, where a ship creates internal waves on a density interface (instructions)
  2. Internal lee waves & hydraulic jumps, where a mountain is moved at the bottom of the tank (instructions)
  3. Surface imprints of internal waves (example)
  4. Surface waves (example)
  5. Intrusions (example)
  6. Waves in a density stratification (example)
  7. Surface waves running up on a slope (I haven’t blogged about that yet, movies waiting to be edited)

If we want to be able to continue running these experiments, here is why we should not sacrifice the dimensions of the tank.

Why we need the tank length

The first reason for keeping the length of the tank is that the “mountains” being towed to create the lee waves are already 1 and 1.5m long, respectively. This is a length that is “lost” for actual experiments, because obviously the mountain needs space inside the tank on either end (so in its start and end position). Additionally, when the mountain starts to move, it has to move for some distance before the flow starts displaying the features we want to present: Initially, there is no reservoir on the “upstream” side of the mountain and it only builds up over the first half meter or so.

The second reason for keeping the length of the tank are wave reflections once the ship or mountain comes close to the other side of the tank. Reflected surface waves running against the ship will set up additional drag that we don’t want when we are focussing on the interaction between the ship and the internal wave field. Reflected internal waves similarly mess things up in both experiments

The third reason for keeping the length of the tank is its purpose: as teaching tank. Even if one might get away with a slightly shorter tank for experiments when you just film and investigate the short stretch in the middle of the tank where there are no issues with either the push you gave the system when starting the experiment or the reflections when you get near the end, the whole purpose of the tank is to have students observe. This means that there needs to be a good amount of time where the phenomenon in question is actually present and observable, which, for the tank, means that it has to be as long as possible.

Why we need the tank width

In the experiments mentioned above, with exception of the “dead water” experiment, the tank represents a “slice” of the ocean. We are not interested in changes across the width of the tank, and therefore it does not need to be very wide. However, if there is water moving inside the tank, there will be friction with the side walls and the thinner the tank, the more important the influence of that friction will become. If you look for example at the surface imprint of internal wave experiment, you do see that the flow is slowed down on either side. So if you want flow that is outside of the boundary layers on either side, you need to keep some width.

Secondly, not changing the tank’s width has the advantage that no new mountains/ships need to be built.

Another, practical argument for a wide-ish tank (that I feel VERY strongly about) is that the tank will need to be cleaned. Not just rinsed with water, but scrubbed with a sponge. And I have had my hands inside enough tanks to appreciate if the tank is wide enough that my arm does not have to touch both sides at all times when reaching in to clean the tank.

Why we need the tank depth

The first reason for keeping the height is that for the “dead water” experiment, even the existing tank is a lot shallower than what we’d like from theory (more here). If we go shallower, at some point the interactions between the internal waves and the ground will become so large that it will mess up everything.

Another reason for keeping the depth is the “waves running up a slope” experiment. If you want waves running up a slope (and building up in height as they do), you have the choice between high walls of the tank or water spilling. Just sayin’…

And last not least: this tank has been used in “actual” research (rather than just teaching demonstrations, more on that on Elin’s blog), so if nothing else, those guys will have thought long and hard about what they need before building the tank…

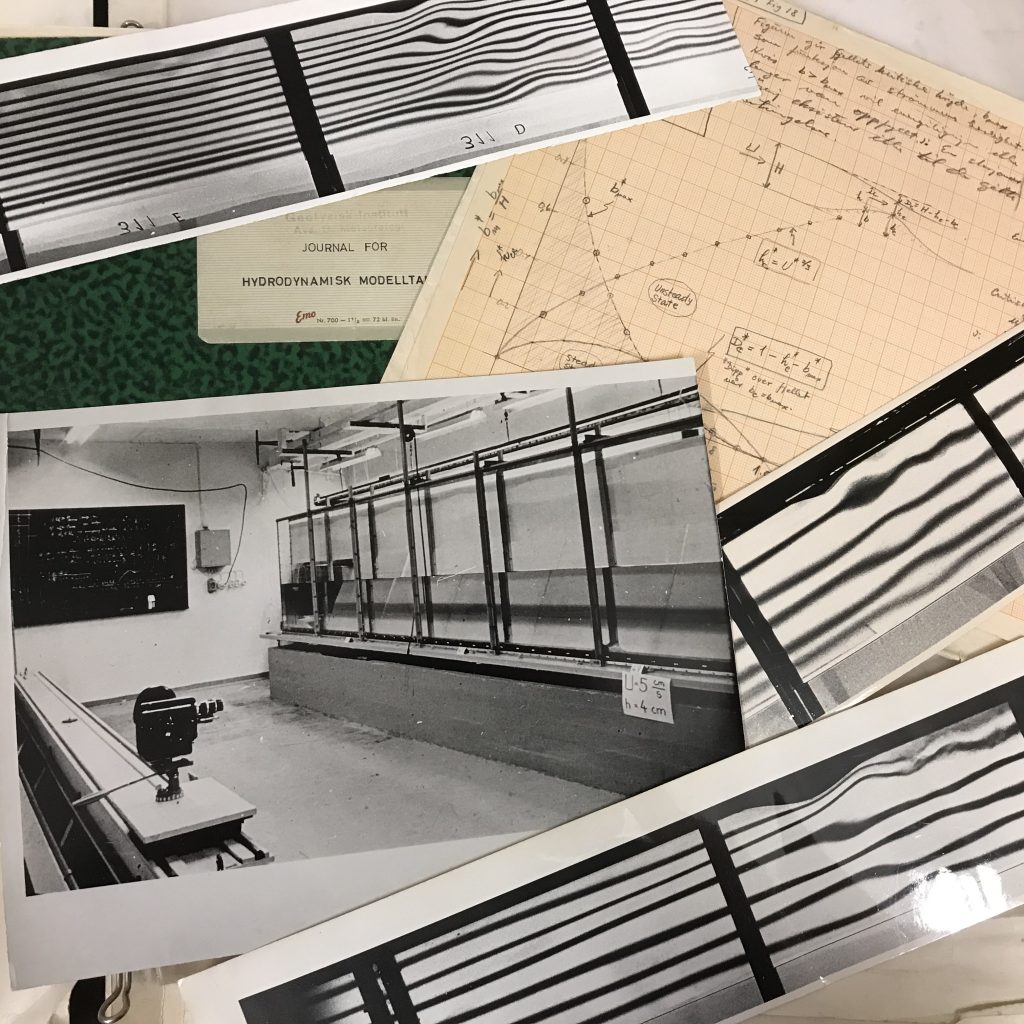
Historical images of research on internal lee waves being done with the tank

Without getting too philosophical here about models and what they can and cannot achieve (and tank experiments being models of phenomena in the ocean), the problem is that scaling of the ocean into a tiny tank does not work, so “just use a mountain/boat half the size of the existing ones!” is actually not possible. Similarly to how if you build the most amazing model train landscape, at some point you will decide that tiny white dots are accurate enough representations of daisies on a lawn, if you go to a certain size, the tank will not be able to display everything you want to see. So going smaller and smaller and smaller just does not work. A more in-depth and scientific discussion of the issue here.

Other features of the tank

When building a new tank or setting up the existing tank in a new spot, there are some features that I consider to be important:

  • The tank needs a white, intransparent back wall (either permanently or draped with something) so that students can easily focus on what is going on inside the tank. Tank experiments are difficult to observe and even more difficult to take pictures of, the better the contrast against a calm background, the better
  • The tank should be made of glass or some other material that can get scrubbed without scratching the surface. Even if there is only tap water in the tank, it’s incredible how dirty tanks get and how hard they have to be scrubbed to get clean again!
  • The tank needs plenty of inlets for source waters to allow for many different uses. With the current tank, I have mainly used an inlet through the bottom to set up stratifications, because it allowed for careful layering “from below”. But sometimes it would be very convenient to have inlets from the side close to the bottom, too. And yes, a hose could also be lowered into the tank to have water flow in near the bottom, but then there needs to be some type of construction on which a hose can be mounted so it stays in one place and does not move.
  • There needs to be scaffolding above the tank, and it needs to be easily modifiable to mount cameras, pulleys, lights, …
  • We need mechanism to tow mountains and ships. The current tank has two different mechanisms set up, one for mountains, one for ships. While the one for the ship is home-made and easily reproducible in a different setting (instructions), the one to tow the mountain with is not. If there was a new mechanism built, one would need to make sure the speeds at which the mountain can be towed matches the internal wave speed to be used in the experiment, which depends on the stratification. This is easy enough to calculate, but it needs to be done before anything is built. And the mechanism does require very securely installed pulleys at the bottom of the tank which need to be considered and planned for right from the start.

“Source” reservoirs

The “source” reservoirs (plural!) are the reservoirs in which water is prepared before the tank is filled. It is crucial that water can be prepared in advance; mixing water inside the tank is not feasible.

There should be two source reservoirs, each large enough to carry half the volume of the tank. This way, good stratifications can be set up easily (see here for how that works. Of course it works also with smaller reservoirs in which you prepare water in batches as you see below. But what can happen then is that you don’t get the water properties exactly right and you end up seeing stuff you did not want to see, as for example here, which can mess up your whole experiment)

Both reservoirs should sit above the height of the tank so that the water can be driven into the tank by gravity (yes, pumps could work, too, more on that below).

“Sink” reservoir

Depending on the kind of dyes and tracer used in the water, the water will need to be collected and disposed of rather than just being poured down the drain. The reservoir that catches the “waste” water needs to

  • be able to hold the whole volume of the tank
  • sit lower than the tank so gravity will empty the tank into the reservoir (or there needs to be a fast pump to empty the tank, more on that below)
  • be able to be either transported out of the room and the building (which means that doors have to be wide enough, no steps on the way out, …) or there needs to be a way to empty out the reservoir, too
  • be able to either easily be replaced by an empty one, or there needs to be some kind of mechanism for who empties it within a couple of hours of it being filled, so that the next experiment can be run and emptied out

If the waste water is just plain clear tap water, it can be reused for future experiments. In this case, it can be stored and there need to be…

Pumps

If reservoirs cannot be located above and below tank height to use gravity to fill and empty the tanks, we need pumps (plural).

  • A fast pump to empty out the tank into the sink reservoir, which can also be used to recycle the water from the sink reservoir into the source reservoirs
  • One pump that can be regulated very precisely even at low flow rates to set the inflow into the tank
  • Ideally, a second pump that can be regulated very precisely, so the double bucket method of setting up a stratification in a tank can be done automated rather than relying on gravity.

Preferable the first and the latter are not the same, because changing settings between calibrating the pump for an experiment, setting it on full power to empty the tank, and calibrating it again will cause a lot of extra work.

Inlets for dyes

Sometimes it would be extremely convenient if there was a possibility to insert dyes into the tank for short, distinct periods of time during filling to mark different layers. For this, it would be great to be able to connect syringes to the inlet

Hoses and adapters

I’ve worked for years with whatever hoses I could find, and tons of different adapters to connect the hoses to my reservoir, the tap, the tank. It would be so much less of a hassle if someone thought through which hoses will actually be needed, bought them at the right diameter and length, and outfitted them with the adapters they needed to work.

Space to run the experiment

The tank needs to be accessible from the back side so the experimenter can run the experiment without walking in front of the observers (since the whole purpose of the tank is to be observed by students). The experimenter also needs to be able to get out from behind the tank without a hassle so he or she can point out features of interest on the other side.

Also, very importantly, the experimenter needs to be able to reach taps very quickly (without squeezing through a tight gap or climbing over something) in case hoses come loose, or the emergency stop for any mechanism pulling mountains in case something goes wrong there.

Space for observers

There needs to be enough room to have a class of 25ish students plus ideally a handful of other interested people in the room. But not only do they need to fit into the room, they also need to be able to see the experiments (they should not have to stand in several rows behind each other, so all the small people in the back get to see are the shoulders of the people in front). Ideally, there will be space so they can duck down to have their eyes at the same height as the features of interest (e.g. the density interface). If the students don’t have the chance to observe, there is no point of running an experiment in the first place.

Filming

Ideally, when designing the layout of the room, it is considered how tank experiments will be documented, i.e. most likely filmed, and there needs to be space at a sufficient distance from the tank to set up a tripod etc..

Lighting

Both for direct observations and for students observing tank experiments, it is crucial that the lighting in the room has been carefully planned so there are minimal reflections on the walls of the tank and students are not blinded by light coming through the back of the tank if a backlighting solution is chosen.

Summary

In my experience, even though many instructors are extremely interested in having their students observe experiments, there are not many people willing to run tank experiments of the scale we are talking about here in their teaching. This is because there is a lot of work involved in setting up those experiments, running them, and cleaning up afterwards. Also there are a lot of fears of experiments “going wrong” and instructors then having to react to unexpected observations. Running tank experiments requires considerable skill and experience. So if we want people using the new room and new tank at all, this has to be made as easy as possible for them. Therefore I would highly recommend that someone with expertise in setting up and running experiments, and using them in teaching, gets involved in designing and setting up the new room. And I’d definitely be willing to be that person. Just sayin’ ;-)

“Continue. Start. Stop.”. An article supporting the usefulness of my favourite method of asking for student feedback on a course!

I’ve been recommending the “Continue. Start. Stop.” feedback method for years an years (at least since my 2013 blog post), but not as a research-backed method but mostly based on my positive personal experience with it. I have used this method to get feedback on courses I’ve been teaching a couple of weeks into the course in order to improve my teaching both within the course as well as over the years. If there was anything that students thought would improve their learning, I wanted to be able adapt my teaching (and also, in a follow-up discussion of the feedback, be able to address student expectations that might not have been explicit before that I might or might not want to follow). I like that even though it’s a qualitative method and thus fairly open, it gives students a structure along which they can write their feedback. Also by asking what should be continued as well as stopped and started, it’s a nice way to get feedback on what’s already working well, too! But when I was asked for a reference for the method today, I didn’t really have a good answer. But then I found one: an article by Hoon et al. (2015)!

Studies on the “continue. start. stop.” feedback vs open feedback

In the first study in the article, two different feedback methods are compared over three different courses: a free form feedback and a structured format, similar to “continue. start. stop.”. From this study, the authors draw pointers for changing the feedback method in the free form course to a more structured feedback. They investigate the influence of this change in a second study.

In that second study, the authors find that using a structured feedback led to an increasing depth of feedback, and that the students liked the new form of giving feedback. They also find indications that the more specific the questions are, the more constructive (as compared to more descriptive texts in the open form; not necessarily more positive or negative!) the feedback is.

My recommendations for how to use the “continue. start. stop.” feedback

If anything, this article makes me like this feedback method even more than I did before. It’s easy and straight forward and actually super helpful!

Use this as formative feedback!

Ask for this feedback early on in the course (maybe after a couple of weeks, when students know what to expect in your course, but with plenty of the course left to actually react to the feedback) and use the student replies to help you improve your teaching. While this method can of course also be used as summative feedback at the end of the course, how much cooler is it if students can benefit from the feedback they gave you?

Ask full questions

One thing that I might not have been clear about before when talking about the “continue. start. stop.” feedback method is that it is important to actually use the whole phrases (“In order to improve your learning in this course, please give me feedback on the following points

  1. Continue: What is working well in this course that you would like to continue?
  2. Start: What suggestions do you have for things that could improve the course?
  3. Stop: What would you like us to stop doing?”

or similar) rather than just saying “continue. start. stop.” and assuming the students know what that means.

Leave room for additional comments

It is also helpful to give an additional field for other comments the students might have, you never know what else they’d like to tell you if only they knew how and when to do it.

Use the feedback for several purposes at once!

In the article’s second study, a fourth question is added to the “continue. start. stop.” method, and that is asking for examples of good practice and highlights. The authors say this question was mainly included for the benefit of “external speakers who may value course feedback as evidence of their own professional development and engagement with education”, and I think that’s actually a fairly important point. While the “continue. start. stop.” feedback itself is a nice addition to any teaching portfolio, why not think specifically about the kind of things you would like to include there, and explicitly ask for them?

Give feedback on the feedback

It’s super important that you address the feedback you got with your class! Both so that they feel heard and know whether their own perception and feedback agrees with that of their peers, as well as to have the opportunity to discuss what parts of their suggestions you are taking on, what will be changing as a result of their suggestions, and what you might not want to change (and why!). If this does not happen, students might not give you good feedback the next time you ask for it because they feel that since it didn’t have an effect last time, why would they bother doing it again?

Now it’s your turn!

Have you used the “continue. start. stop.” method? How did it work for you? Will you continue using it or how did you modify it to make it suit you better? Let me know in the comments below! :-)

Reference:

Hoon, A. and Oliver, E.J. and Szpakowska, K. and Newton, P. (2015) ‘Use of the ‘Stop, Start, Continue’ method is associated with the production of constructive qualitative feedback by students in higher education.’, Assessment and evaluation in higher education., 40 (5). pp. 755-767. [link]

Asking students to take pictures to help them connect theory to the reality of their everyday lives

— This post was written for “Teaching in the Academy” in Israel, where it was published in Hebrew! Link here. —

Many times students fail to see the real-life relevance of what they are supposed to be learning at university. But there is an easy way to help them make the connection: Ask them to take pictures on their smartphones of everything they see outside of class, write a short sentence about what they took a picture of, and why it is interesting, and submit it on an electronic platform to share with you and their peers. And what just happened? You made students think about your topic on their own time!

Does it work?

Does it work? Yes! Obviously there might be some reluctance to overcome at first, and it is helpful to either model the behaviour you want to see yourself, or have a teaching assistant show the students what kind of pictures and texts you are looking for.

Do I have to use a specific platform?

Do I have to use a specific platform? No! I first heard about this method after Dr. Margaret Rubega introduced the #birdclass hashtag on Twitter for her ornithology class. But I have since seen it implemented in a “measuring and automation technology” class that already used a Facebook group for informal interactions (see here), and by a second class on the university’s conventional content management system. All that is required is that students can post pictures and other students can see them.

Do you have examples?

One example from my own teaching in physical oceanography: Hydraulic jumps (see figure below). The topic of hydraulic jumps is often taught theoretically only and in a way that students have a hard time realizing that they can actually observe them all the time in their real lives, for example when washing your dishes, cleaning your deck or taking a walk near a creek. But when students are asked to take pictures of hydraulic jumps, they start looking for them, and noticing them. And even if all of this only takes 30 seconds to take and post a picture (and most likely they spent more time thinking about it!), that’s 30 extra seconds a student thought about your content, that otherwise he or she would have only thought about doing their dishes or cleaning their deck or their car.

hydraulic_jumps

Collection of many images depicting hydraulic jumps found in all kinds of environments of daily life

And even if you do this with one single topic and not every single topic in your class, once students start looking at the world through the kind of glasses that let them spot the hydraulic jumps, they are going to start spotting theoretical oceanography topics everywhere. They will have learned to actually observe the kind of content you care about in class, but in their own world, making your class a lot more relevant to them.

An additional benefit is that you, as the instructor, can also use the pictures in class as examples that students can relate to. I would recommend picking one or two pictures occasionally, and discussing for a minute or two why they are good examples of the topic and what is interesting about them. You can do this as introduction to that day’s topic or as a random anecdote to engage students. But acknowledging the students’ pictures and expanding on their thoughts is really useful to keep them engaged in the topic and make them excited to submit more and better pictures (hence to find better examples in their lives, which means to think more about your course’s topic).

Does this work for subjects outside of STEM, too?

Does this work for subjects outside of STEM, too? Yes! In a language class, for example, you could ask people to submit pictures of something “typically English [or whatever language you are teaching]”. You can then use the pictures to talk about cultural features or prejudices. This could also be done in a social science context. In history, you might ask for examples of how a specific historical period influences life today. In the end, it is not about students finding exact equivalents – it is about them trying to relate their everyday lives to the topics taught in class and the method presented in this article is just a method to help you accomplish that.

P.S.: This text originally appeared on my website as a page. Due to upcoming restructuring of this website, I am reposting it as a blog post. This is the original version last modified on October 1st, 2016.

I might write things differently if I was writing them now, but I still like to keep my blog as archive of my thoughts.

Using real time data of ship positions in teaching?

This morning I was looking for the current position of a research vessel on MarineTraffic.com and noticed something that should maybe not have been surprising, but that I had never really thought about: How all the fishing vessels (orange) are sitting right on the shelf break! I guess that’s where they should be when we think about currents and nutrients and primary production and fish, but how cool is it to actually see it?

screen-shot-2017-03-29-at-08-49-17

And see that area west of Lofoten where there are a lot of fishing boats in a circle? An unnamed inside source told me that that’s where cod is spawning right now, so everybody is going there to fish. Tomorrow, the cluster might be in a completely different place. And even now, some 10 hours later, it seems to have migrated a little northward? Will definitely check again tomorrow!

screen-shot-2017-03-29-at-17-50-40

I obviously had to look whether fishing on the shelf break was just a thing in Northern Norway and turns out that it’s the same on the Greenland Shelf.

screen-shot-2017-03-29-at-10-51-39

Now that I got into playing, I found it also really interesting to see that there is a lot of fishing in the equatorial Pacific going on. And how clearly you can see major traffic routes even in just the distribution of ships.

screen-shot-2017-03-29-at-10-50-11

And then, ShipTracker even offers a density map of ship traffic:

screen-shot-2017-03-29-at-10-55-41

Which I had to screen-shoot in two parts because of reasons:

screen-shot-2017-03-29-at-10-56-00

This site would be such a great tool for all kinds of teaching purposes. Realtime data on shipping is just a click away, even with the free version! There are so many things that students could do estimates on using this site, on transport, fishing, pollution, just pick your topic! And using authentic data makes the whole thing a lot more interesting than looking at maps or numbers a teacher would provide. Pity I’m not teaching right now!

Reflections on reflections

When we think about reflections in water, we usually think of calm lakes and trees on the shore opposite to us. Or clouds. Or at least that’s what I think of: Everything is so far away, that it seems to be reflected at an axis that is a horizontal line far away from us.

Then the other day I walked along Kiel Fjord and it hit me that I had never actually consciously observed reflection of things that are located close to my position, and especially things who are not pretty much equidistant to me, but where one end is a lot closer than another one. Consider the picture below: Do you notice something that looks kinda odd to you (while at the same time looking super familiar)?

2016-10-31-16-28-40

If you are wondering what I mean, I marked it in red in the picture below: The rope and its reflection! It’s embarrassing to say that (as someone who has been sailing A LOT since the age of 7) this was the first time I really noticed, but it struck me how the maximum of the parable of the reflected rope isn’t right below the minimum of the parable of the rope, but seems shifted to the left. Of course this is exactly how it should be if we think about the optics, but I was really shocked that I had never noticed before and never thought about it before! I bet if I had had to draw the reflection I would have done it wrong and probably not even noticed…

2016-10-31-16-28-40-copy

Here is another picture to show you what I mean. This is what it looks like:

2016-10-31-16-31-40

Below I’ve drawn in the original objects in blue, the axis of reflection in red and then the reflection in green:

2016-10-31-16-31-40-copy

So far, so good, everything looking the way it’s supposed to look. Right? Then look at the picture below:
2016-10-31-16-31-40-copy-2

Sorry if this seems obvious to you, but I’m fascinated with this right now :-)

But it leads to another interesting thought: Asking people to draw stuff in order to both check their understanding and also make them reflect on their understanding. I recently had the opportunity to observe a class of master students draw the SST of the mean state of the Pacific Ocean (which was an exercise that I had suggested in connection with a class on El Nino. I thought it would be neat to have them draw the mean state and then later the anomalies of El Nino and La Nina to activate prior knowledge) and it was surprising how difficult that was even though I’m sure they would all have claimed to know what the mean state looks like. Having to draw stuff really confronts us with how sure we are of things we just assumed we knew…

And then I’m pretty sure that once we’ve drawn something that we have constructed ourselves from what we knew (rather than just copied a drawing from the blackboard or a book, although I think that also helps a lot), we are a lot less likely to forget it again.

Anyway, this is a type of exercise I will use — and recommend — a lot more in the future!

Mirjam Glessmer and Timo Lüth leading a workshop for university instructors

You learn better when you think that you will have to teach

Have you ever worked as student tutor? Then you’ve probably felt like you understood the content of the course you tutored a million times better after tutoring it. Or at least that’s what I hear over and over again: People feel like they understood a topic. Then they prepare to teach it, and realise how much more there was to understand and that they actually understood it.

And there is research that shows that you don’t actually need to teach in order to get the deeper understanding, it is enough to anticipate that you will teach: “Expecting to teach enhances learning and organization of knowledge in free recall of text passages” by Nestojko, Bui, Kornell & Bjork (2014).

In that article, two groups of participants are given texts that they are to study. One group is told that they will be tested on the text, the other one that they will have to teach someone else who then will be tested. After all participants study the text, they are then all tested (and nobody gets to teach). But it turns out that even expecting to teach had similar benefits to what we see in student tutors who actually taught: Participants expecting to teach have a better recall of the text they had to study, can answer more questions about it and especially questions regarding main points.

So what does that mean for teaching? As the authors say: “Instilling an expectation to teach […] seems to be a simple, inexpensive intervention with the potential to increase learning efficiency at home and in the classroom.” And we should definitely use that to our advantage! :-)