Tag Archives: kitchen oceanography

My first attempt at building a rotating table for kitchen oceanography using LEGO

Inspired by the article “Affordable Rotating Fluid Demonstrations for Geoscience Education: the DIYnamics Project” by the Hill et al. (2018), I spent a fun Sunday afternoon with my friends Joke and Torge in their kitchen, playing with Legos, water and food dye.

Turns out building a rotating table isn’t as easy as we had hoped, because my Lazy Susan’s axle is unfortunately really off centre (how did I never notice before?), which makes it pretty difficult to drive it with a grinding wheel, and the LEGO motor we were using only has one speed (which would have to be regulated by changing the diameter of the gears). That makes it really difficult to spin up a tank at rest if you go at it zero to full force…

But we got it to spin! Look at the cool paraboloid surface!

Next issue, though: my awesome glass vase which looks like it should work well as a tank has a really irregular bottom, which makes it very difficult to have anything stand in the centre without too much of a wobble. Also, for the Hadley Circulation experiment we were trying to set up here, when do you add in the cooling in the center? Would be best to do it after the tank is spun up, but that is such a pain to do! And I messed up the dye here, too.

But at least you can see a little bit of what it will be like when we are done, right?

Next time:

  • better Lazy Susan
  • better lighting
  • think about how to film it, therefore either have a co-rotating camera or a white background

And then it will be almost ready to be used in teaching. Well, almost…

Funny how tank experiments that you think should be quick and easy to set up & run always take sooo much longer than expected. But it’s so much fun that I really don’t mind! :-)

#KitchenOceanography with Judith and her hot chocolate

Let’s talk about zonal jets! They keep popping into my life all the time right now, and that has got to mean something, right?

Zonal jets, for all that are not quite familiar with the term, are fast-flowing currents (i.e. “jets”) that move along lines of constant latitude (therefore “zonal”). The occur in the ocean (e.g. the Antarctic Circumpolar Current, or the Gulf Stream after separating from the coast) and in the atmosphere (e.g. the subtropical jets stream). And you might be familiar of pictures of Saturn with all the belts around it? Yep, zonal jets!

In December I went to the Science and Industry Museum in Manchester (a.ma.zing place!) and they had one exhibit there that shows zonal jets: A sphere sitting inside a transparent sphere with some sort of fluid between the two. You can put the outer sphere in rotation and, through friction, this puts the fluid in motion. But instead of all the fluid moving with the outer sphere, there is of course also friction with the inner sphere, so a shear flow develops, which breaks up into those zonal jets (which then break up into all the eddies when the outer sphere slows down again).

Please excuse the crappy video. You see the largest part of the upper half of the sphere, but I was filming with one hand and turning the thing with the other… And I didn’t plan on writing anything about it, but then this happened: My friend Judith (check out her Instagram!) and I went on a mini cruise (all the way across Kiel canal!) in freeeeezing temperatures, and therefore obviously ended up with this:

Picture by Judith Schidlo (check out her Instagram!)

And this is where kitchen oceanography comes in. What do you think happens when you drop in that yummy chocolate and start stirring? This!

Do you see how the fluid doesn’t move solid body-ish, but how there are jets and then more stagnant areas? Doesn’t this make you want to have a hot chocolate, and Right Now? For scientific purposes, of course…

Update on freezing ice cubes and the temperature distribution in our freezer

After writing the blog post on sea ice formation, brine release and what ice cubes can tell you about your freezer earlier today, I prepared some more ice cubes (because you can never have too many ice cubes for kitchen oceanography!), and then happened to look into the freezer a couple of hours later. And this is what I found:

Isn’t that beautiful?

Top pic shows the ice cubes “in situ”, clearly showing the cold back wall of the freezer where they were sitting.

Bottom left pic shows a top view of those ice cubes and it is very obvious that they have been starting to freeze from the back wall of the freezer forward: The upper row of ice cubes in the pic has formed clear ice in the direction towards that wall and has pushed the dye forward, whereas the bottom row in the pic is still not completely frozen and ice cubes seem to be freezing from all sides towards the middle and not as distinctly from back to front.

Bottom right pic: The rest of the water I prepared for the ice cubes that I left sitting on the counter for future use — still looks well mixed, no sinking of the dye to be observed!

And with these exciting updates I’ll leave you for now, so start playing with your own ice cubes! :-)

Sea ice formation, brine release, or: What ice cubes can tell you about your freezer

Many of my kitchen oceanography experiments use dyed ice cubes, usually because it makes it easier to track the melt water (for example when looking at how quickly ice cubes melt in freshwater vs salt water, or for forcing overturning circulations).

But the dyed ice cubes tell interesting stories all by themselves, too!

Salt water doesn’t freeze

“Salt water doesn’t freeze”? Then how do we get sea ice in the Arctic, for example?

When freshwater freezes, the water molecules arrange in a hexagonal crystal structure. If there is salt (or anything else) in the water, however, the ions don’t fit into the regular structure. Ice freezes from the water molecules, and all the disturbances like salt get pushed in the last remaining bits of liquid water, which therefore gets higher and higher concentrations of whatever was dissolved in it. As those little pockets with high concentrations of salt get cooled further, more and more water molecules will freeze to the surrounding freshwater ice, leading to even higher concentrations of salt in the remaining liquid water. So the freshwater is freezing, while rejecting the salt.

Of course if you cool for long enough, also the last bit of remaining water will freeze eventually, but that takes surprisingly long (as you can try by freezing salt water in some of the cups ice cube trays and freshwater in others, for comparison. Also the structures of freshwater vs saltwater ice look very different and are interesting to look at, see how here).

“Brine release”

When the ocean freezes, this rejection of high-salinity water leads to interesting phenomena: Even when you melt it again to include all the pockets of high salinity water, sea ice will have salinities way lower than the water it froze from. This is because of a process called brine release. Since you are cooling the ocean from above, sea ice also forms from the surface downwards. This means that it is easy for the salty water to be pushed, “released”, or “rejected”, downwards, into the liquid ocean below. That ocean will then of course get more salty right below the ice!

In the picture below you see something similar happening in the left pictures. Instead of salt, I have used blue food dye for visualization purposes. In the top left, you see an ice cube exactly as it looked when I took it out of the ice cube tray it froze in, and in the bottom left you see the same one after I let it melt a little bit so the surface got smoother and it got easier to look inside (a lot more difficult to hold on to, though!).

Do you see how the top part of the ice cube is pretty much clear, while the bottom part is blue? That’s because it froze top-to-bottom and the dye got pushed down during the initial freezing process!

Stuck in an ice cube tray

Something else that you see in the top left picture is the effect of the ice cube being stuck in the ice cube tray as it froze: Pores filled with blue dye that had nowhere to escape!

Had I taken out those ice cubes earlier, when they had just frozen half way through, we would have found a clear ice layer floating on a cold, blue ocean. Maybe I should do that next time!

Checking on the temperature distribution of your freezer

Something else fun we can observe from the right pictures: Here, the dye was concentrated towards the center of the ice cube rather than the bottom! How did that happen?

My theory is that those ice cubes were located in an area of the freezer that was cooling from all sides (more or less) equally, whereas the ones shown on the left must have been placed somewhere where cooling happened mainly from the top.

So if you ever want to know where the cooling in your freezer happens, just put lots of dyed little water containers everywhere and check from which side the dye gets rejected — that’s the cooling side! Actually, I might check that for the freezer below just for fun. Would you be interested in seeing that done?

Now it’s your turn!

Let’s look back at the ice cubes I froze yesterday in the picture above. I’ve now written about a lot of things I see when I look at them. What else do you see? Do you think it’s interesting to use with kids, for example? I’ve used those experiments with first year university students, too, I think there is plenty to observe and explain here!

Stuff you can (and should!) observe in your kitchen: circulation in the water when boiling eggs

Now that I have introduced the new tag “kitchen oceanography: food related” to my blog, it’s time to add a couple new posts to that category. And today I have a fun post for you!

But first, what does “kitchen oceanography” even mean?

Kitchen oceanography

/ˈkɪtʃɪn ˌəʊʃəˈnɒɡrəfi/
noun

The benefits of “kitchen oceanography”

It’s pretty apparent why “kitchen oceanography” is a great alternative to regular tank experiments: because you can do it with stuff you have at home rather than needing access to a lab with a tank, and then a lot of water, salt, dye, other resources to conduct the experiments. Doing kitchen oceanography, we use a minimal amount of resources.

But the second, even larger benefit to me is that you can do these kinds of experiments and observations basically everywhere and at any time. So you can fit in a quick session of kitchen oceanography while sitting in front of the fire place on a skiing trip with friends, or while doing the dishes with your godchild. And you can inspire others who might not have access to labs to still do cool oceanography experiments, at home or wherever they like!

Kids who have cooked with their parents are more likely to be interested in STEM

Apparently, the biggest predictor of future interest in STEM topics is whether people as kids often cooked with their parents! No literature source for this, but that’s what my educational research colleagues next door told me… So playing in the kitchen, whether on kitchen oceanography or with food, is a good thing!

It’s not like watching paint dry: Observing boiling eggs

Observing boiling eggs might not sound like a super exciting activity to engage in, but sometimes it is. Last year we did observe interesting foam pattern when boiling eggs (I still can’t explain where the foam is coming from! Can you?).

Foam pattern in a pot of boiling eggs

Foam pattern in a pot of boiling eggs. P.S.: The “black egg” sings different songs to let me know how hard-boiled my eggs are at any given moment. I love this because they are songs I learned from my godson and it always reminds me of him and his family :-)

Foam pattern show circulation within the pot

The pattern in the foam show the convection pattern of the boiling water around the eggs which act as obstacles. Water is raising from the bottom of the pot to its surface, bringing up foam. But the eggs are located so close below the water’s surface that the circulation above them (if there is one) is pretty much disconnected from the convection happening all around the eggs.

But then if you throw out the water…

Limescale deposits at the bottom of an empty pot after boiling eggs in it

Limescale deposits at the bottom of an empty pot after boiling eggs in it

Even the empty pot still shows you what the circulation pattern must have been like!

But then the next cool thing happens when you throw out the water: There are limescale crystals on the bottom of the pot! And, interestingly enough, they show the former locations of the eggs. And I think they are forming in exactly those spots because just as there is (hardly any) circulation above the eggs, the circulation below is also inhibited, water has longer residence time (because it isn’t whipped away by convection) and those crystals can form.

An alternative explanation might be that there is more limescale below the eggs because calcium carbonate gets dissolved from the egg shells and gets deposited as limescale right below the eggs because the concentration is highest closes to the eggs.

Which explanation do you think is more likely? Or do you have another one entirely?

Layered latte: A great real-life example of double-diffusive mixing!

Sometimes sitting in a café for a work meeting with #lieblingskollegin Julia can lead to unexpected discoveries of oceanographic processes — in my latte! It’s those little things that inspire blog posts…

“Kitchen oceanography” brings the ocean to your house or class room!

Oceanography is often taught in a highly theoretical way without much reference to students’ real life experience. Of course a sound theoretical basis is needed to understand the complexity of the climate system, but sometimes a little “kitchen oceanography” — doing experiments on oceanographic topics with household items — goes a long way to raise interest in the kind of processes that are not easily observed in the real world. I’ve previously written a lot about simple experiments you can perform just using plastic cups, water, ice cubes, and a little salt. But sometimes it’s even easier: Sometimes your oceanography is being served to you in a cafe!

Oceanic processes can be observed in your coffee!

Have you ever looked at your latte and been fascinated by what is going on in there? Many times you don’t just see a homogenous color, but sometimes you see convection cells and sometimes even layers, like in the picture below.

Layers in a latte.

Layers in a latte.

But do you have any ideas why sometimes your latte looks like this and other times it doesn’t?

When you prepare latte in the right way, many layers form

Layers forming in latte (and in the ocean or in engineering applications) are an active research field! In the article “laboratory layered latte” by Xue et al. (2017), the authors describe that the “injection velocity” of espresso into the warm milk has to be above a critical value in order for these pretty structures to form in a latte. They even provide a movie where you can watch the layers develop over a period of several minutes.

The homogeneous layers with sharp boundaries are caused by double-diffusive mixing

Double-diffusive mixing, which is causing the formation of these layers, is the coolest process in oceanography. In a nutshell, double diffusive mixing is caused by two properties influencing density having different rates of molecular diffusion. These different rates can change density in unexpected ways and an initially stable stratification (high density at the bottom, low density on top) can, over time, become statically unstable. And static instability leads to adjustment processes, where water parcels move in order to reach the position in the fluid where they are statically stable — the fluid mixes.

Layers in half a glass of latte.

Layers in half a glass of latte.

But there are more fascinating things going on with the latte. Would you expect this stratification to remain as clearly visible as it is in the picture above even though the glass is now half empty? I did not! And then check out what happens when you move the glass: Internal waves can travel on the boundaries between layers!

You can use this in class to teach about mixing!

Mixing in the ocean is mostly observed by properties changing over time or in space, and even though (dye) tracer release experiments exist, they are typically happening on scales that provide information on the large-scale effects of mixing and not so much on the mixing itself. And they are difficult to bring inside the classroom! But this is where kitchen oceanography and experiments on double-diffusive mixing come in. If you need inspiration on how to do that, I’ve recently published an article on this (unfortunately only in German), but there are plenty of resources on this blog, too. Or shoot me an email and we’ll talk!

P.S.: Even though the coffee company is displayed prominently in the pictures above, they did not pay for my coffee (or anything else). But if they’d be interested and make me a good offer, I’d definitely write up some fun stuff on learning oceanography with coffee for them ;-)

Experiment: Double-diffusive mixing (salt fingering)

On the coolest process in oceanography.

My favorite oceanographic process, as all of my students and many of my acquaintances know, is double-diffusive mixing. Look at how awesome it is:

Double-diffusive mixing happens because heat and salt’s molecular diffusion are very different: Heat diffuses about a factor 100 faster than salt. This can lead to curious phenomena: Bodies of water with a stable stratification in density will start to mix much more efficiently than one would have thought.

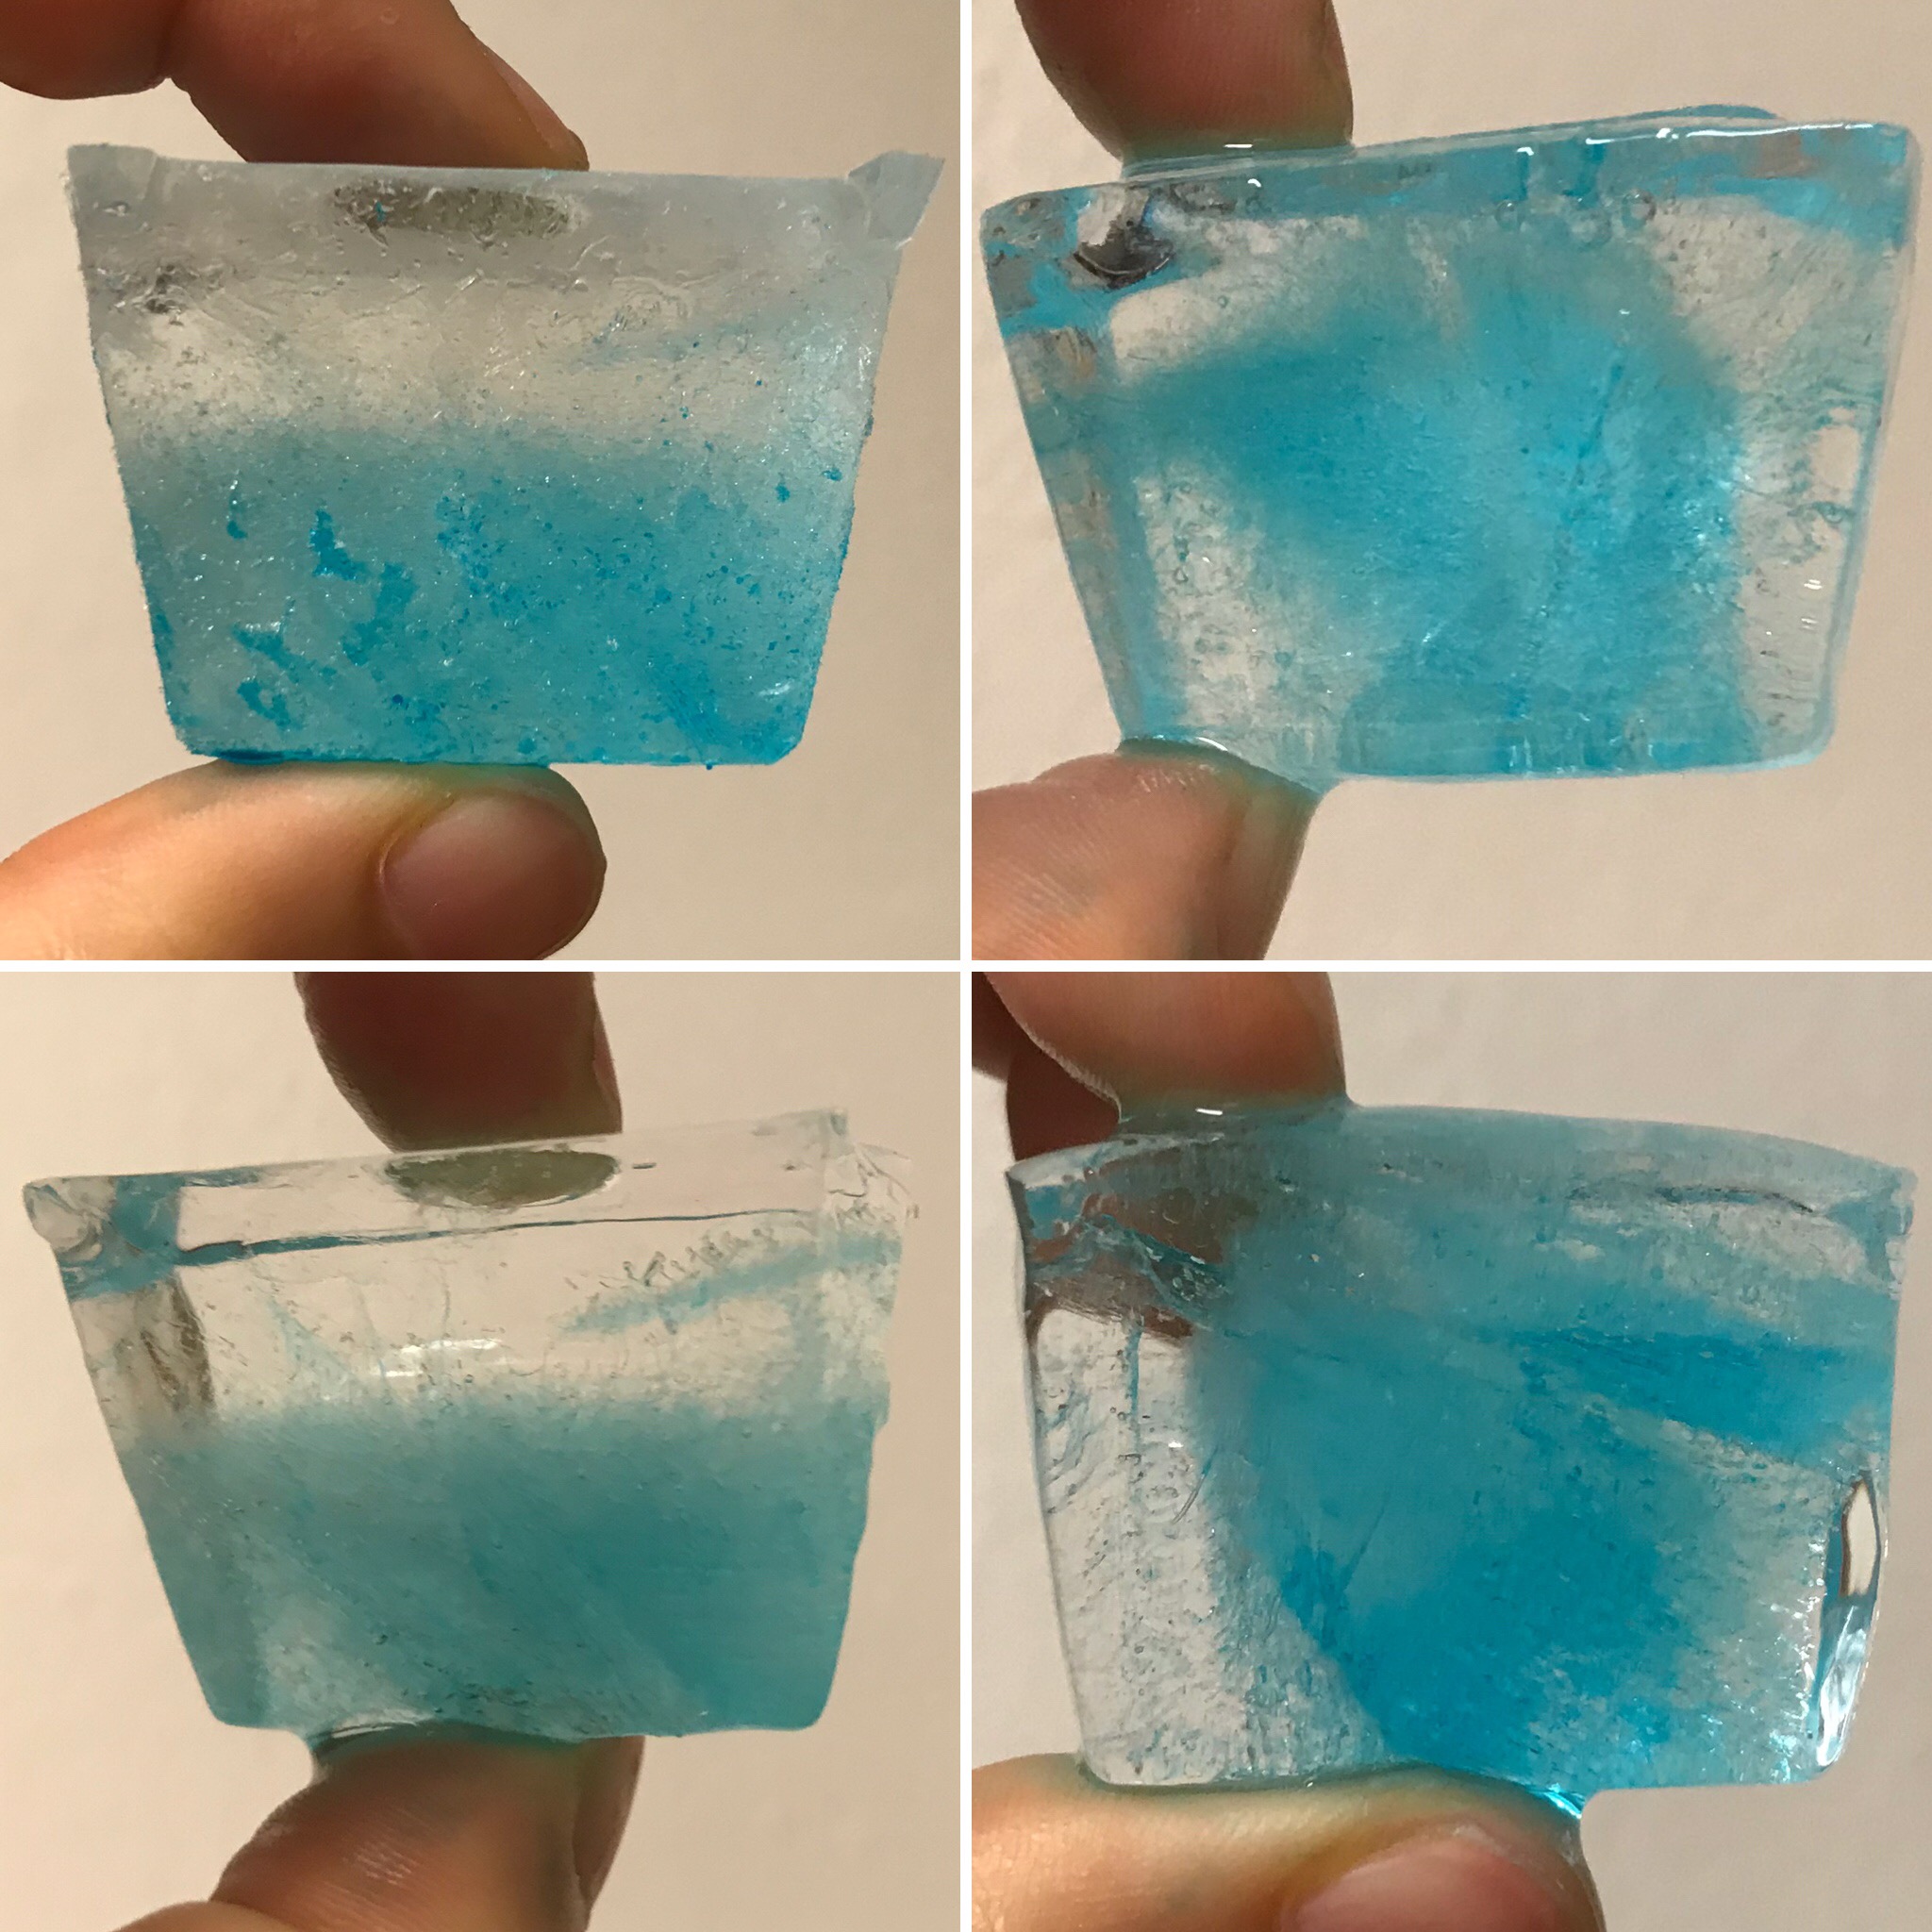
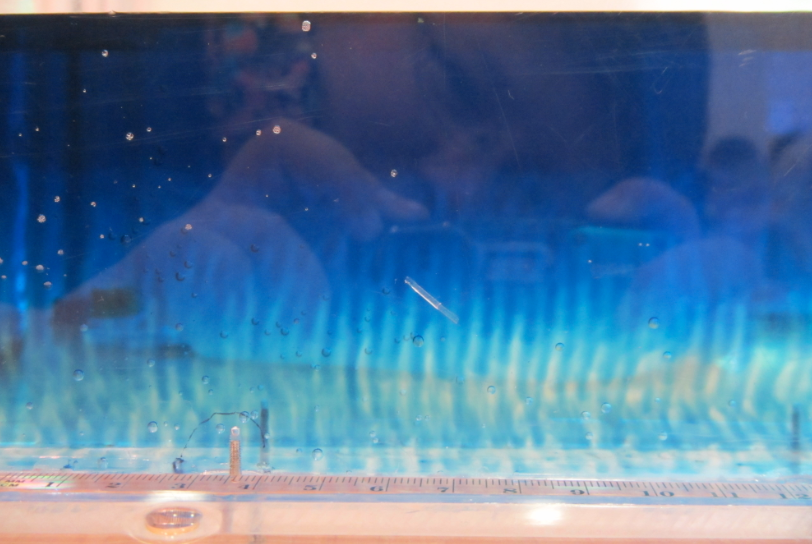
In the specific case of a stable density stratification with warm, salty water over cold, fresh water, finger-like structures form. Those structures are called “salt fingers”, the process is “salt fingering”.

IMG_4233_sehr_klein

Salt fingering occuring with the red food dye acting as “salt”.

Even though salt fingers are tiny compared to the dimensions of the ocean, they still have a measurable effect on the oceanic stratification in the form of large-scale layers and stair cases, and not only the stratification in temperature and salinity, but also on nutrient availability in the subtropical gyres, for example, or on CO2 drawdown.

Over the next couple of posts, I will focus on double diffusive mixing, but less on the science and more on how it can be used in teaching. (If you want to know more about the science, there are tons of interesting papers around, for example my very first paper)

How to easily set up the stratification for the salt fingering process.

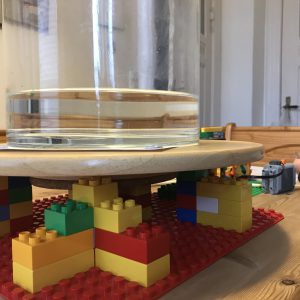
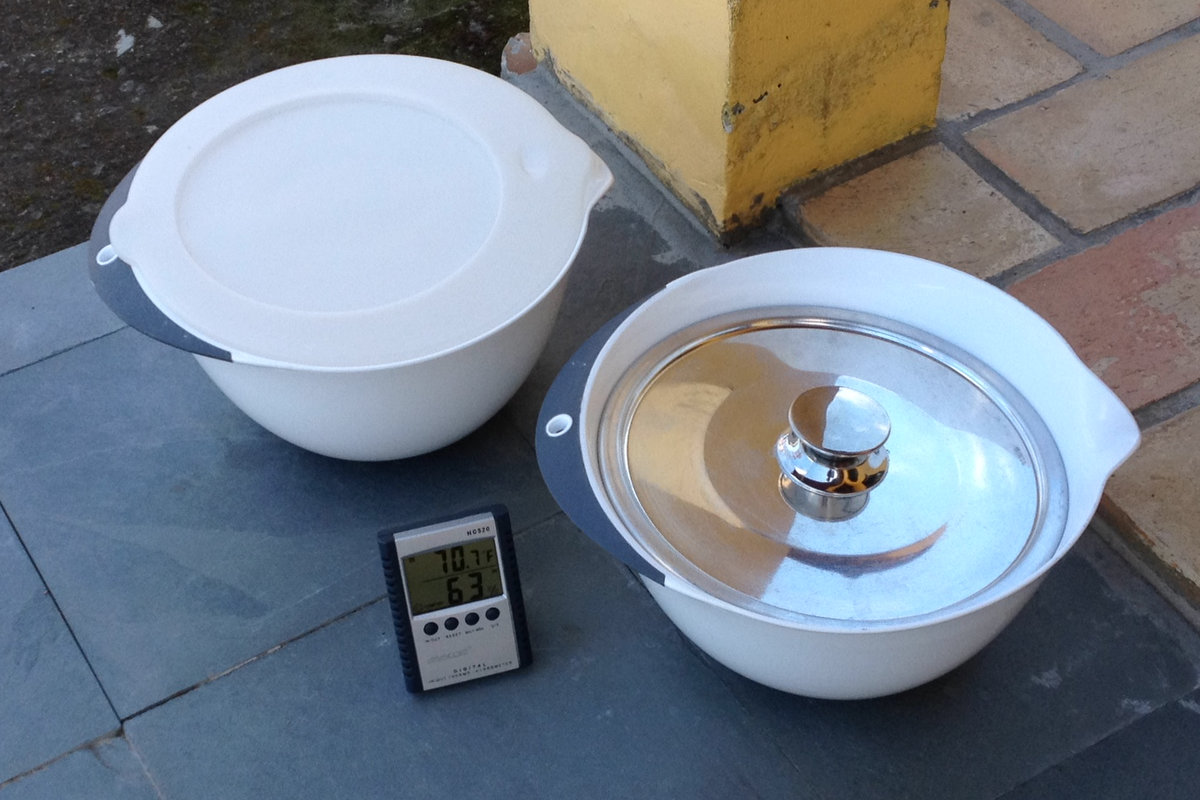
Setting up stratifications in tanks is a pain. Of course there are sophisticated methods, but when you want to just quickly set something up in class (or in your own kitchen) you don’t necessarily want to go through the whole hassle of a proper lab setup.

For double diffusive mixing, there are several methods out there that people routinely use.

For example the hose-and-funnel technique, where the less dense fluid is filled in the tank first and then the denser fluid is slid underneath with the help of a hose and a funnel. And a diffuser at the end of the hose. And careful pouring. And usually a lot more mixing than desired.

Or the plastic-wrap-to-prevent-mixing technique, where the dense fluid is put into the tank, covered by plastic wrap, and then the lighter fluid is poured on top. Then the plastic wrap is removed and by doing so the stratification is being destroyed. (No video because I was frustrated and deleted it right away)

Or some other techniques that I tried and didn’t find too impressive. (No videos either for the same reason as above)

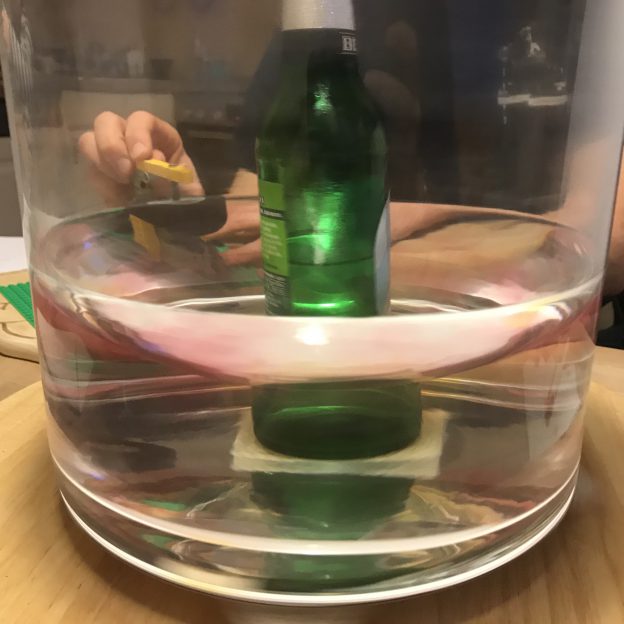
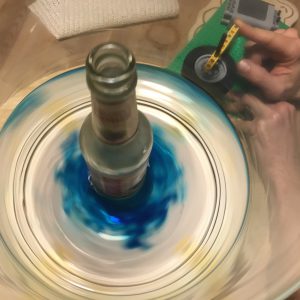
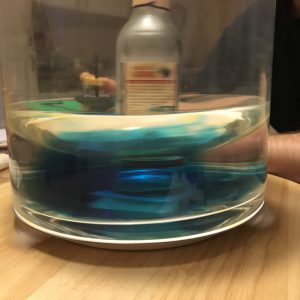
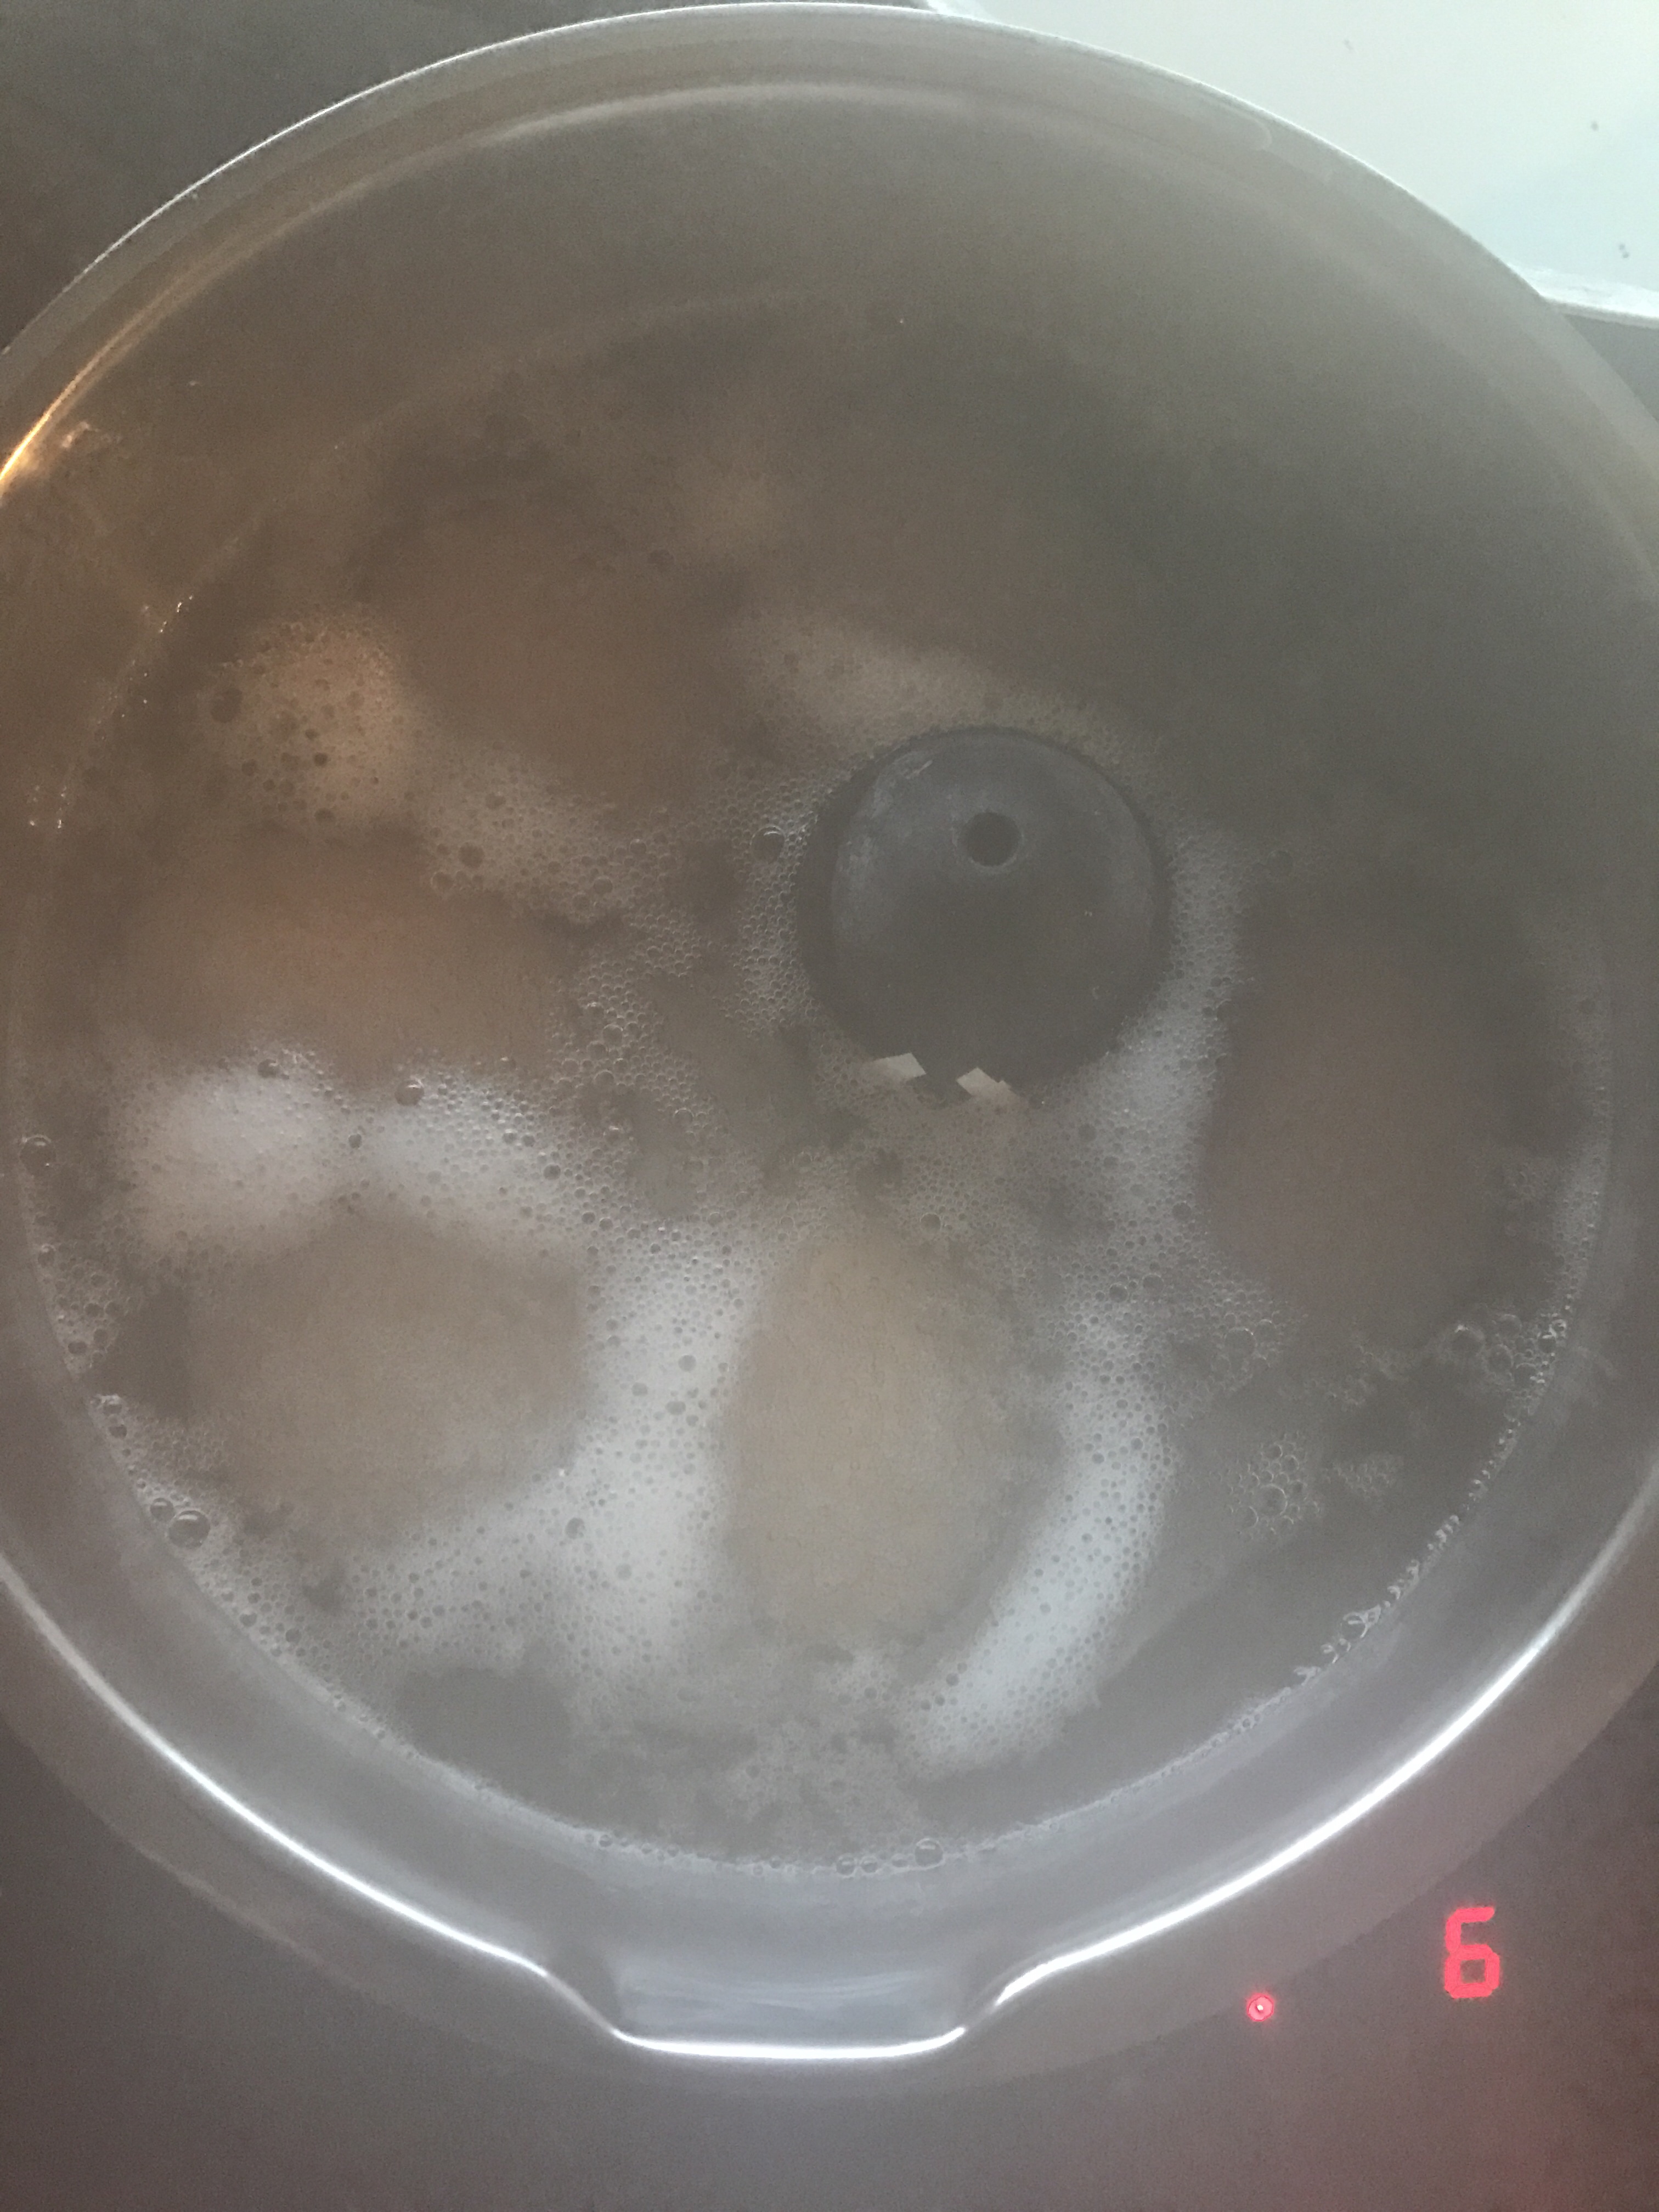
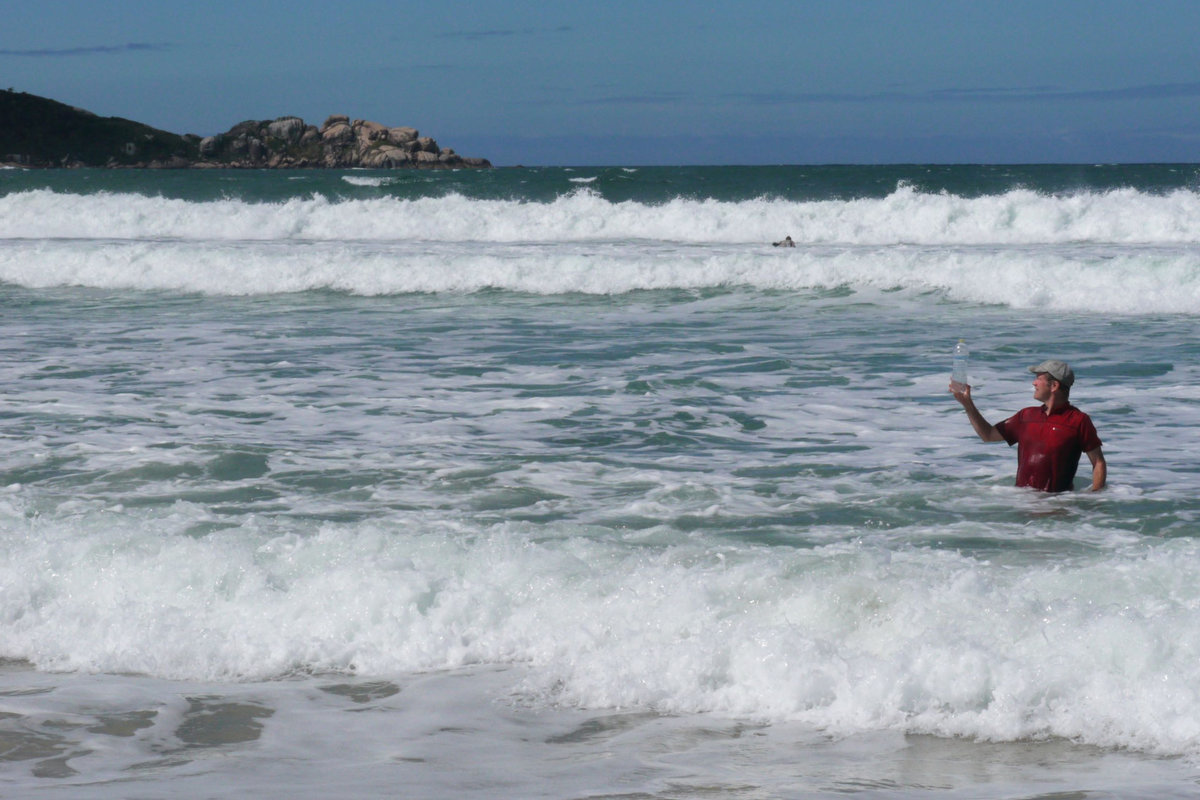
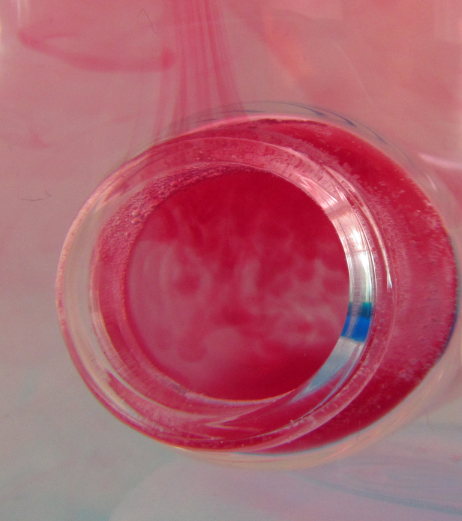
But then accidentally I came across this method (as in: I wanted to show something completely different, but then I saw the salt fingers and was hooked):

Granted, this is not a realistic model of an oceanic stratification. But as you can see towards the end of that movie, that turns out to be a blessing in disguise if you want to talk about the process in detail. As you see in the movie, the salt fingers inside the bottle are much smaller than the salt fingers outside the bottle. Because, clearly, inside the bottle the warm water is cooled both at the interface with the cold water inside the bottle, and by heat conduction through the walls of the bottle, since the water is surrounded by cold water. The warm water that flowed out of the bottle and up towards the water’s surface is only cooled at the interface with the water below (the air above is warmer than the cold water). So this gives you the perfect opportunity to discuss the scaling of salt fingers depending on the stratification without having to go through the pains of actually preparing stratifications with different gradients in temperature or salinity.

IMG_9084

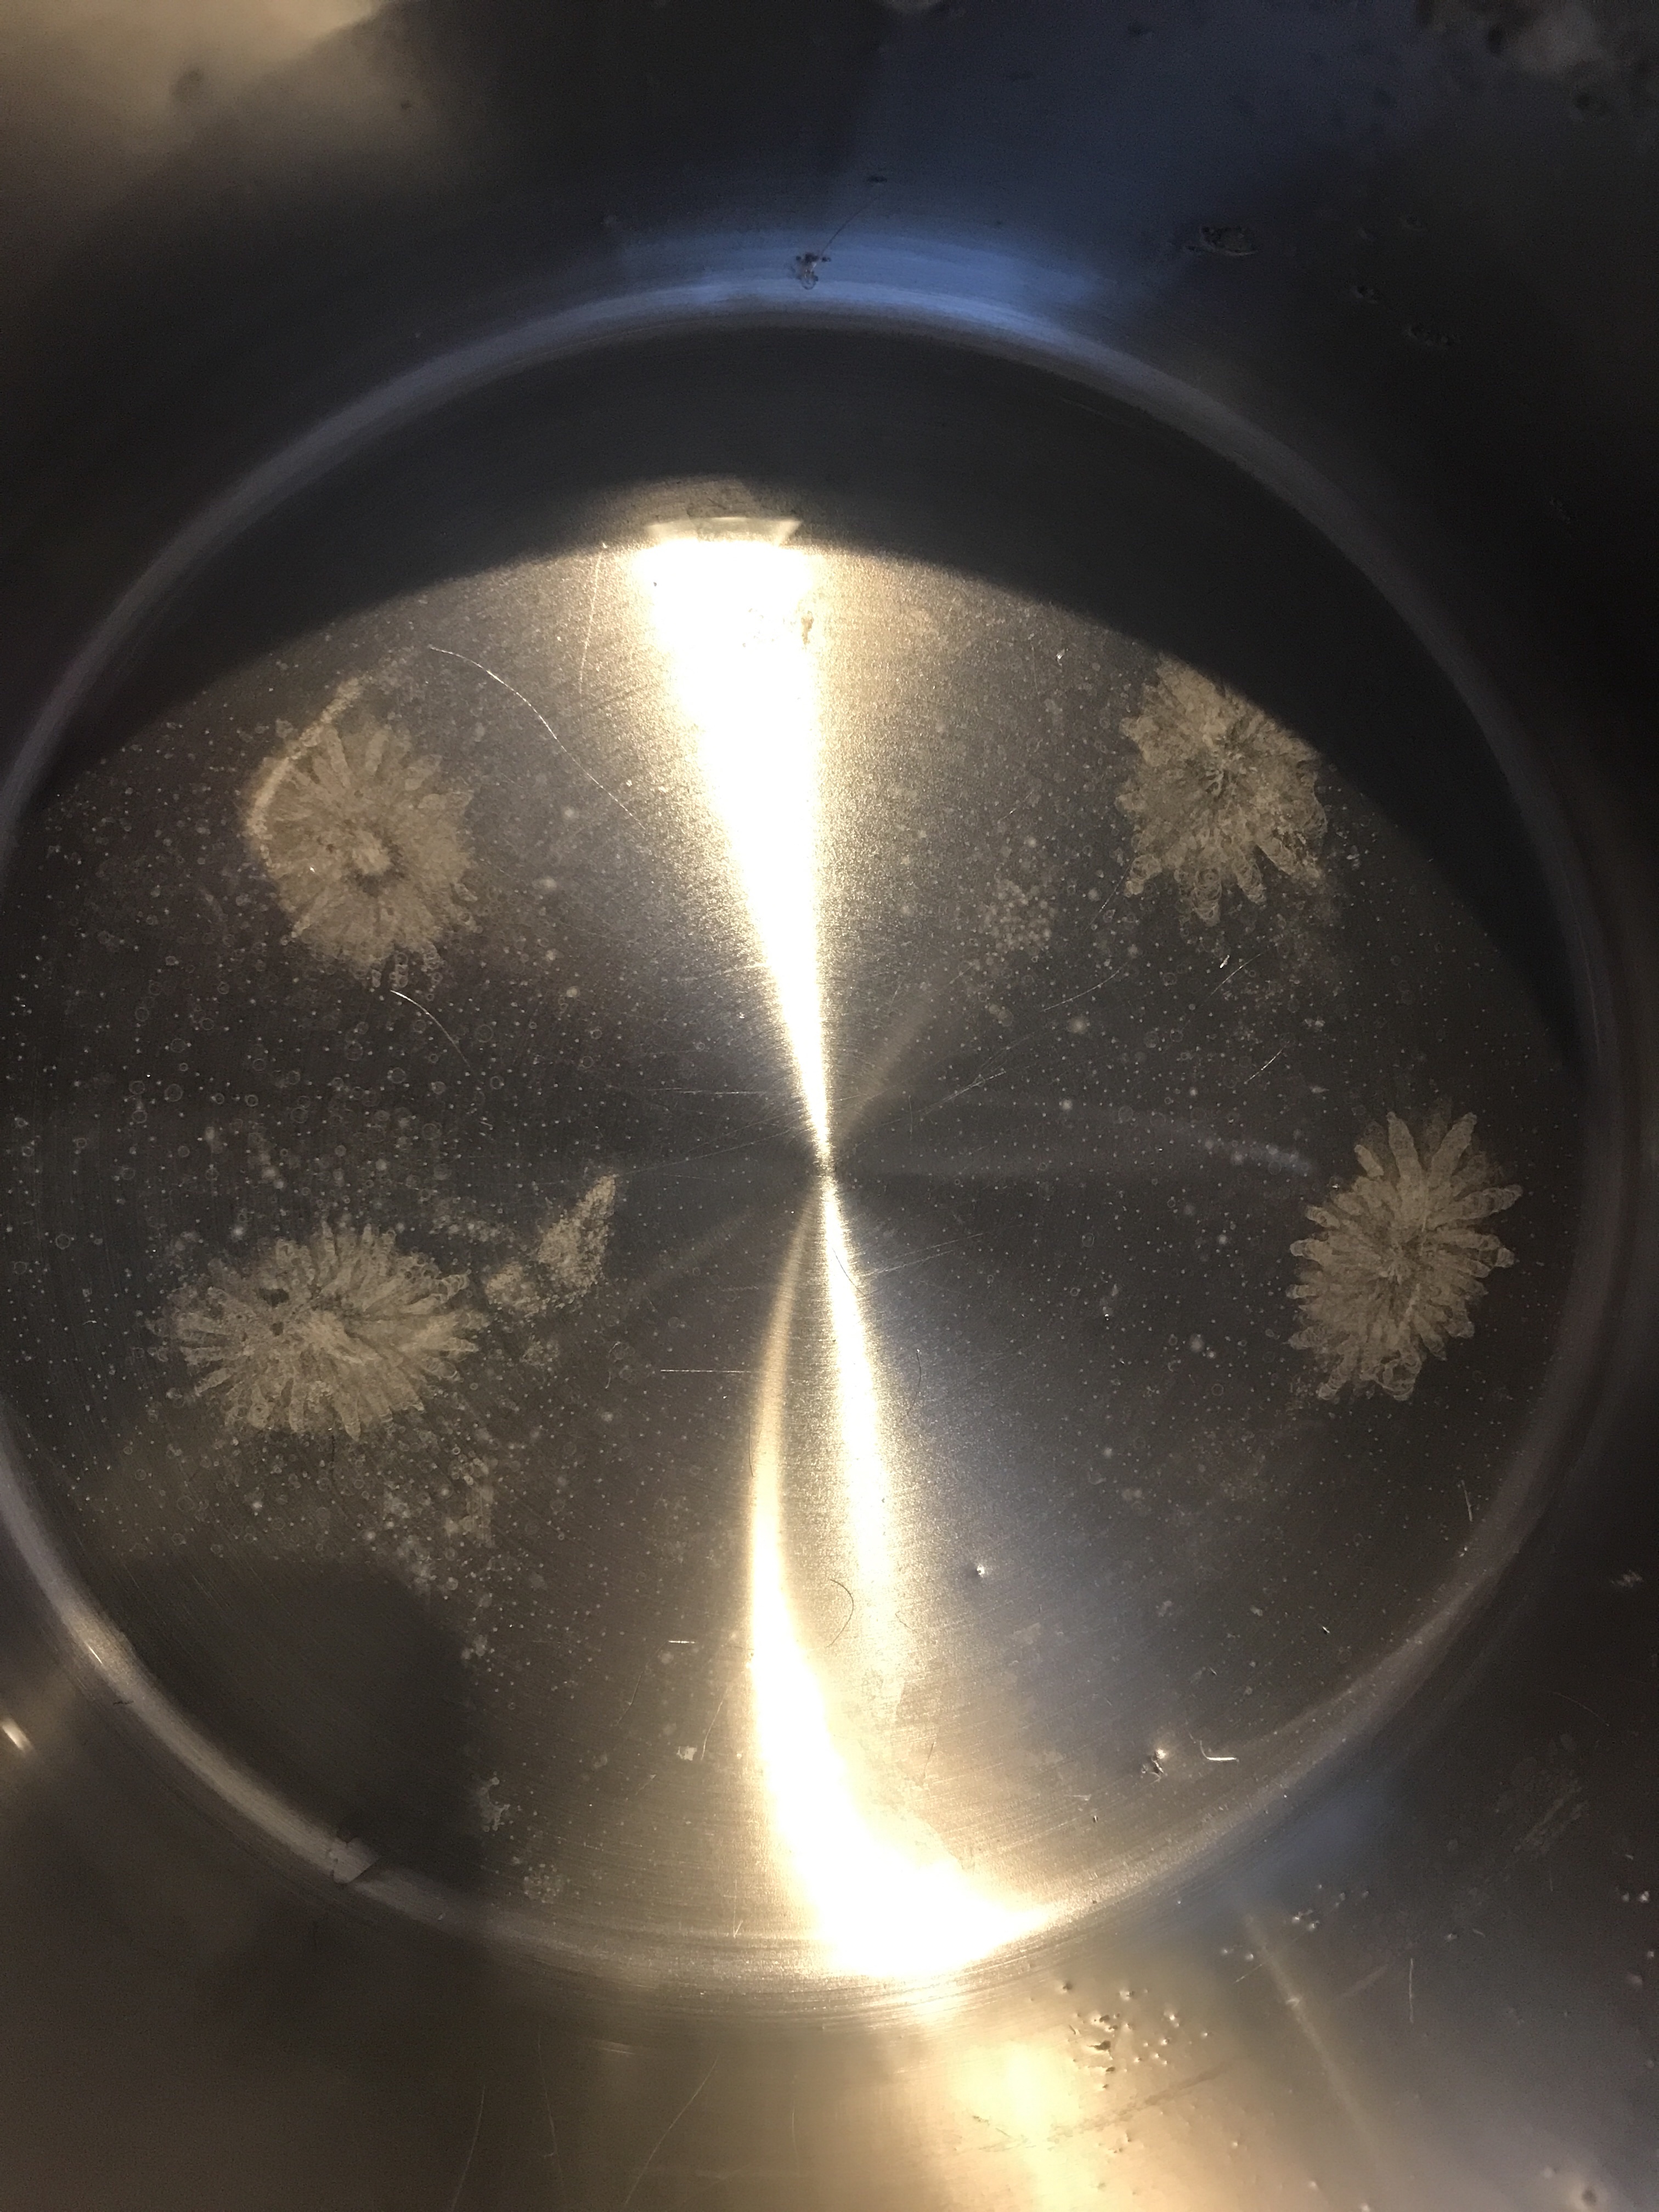
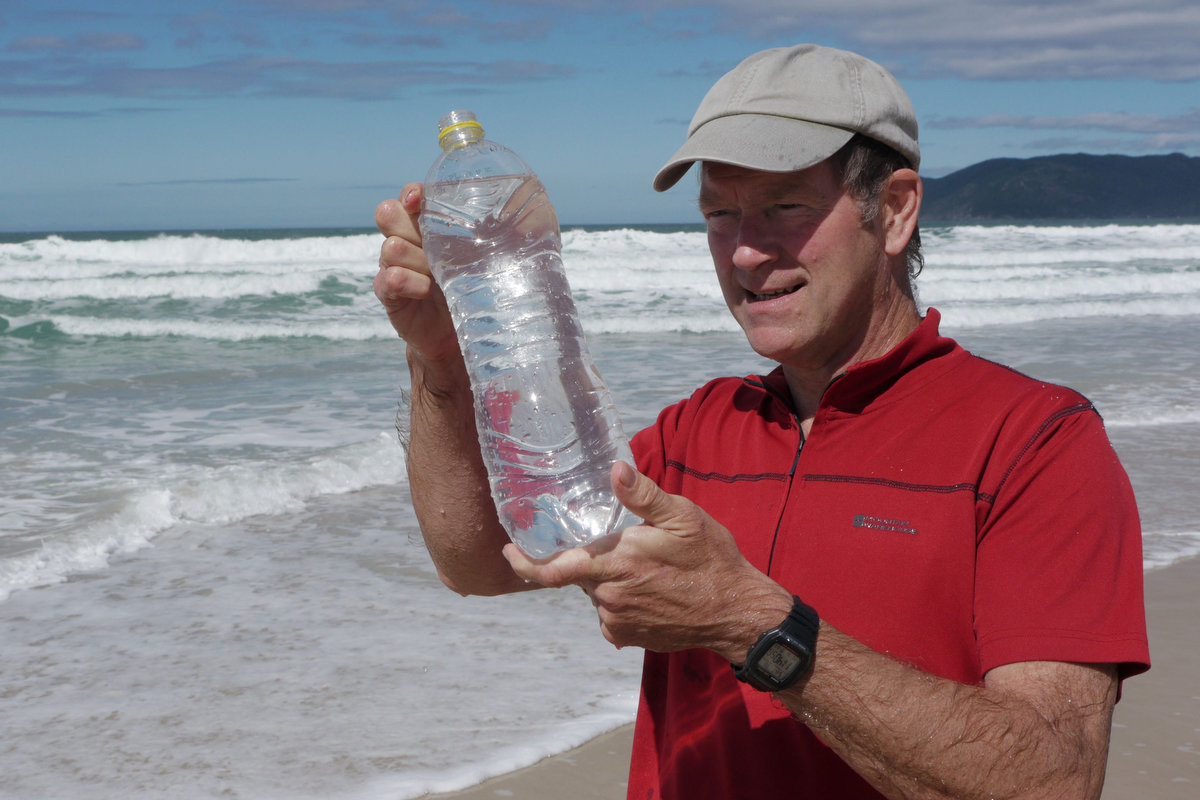
Self-portrait with salt fingers :-)

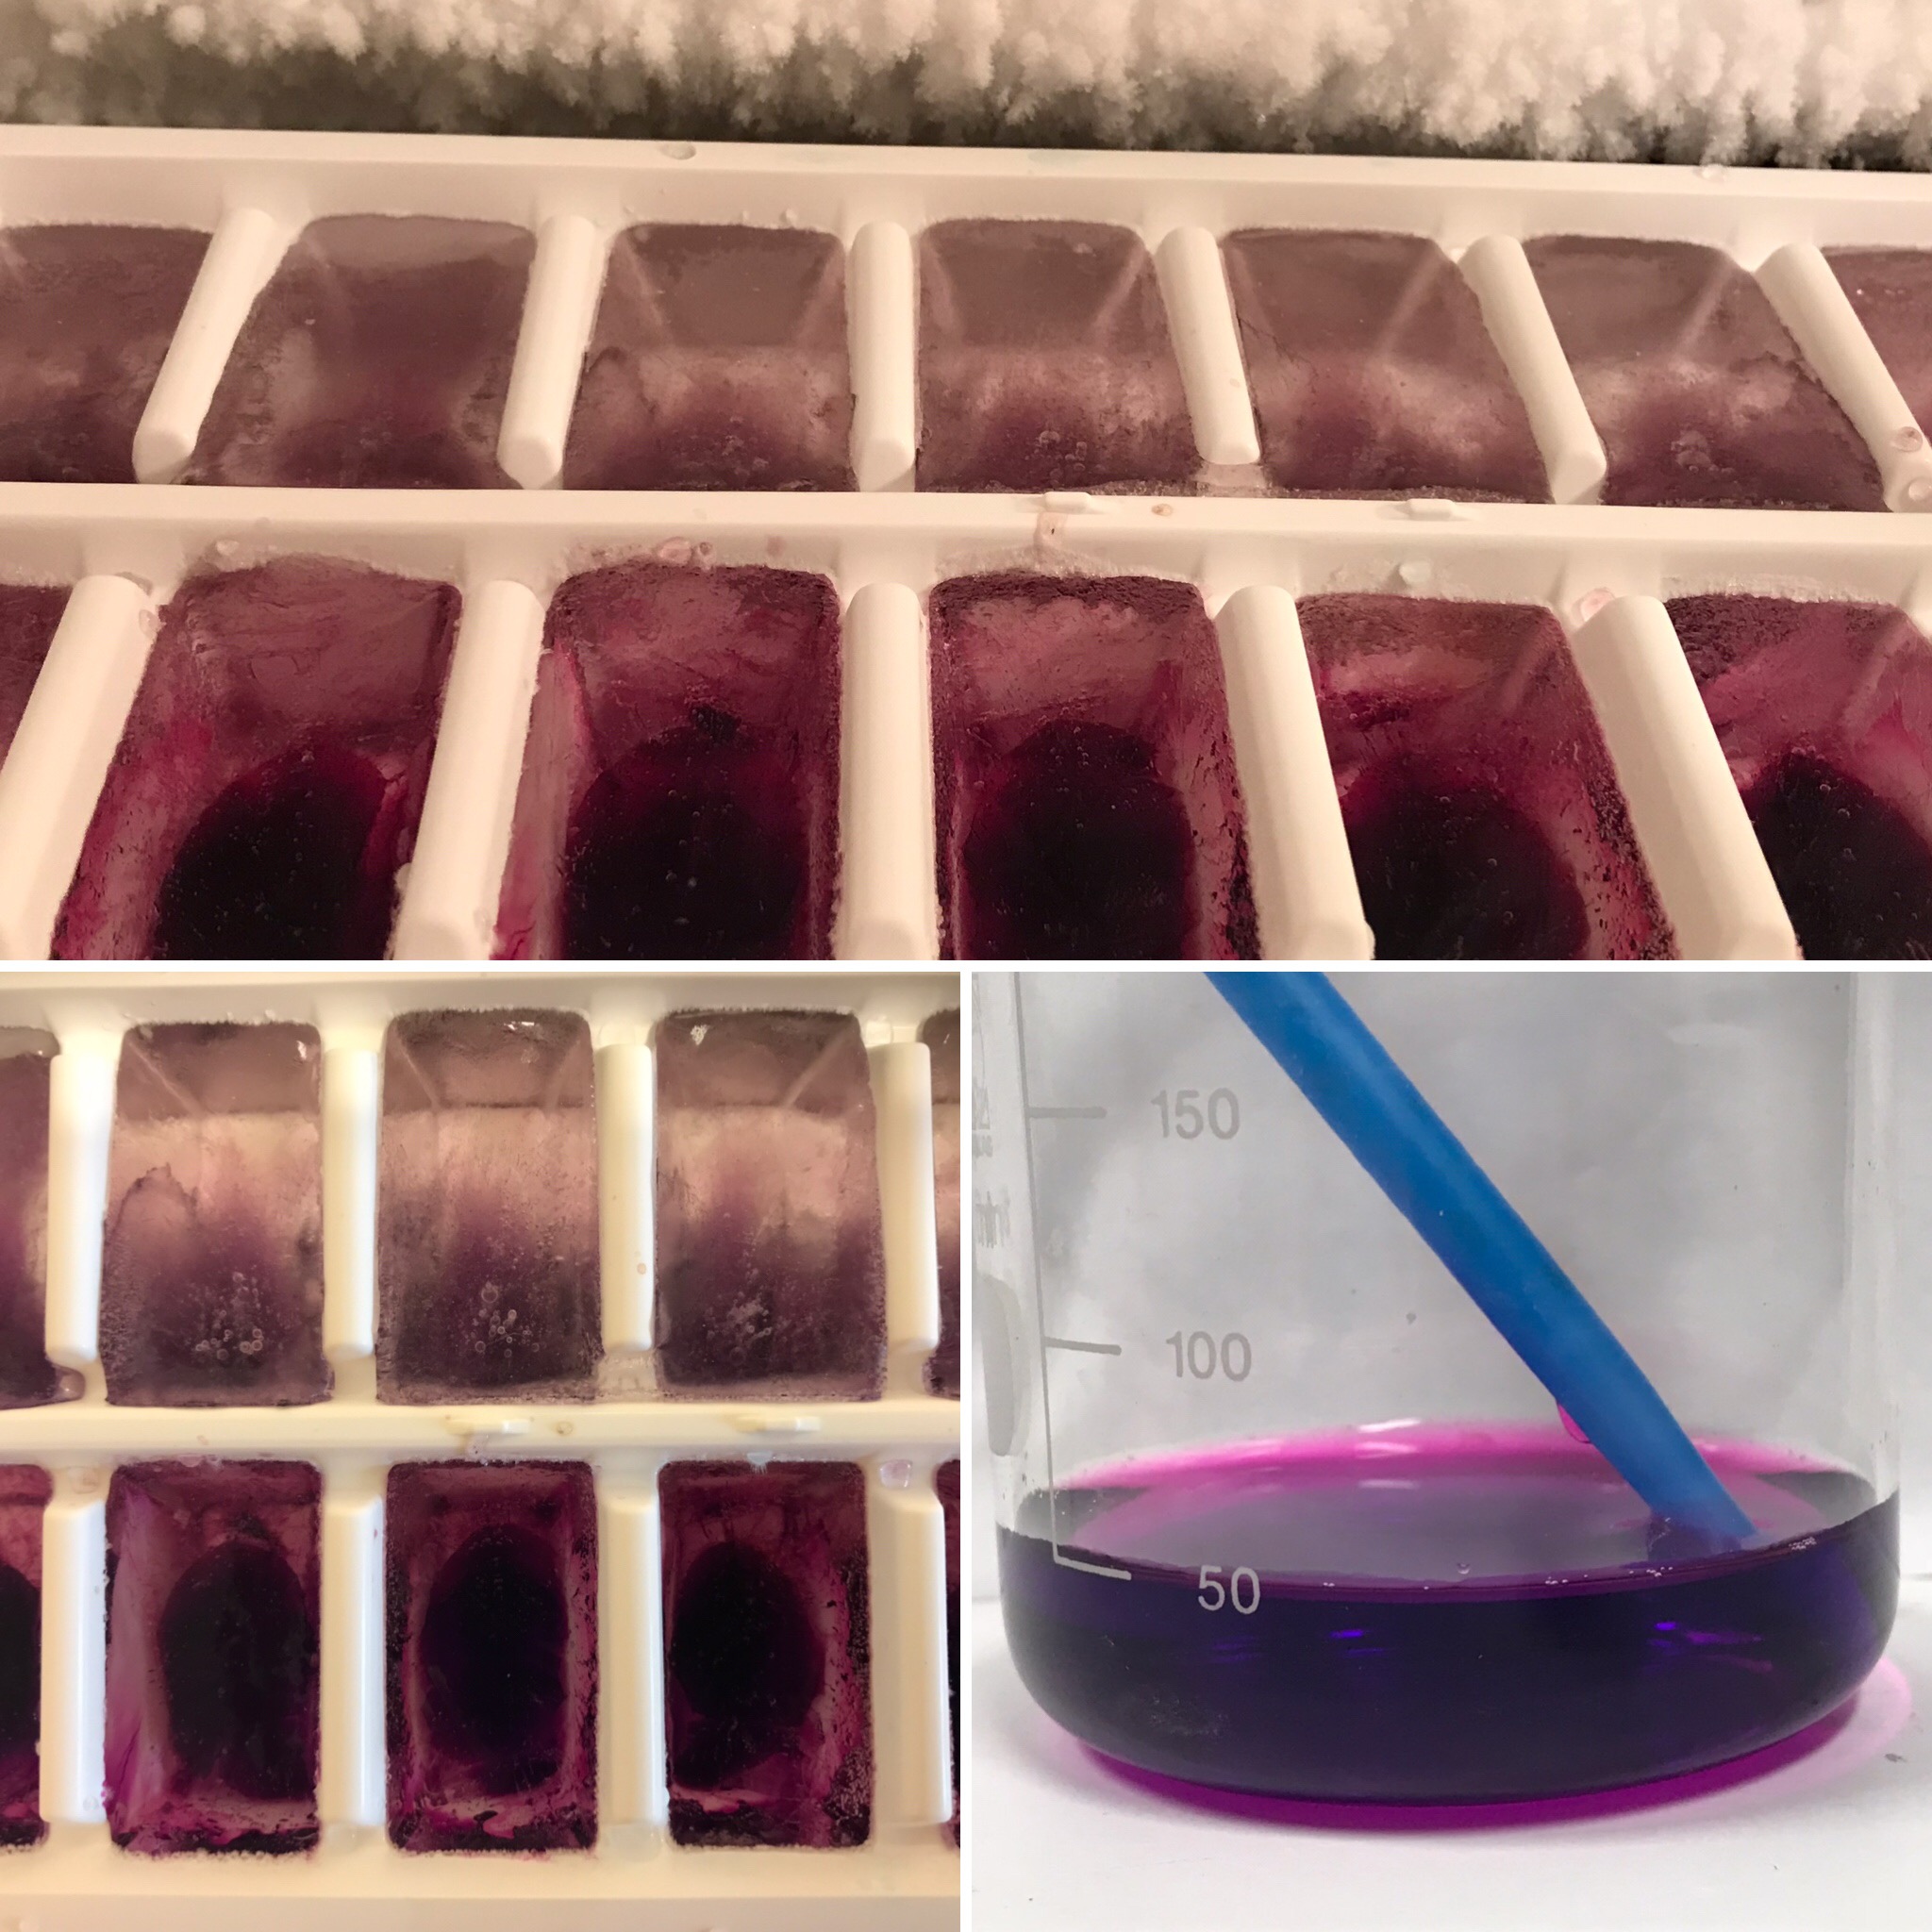
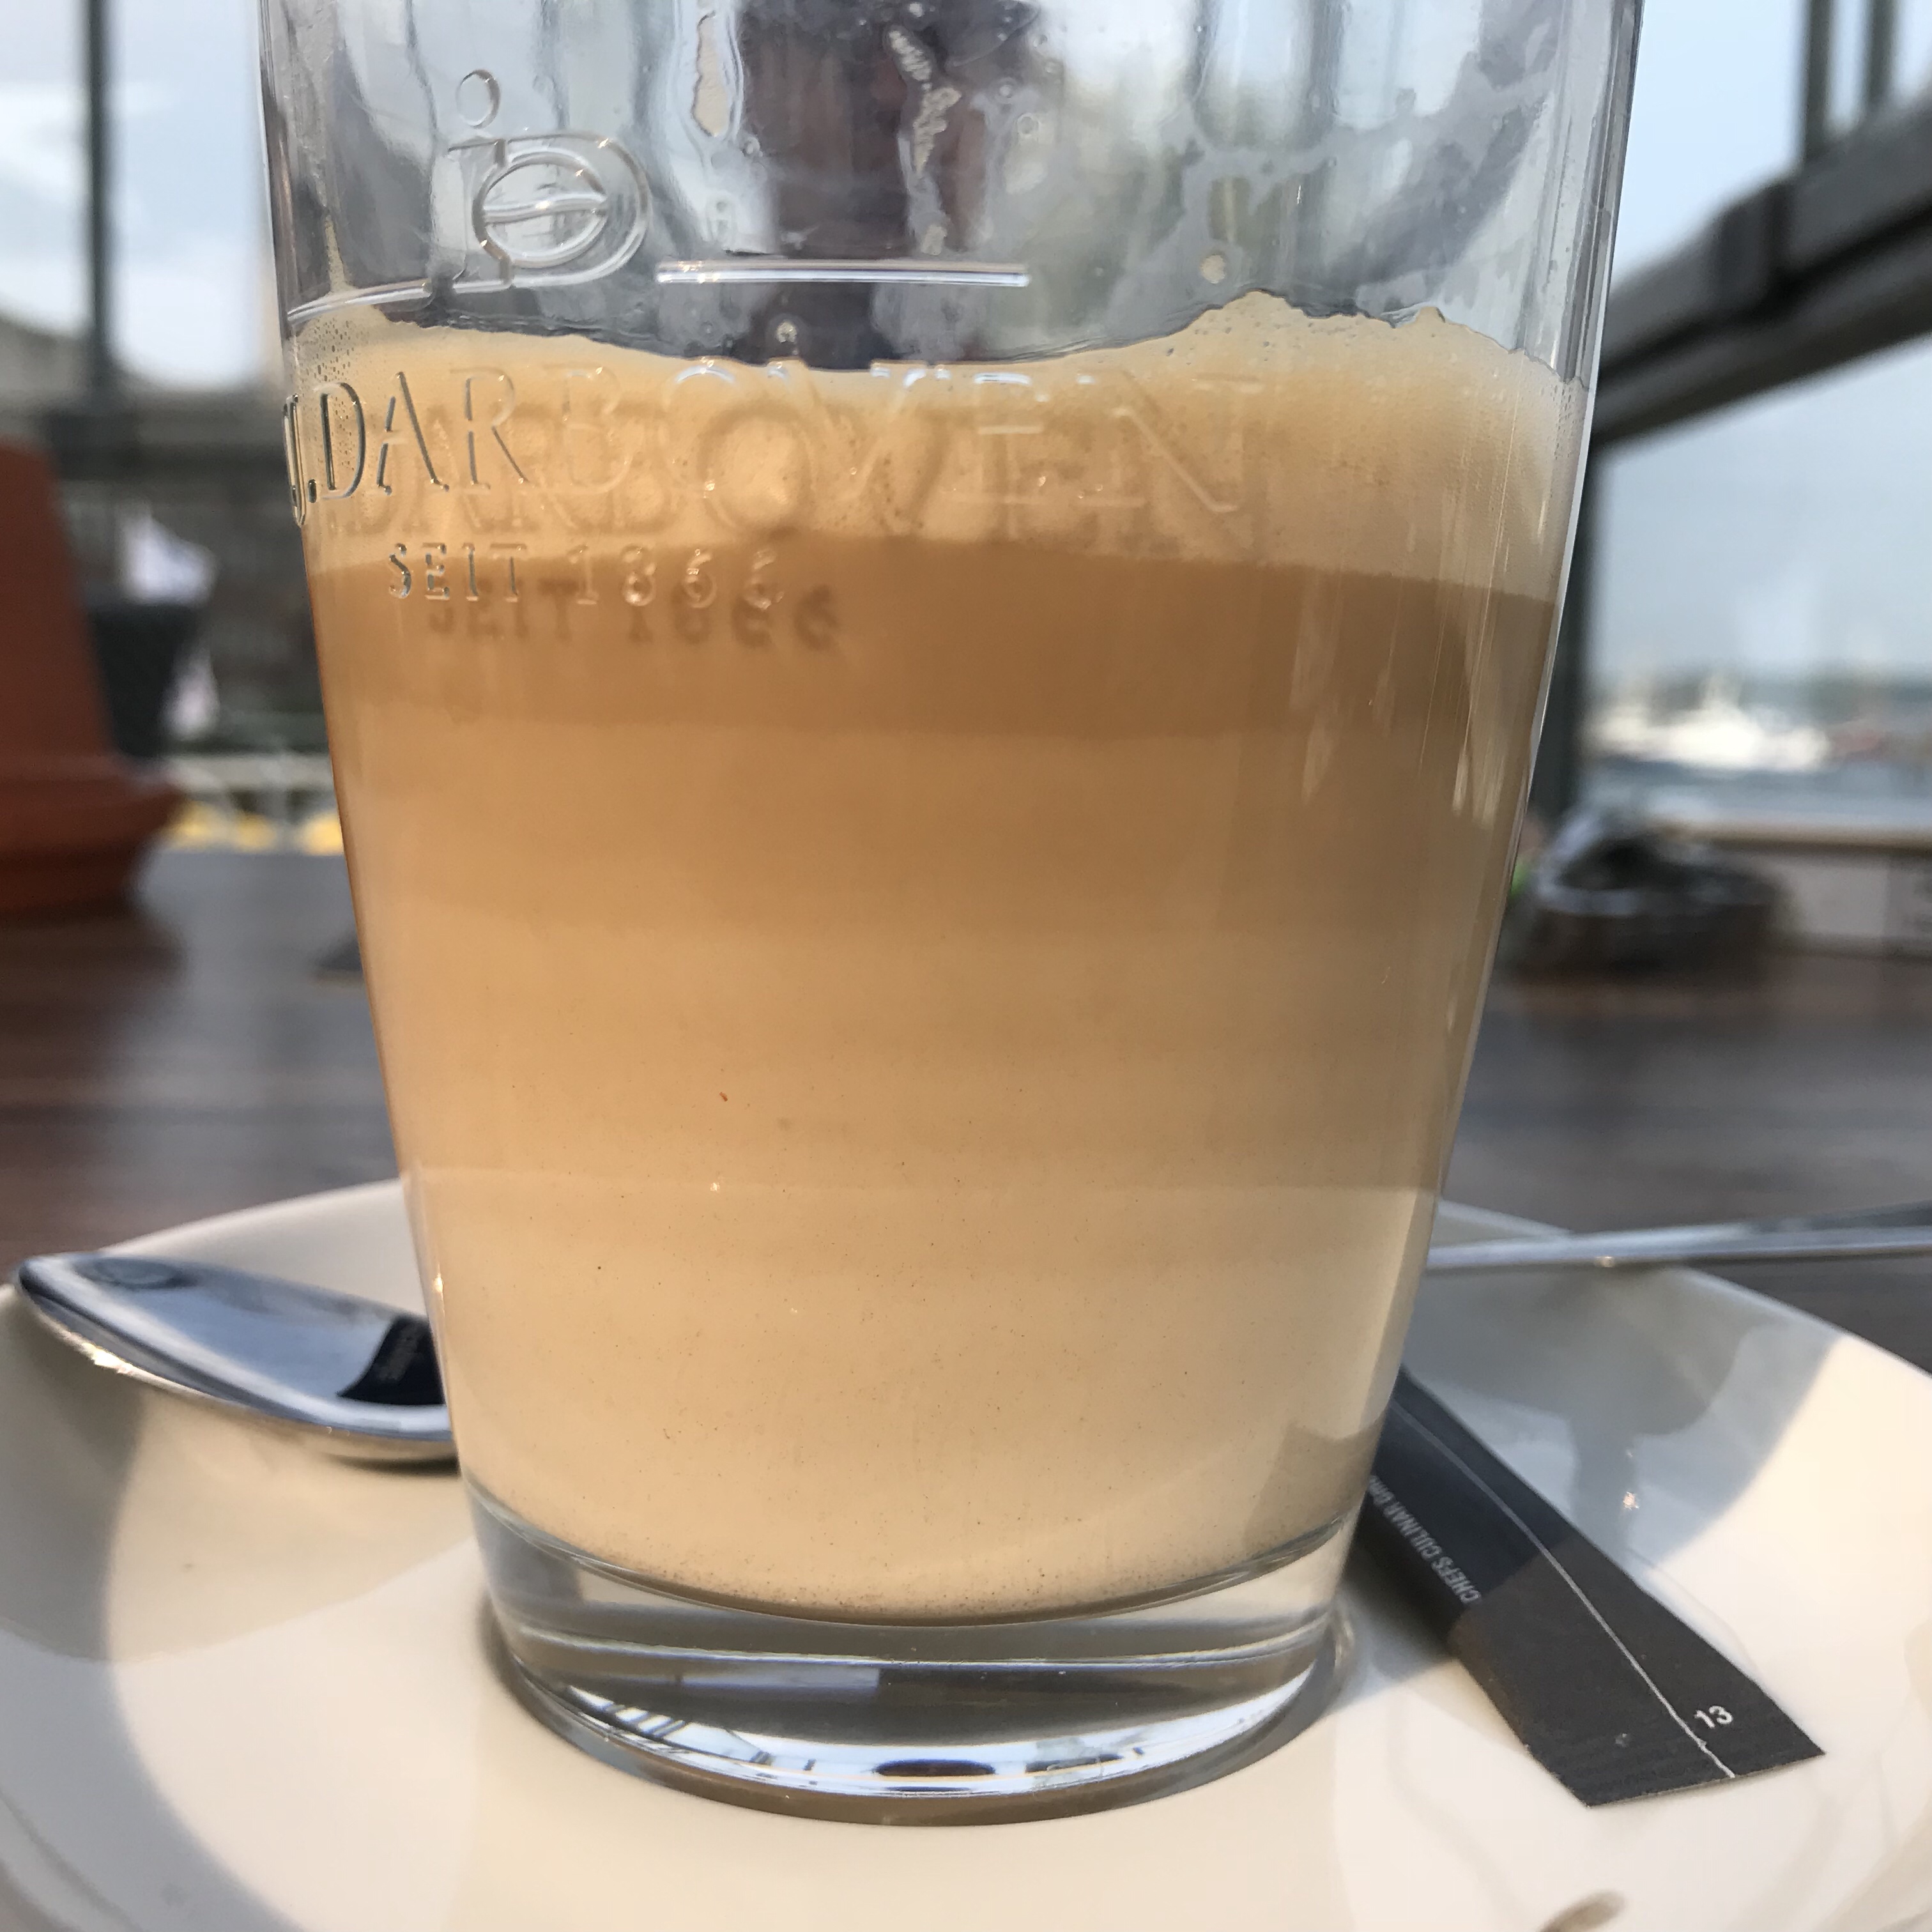
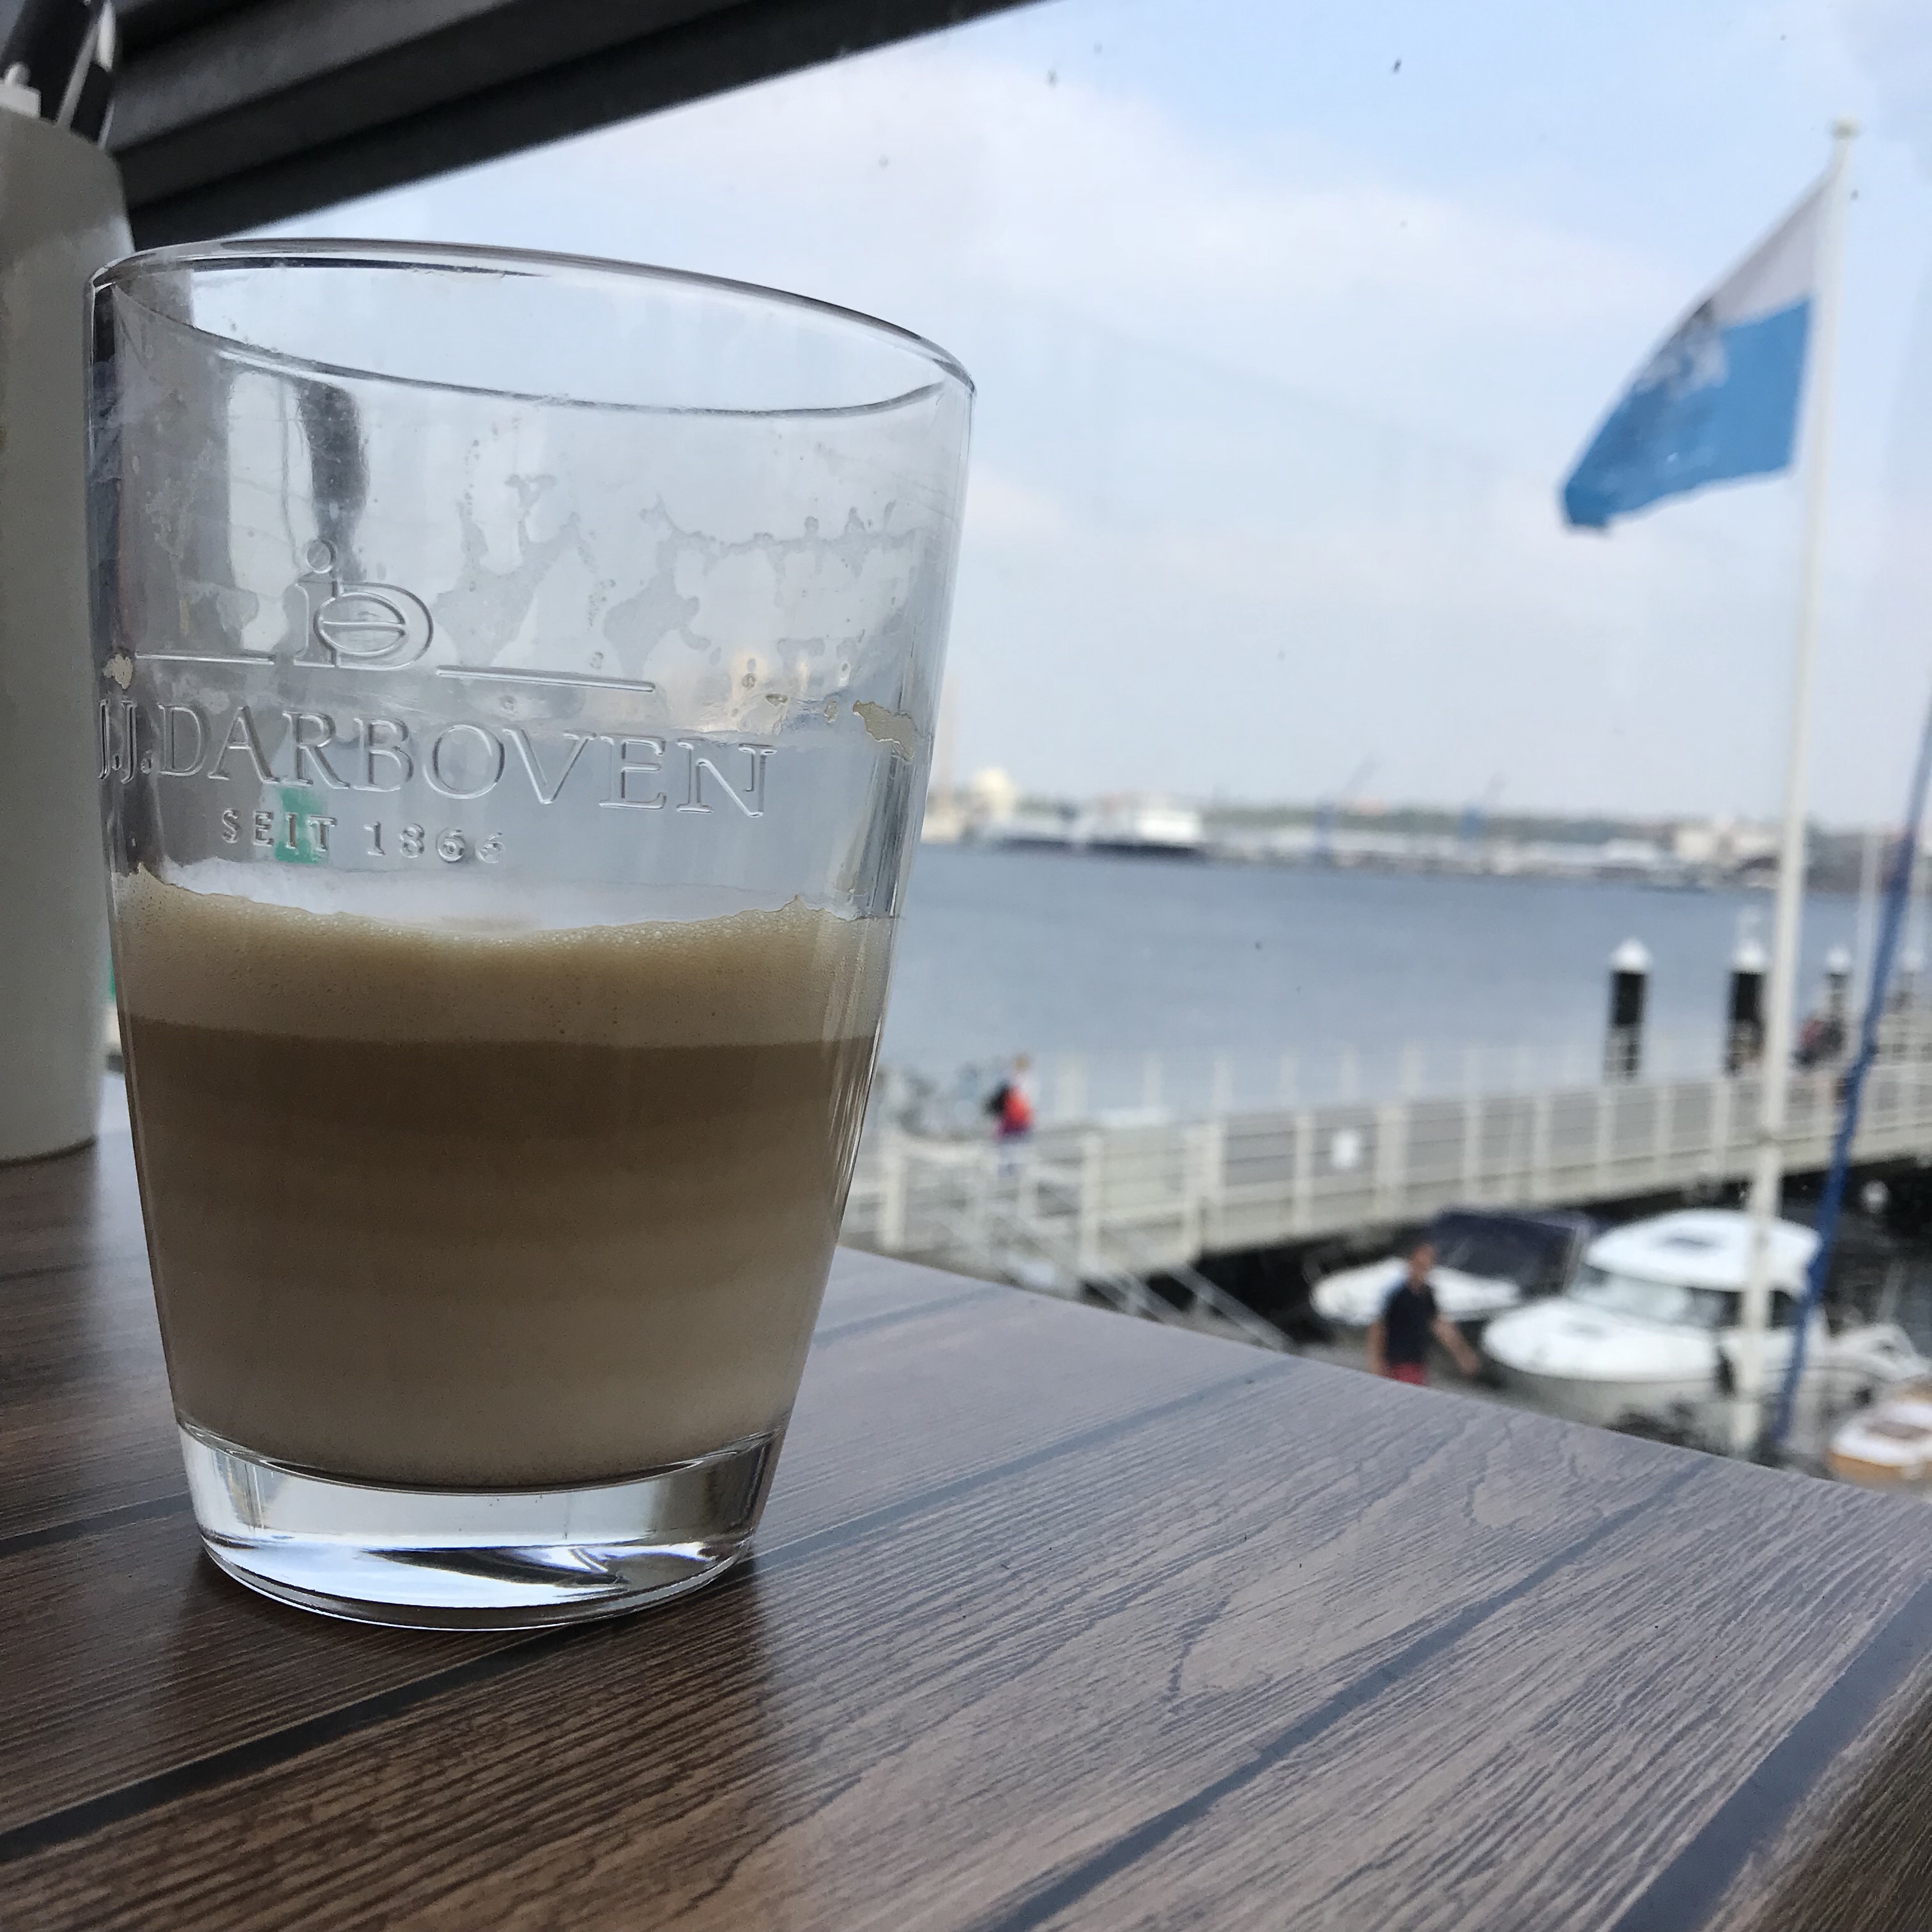
In my experience, the best salt fingers happen when you use hot water with dye (as the warm and salty top layer) and cold fresh water below. Salt fingers develop quickly, you don’t have the hassle of hitting the exact temperatures or salinities to make the density stratification statically stable, yet unstable in salinity, and it ALWAYS works.


IMG_9079

Double-diffusive mixing. Scale at the bottom is centimeters.


IMG_9054

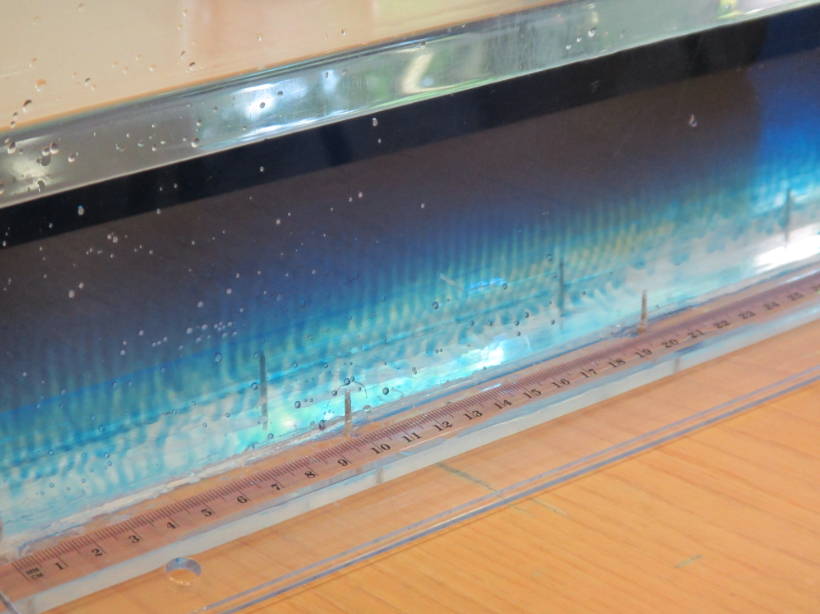
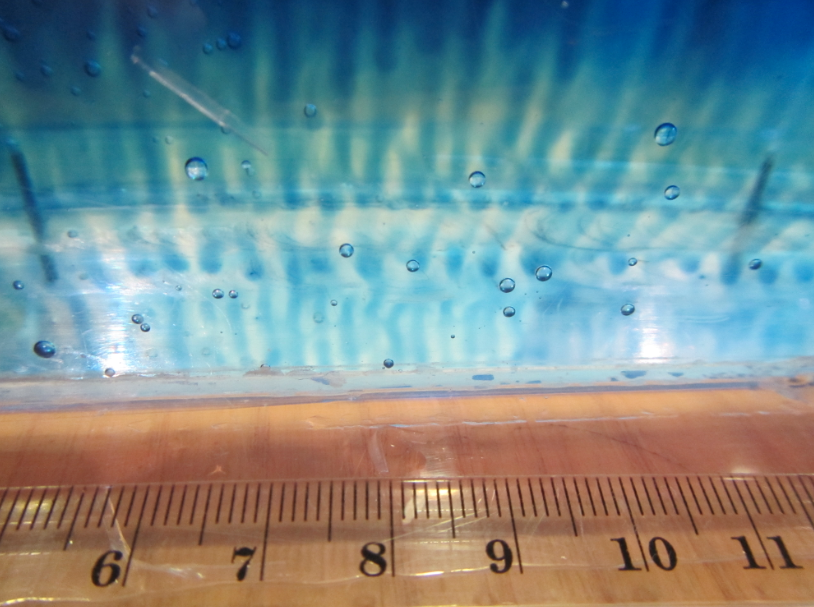
Salt fingering in a tank. Scale at the bottom is centimeters.

And look at how beautiful it looks! Do you understand why I LOVE double diffusion?

P.S.: This text originally appeared on my website as a page. Due to upcoming restructuring of this website, I am reposting it as a blog post. This is the original version last modified on November 4th, 2015.

I might write things differently if I was writing them now, but I still like to keep my blog as archive of my thoughts.

Guest post: Using seawater to make bread!

Last week I got one of the coolest emails I have ever received: Someone had found my blog while googling for the salt content of seawater in order to use it to make bread, and he sent me a couple of pictures the resulting bread! Of course, I asked if I could share it as a guest post on my blog, so here we go (Thanks, Martin Haswell, for this unique and inspiring contribution! See, everybody? Real-world impact of science blogging!):

Making bread using seawater

There is nothing like a challenge from your best friend, to do something that you’ve never done before but might just work. In my case, make bread using sea water.

My friend Mandy had brought me back from New York a copy of Jim Lahey’s book “My Bread”. Jim’s ‘no-knead’ method of bread making uses flour, water, salt (normally) and a tiny amount of yeast – and a lot of time, but no kneading. The dough is left for a long time to rise and is baked very very hot, and makes a tasty and crusty loaf.

Jim has a recipe in his book called  “Jones Beach Bread” in which he uses seawater instead of house water plus salt to make the dough. Knowing that we both used the ‘no-knead’ recipe and that I had access to a beach with clean water, Mandy challenged me to follow this recipe, and this is how it went.

Martin collecting seawater on the beach, far enough out to miss most of the turbidity

Martin collecting seawater on the beach, far enough out to miss most of the turbidity

Martin checking the seawater sample for sand or other impurities

Martin checking the seawater sample for sand or other impurities

Jim Lahey’s book “My Bread” that contains Jim’s 'no-knead' method of bread making used for the bread in this blog post

Jim Lahey’s book “My Bread” that contains Jim’s ‘no-knead’ method of bread making used for the bread in this blog post

Waiting for the bread to raise

Waiting for the bread to raise

The finished result! Doesn't it look delicious?

The finished result! Doesn’t it look delicious?

The bread tasted very good, crusty and tasty. I made two loaves, one with the seawater filtered through a coffee filter and the other with unfiltered seawater. Normally this recipe needs around 12-18 hours rising time but this took 28 hours for the two risings, but it is winter in southern Brasil (Florianópolis, on the coast) and the day temperature was only 72F (22°C) on the day of the experiment. It’s also possible that the greater proportion of salt might have hindered the development of the yeast and held back the rise. This wasn’t a very scientific experiment.

I calculated that Lahey’s original no-knead’ recipe calls for 8g salt to 300g of water which makes 26.66g per litre, whereas sea water (according to Mirjam’s 2013 blog is 35g/litre so this should mean that the sea bread loaf should be around 30% more salty than normal; if I’m honest, it didn’t tasty significantly more salty).

Further experiments: the obvious test would be a sea water loaf vs conventional made, risen and baked at the same time.

Notes:

The Jones Beach in Jim’s recipe is the Jones Beach State Park on Long Island, New York State. The current water cleanliness data is here (PDF), scroll down for the Jones Beach SP results.

The beach that I collected my sea water from is currently ‘própria‘ but I wouldn’t collect after heavy rain (runoff) or heavy seas (turbidity).  As a safety precaution one could boil the sea water and let it cool just enough before using. In fact, when the weather is cold, that would be the best way of giving the bread a good start.

[note by Mirjam: I’ve done a super quick google search and it looks like typical salinities for the Florianopolis area can go down to 30-ish and thus be lower than the typical, open ocean value of 35, but during summer they might go up to 37 (Pereira et al., 2017) but in addition to the seasonal changes, your salinity probably depends very much on which beach you took the water sample at (for example if it was a lagoon-ish beach with a lot of freshwater runoff and not so much mixing with the open ocean). Since you collected the water fairly close to the beach and during winter, it’s likely that the salinity wasn’t quite as high as the 35 I mentioned (which would explain why the bread didn’t taste as salty as you might have expected). If you wanted to know the exact salinity next time you are making bread, an easy method to measure the salinity of sea water would be to boil a liter until all the water has evaporated and weigh the remaining salts. This isn’t very precise for oceanographer-standards, since some of the substances that oceanographers include in their measure of “salinity” in sea water at normal temperatures might actually evaporate with the water, but since the largest constituent of the “salt” in sea water is just normal NaCl, the mistake you’d be making is probably small enough for cooking purposes, and you’d get a general idea of how “typical” your sample is in terms of seawater salinity.]

Bio:

Martin Haswell is an English photographer who loves travel and making bread.

Experiment: Temperature-driven circulation

My favorite experiment. Quick and easy and very impressive way to illustrate the influence of temperature on water densities.

This experiment is great if you want to talk about temperature influencing density. Although it doesn’t actually show anything different from a temperature driven overturning experiment, where circulation is determined by hot water rising and cold water sinking, somehow this experiment is a lot more impressive. Maybe because people are just not used to see bottles pouring out with the water coming out rising rather than plunging down, or maybe because the contrast of the two bottles where one behaves exactly as expected and the other one does not?

Anyway, it is really easy to do. All you need is a big jar and two small bottles. Cold water in one of the small bottles is dyed blue, hot water in the other small bottle is dyed red. Both are inserted in the jar filled with lukewarm water (movie below).

Using bottles with a narrower neck than mouth is helpful if you want to use the opportunity to talk about not only temperature-driven circulation, but also about double-diffusive mixing (which you see in form of salt fingers inside the red bottle in the picture above).

Isn’t this beautiful?

P.S.: This text originally appeared on my website as a page. Due to upcoming restructuring of this website, I am reposting it as a blog post. This is the original version last modified on December 2nd, 2015.

I might write things differently if I was writing them now, but I still like to keep my blog as archive of my thoughts.

Tides themselves don’t induce (a lot of) mixing, only tides hitting topography do. An experiment.

As you might have noticed, the last couple of days I have been super excited to play with the large tanks at GFI in Bergen. But then there are also simple kitchen oceanography experiments that need doing that you can bring into your class with you, like for example one showing that tides and internal waves by themselves don’t do a lot of mixing, and that only when they hit topography the interesting stuff starts happening.

So what we need is a simple 2-layer system and two different cases: One with topography, one without. And because we want to use it to hand around in class, the stratification should be indestructible (-> oil and water) and the container should be fairly tightly sealed to prevent a mess.

Here we go:

There definitely is a lot to be said for kitchen oceanography, too! Would you have thought that using just two plastic bottles and some oil and water could give such a nice demonstration?