The experiment presented on this page is called the “slightly more complicated version” because it builds on the experiment “oceanic overturning circulation (the easiest version)” here.
Background
One of the first concepts people hear about in the context of ocean and climate is the “great conveyor belt”. The great conveyor belt is a very simplified concept of the global ocean circulation, which is depicted as a single current that spans the world oceans (see Figure 1 below). In this simplified view of the global circulation, water flows as a warm, global surface current towards the North Atlantic, where it cools, sinks and finally returns southward and through all the world oceans near the bottom of the ocean. Water is transported back to the surface through mixing processes and starts over its journey again as a warm surface current. While in reality some part of the conveyor belt is wind-driven and many processes come to play together, a large part of the circulation can be explained by the water sinking due to cooling at high latitudes.
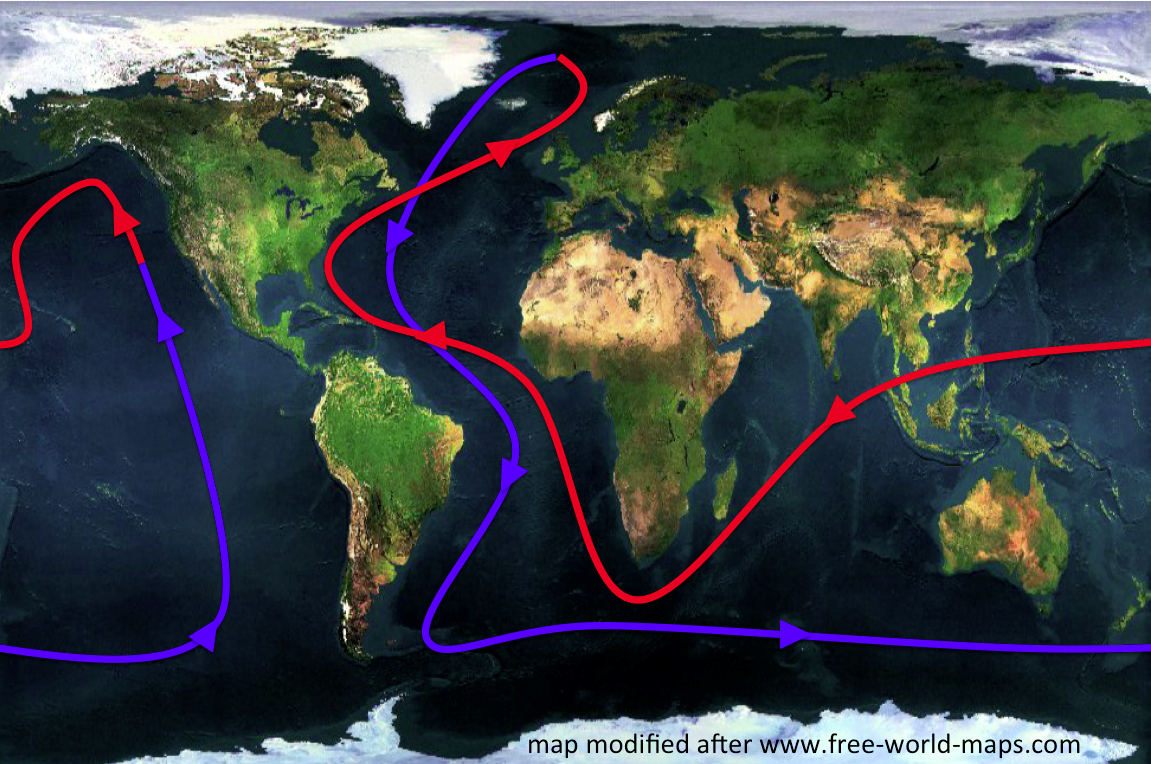
Figure 1: The great conveyor belt. My sketch on top of a map from http://www.free-world-maps.com
This can be very easily represented in a demonstration or experiment.
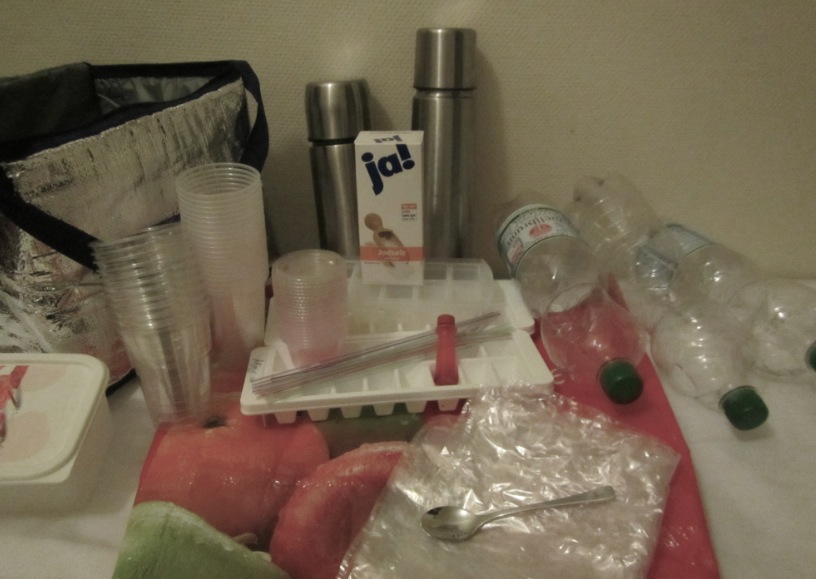
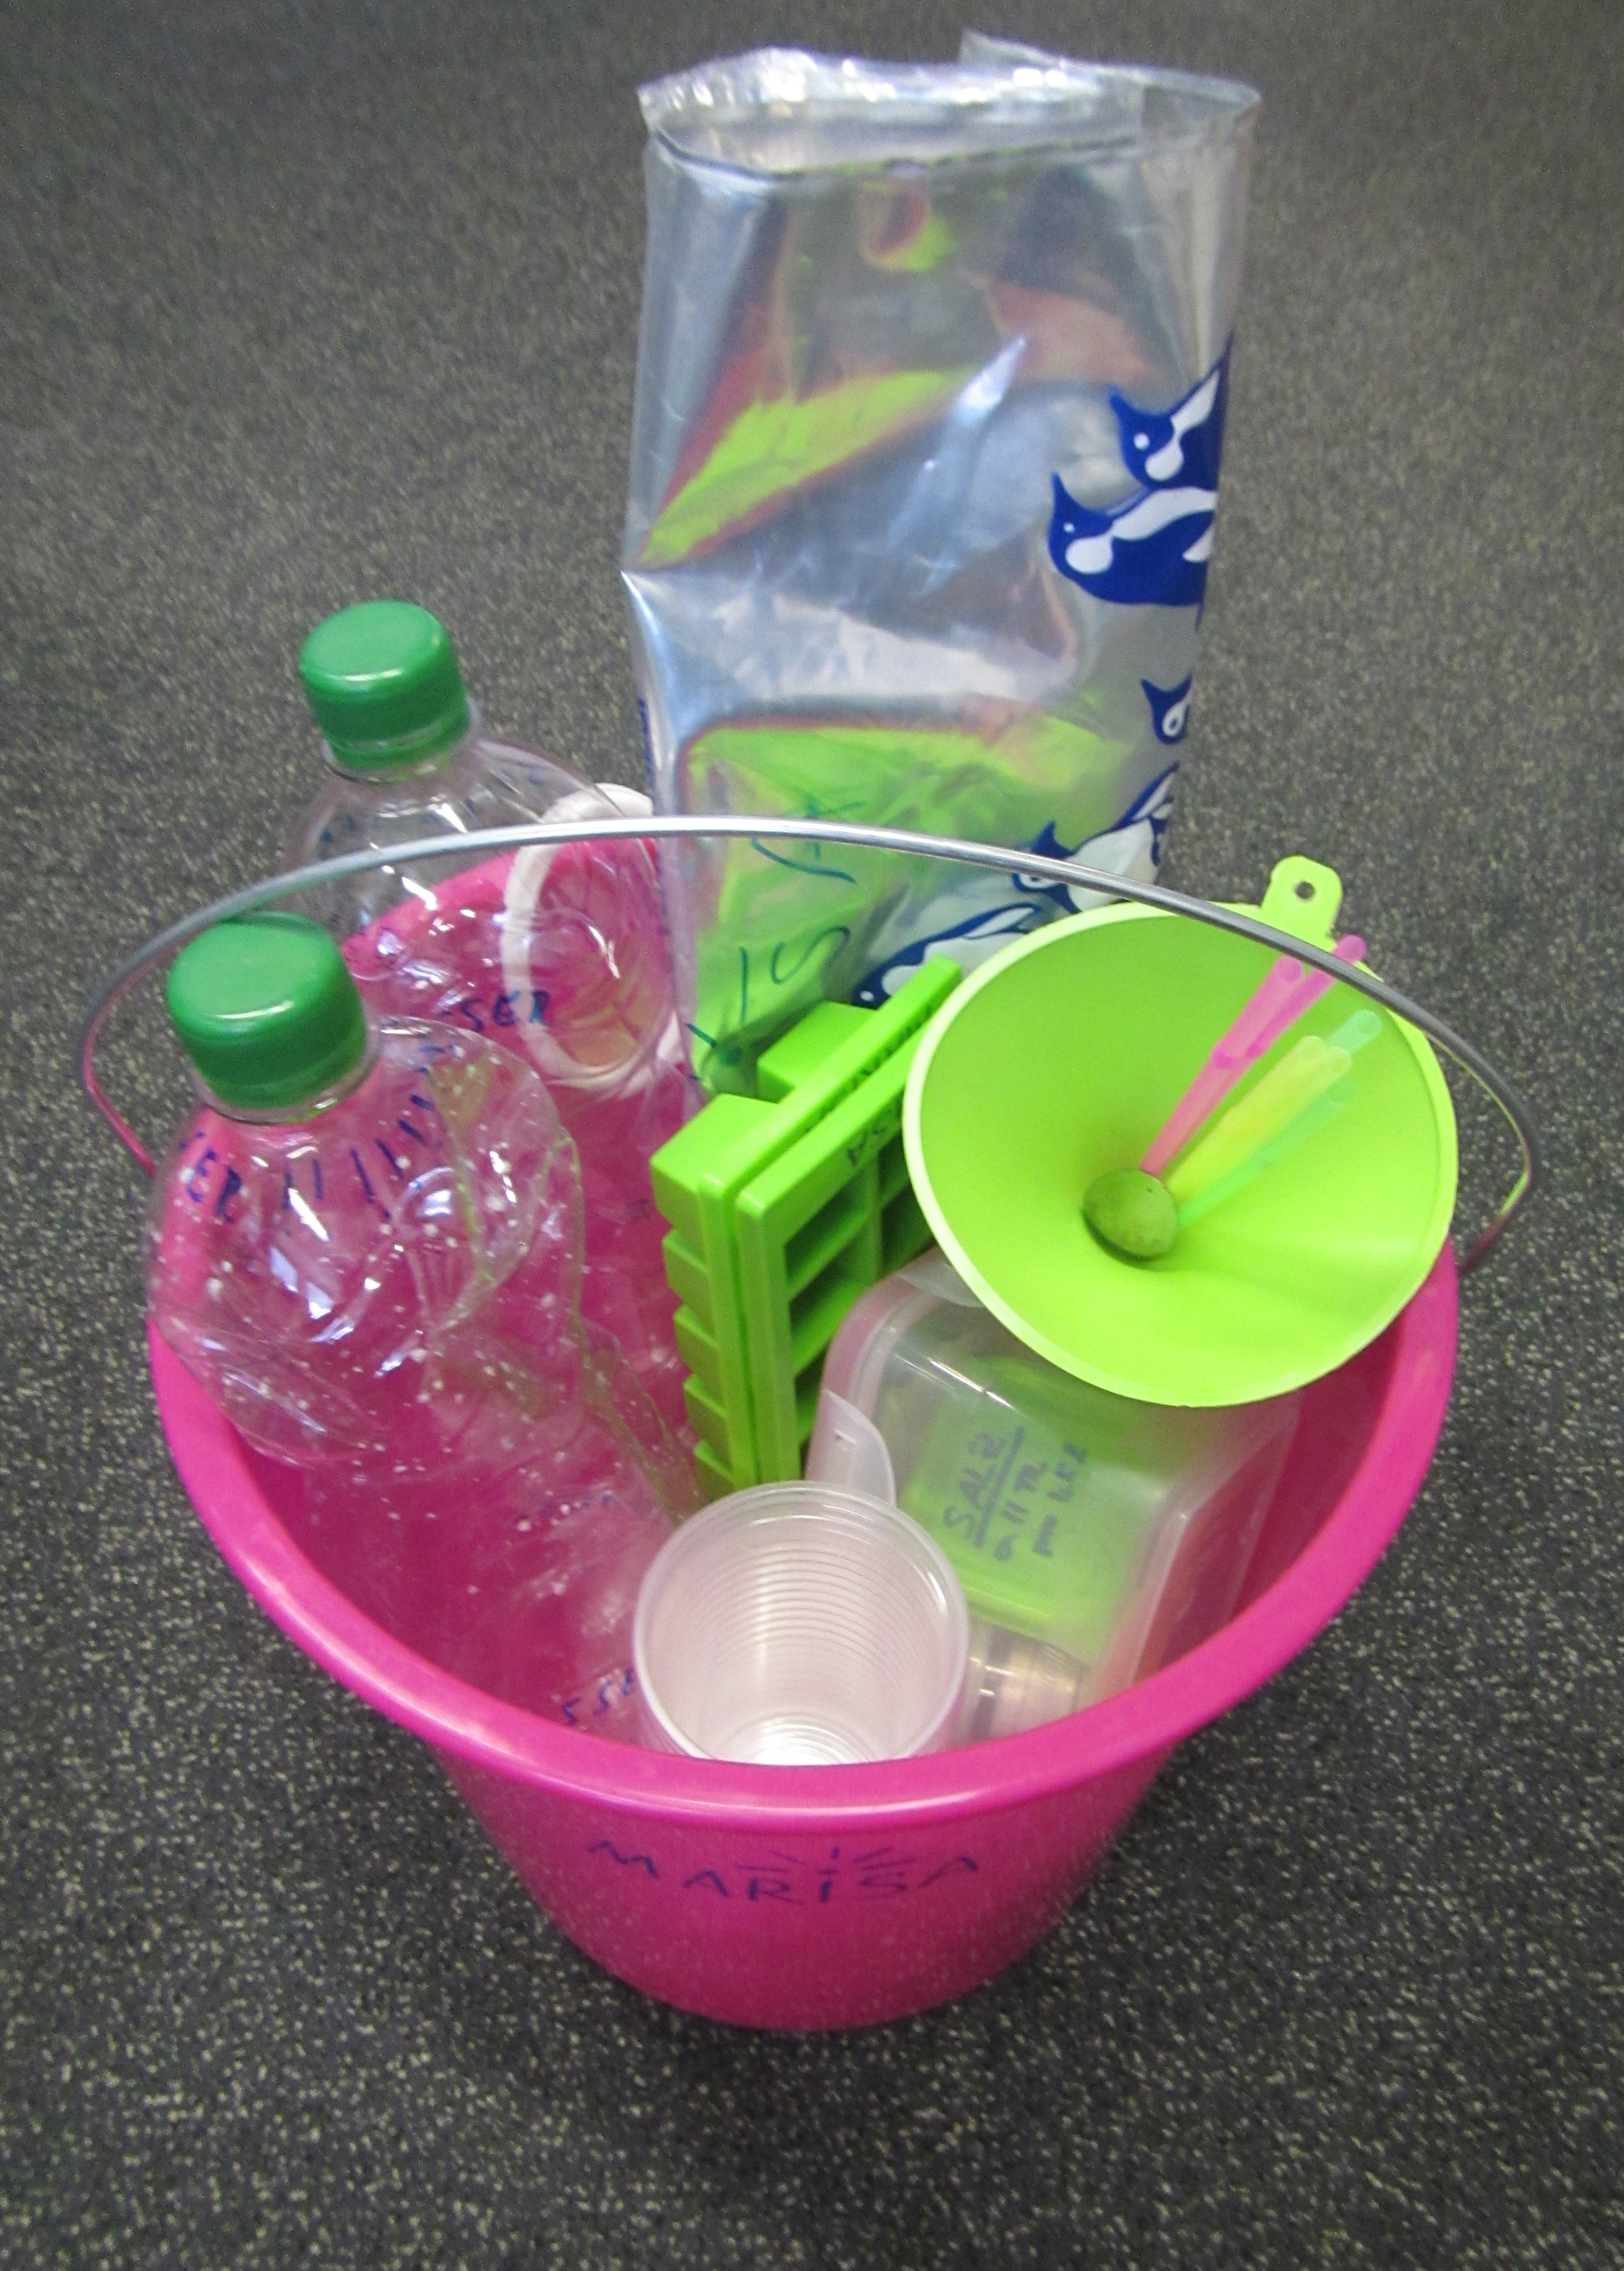
Materials
What we need for this experiment:
- 2 gel pads for sports injuries, one hot, one cold
- red and blue food coloring
- a clear plastic container to act as tank
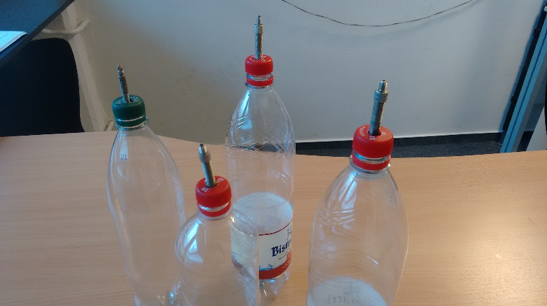
- a pipette or drinking straws to disperse drops of dye
- dye crystals to show the circulation. Can also be drops of a different color dye.
Running the experiment
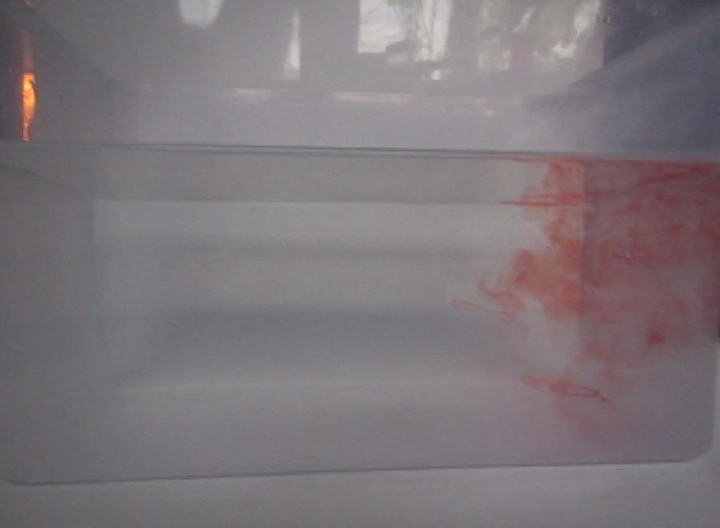
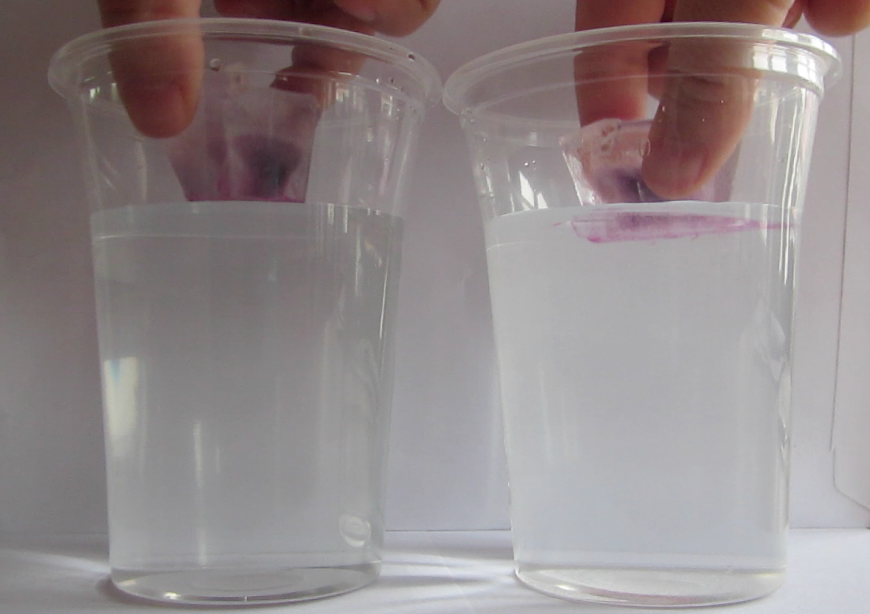
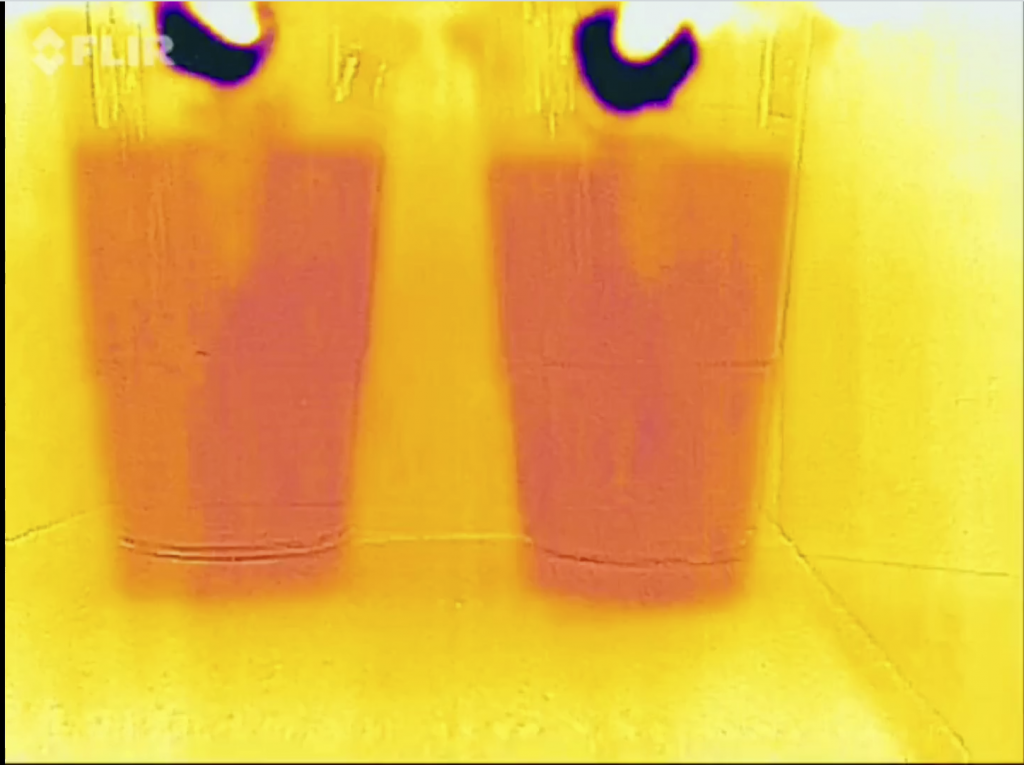
The container is filled with lukewarm water. On the “poleward” end, we add the cold pad, the warm one at the “equatorward” end of the tank.
Blue dye is tripped on the cold pad to mark the cold water, red dye on the warm pad as a tracer for warm water.
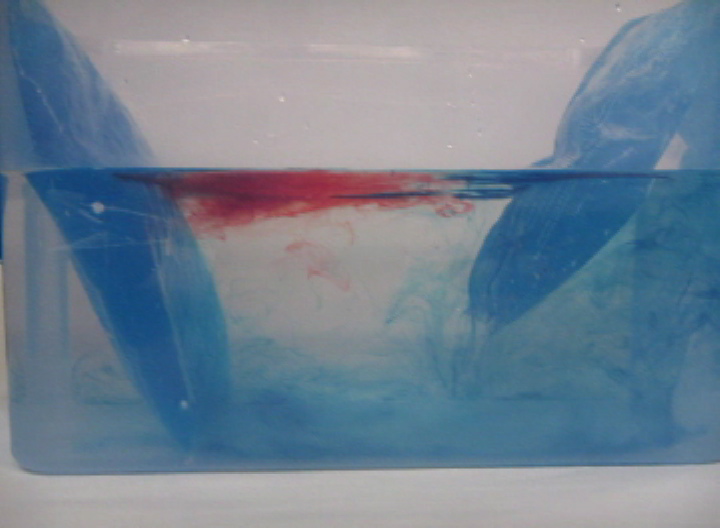
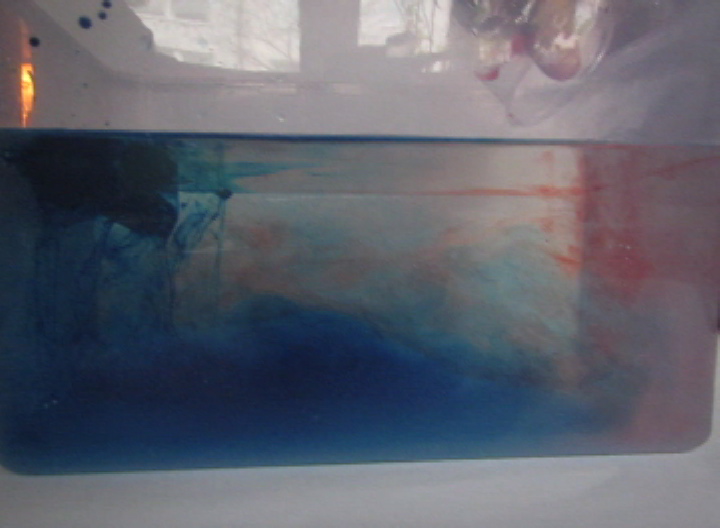
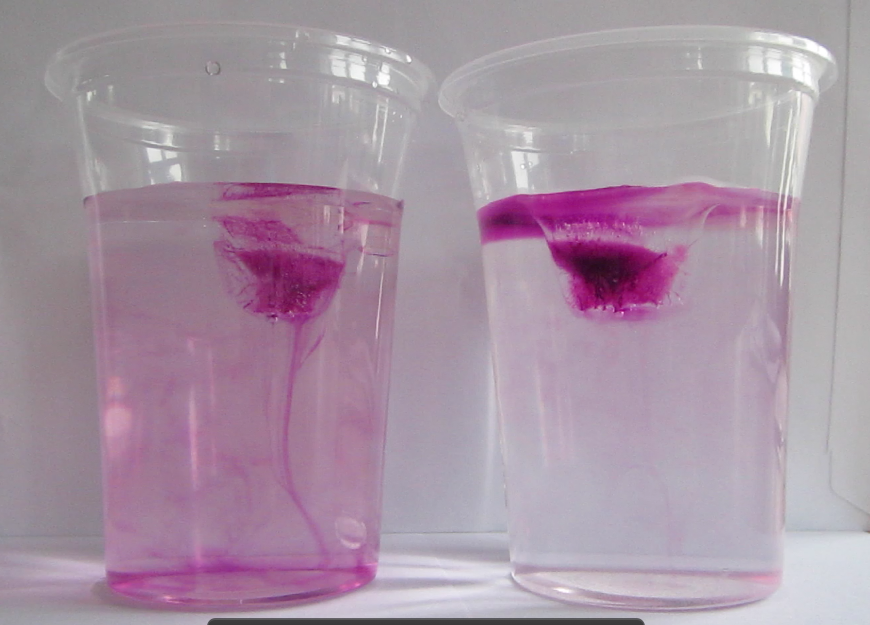
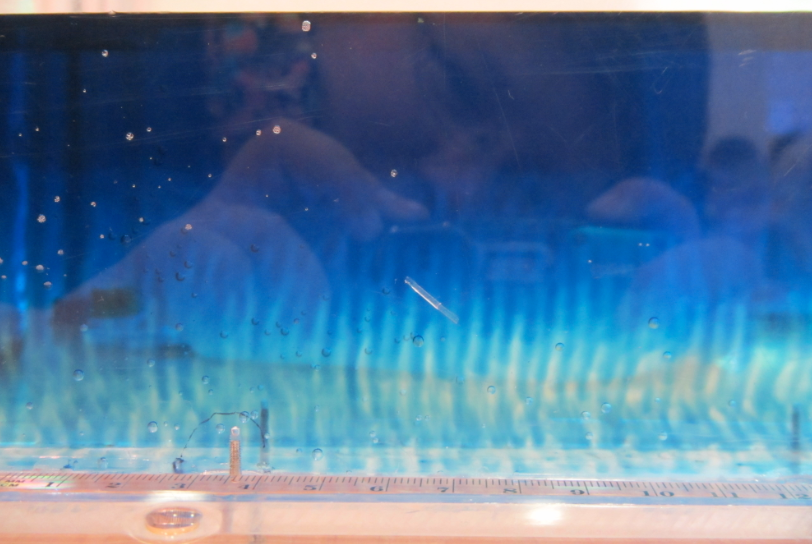
Thermally-driven overturning circulation: Warm water flowing near the surface from the warm pad on the left towards the right, cold flow from the cool pad at the bottom right to left.
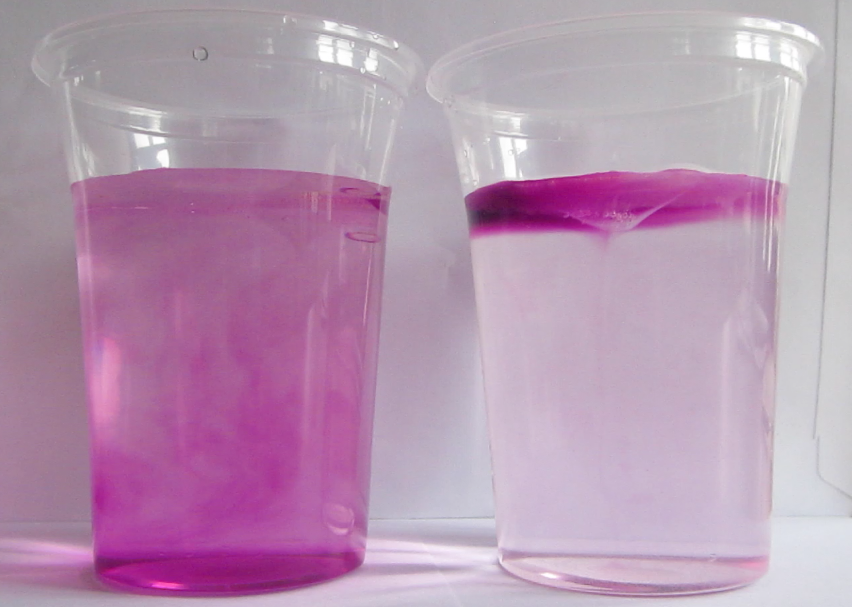
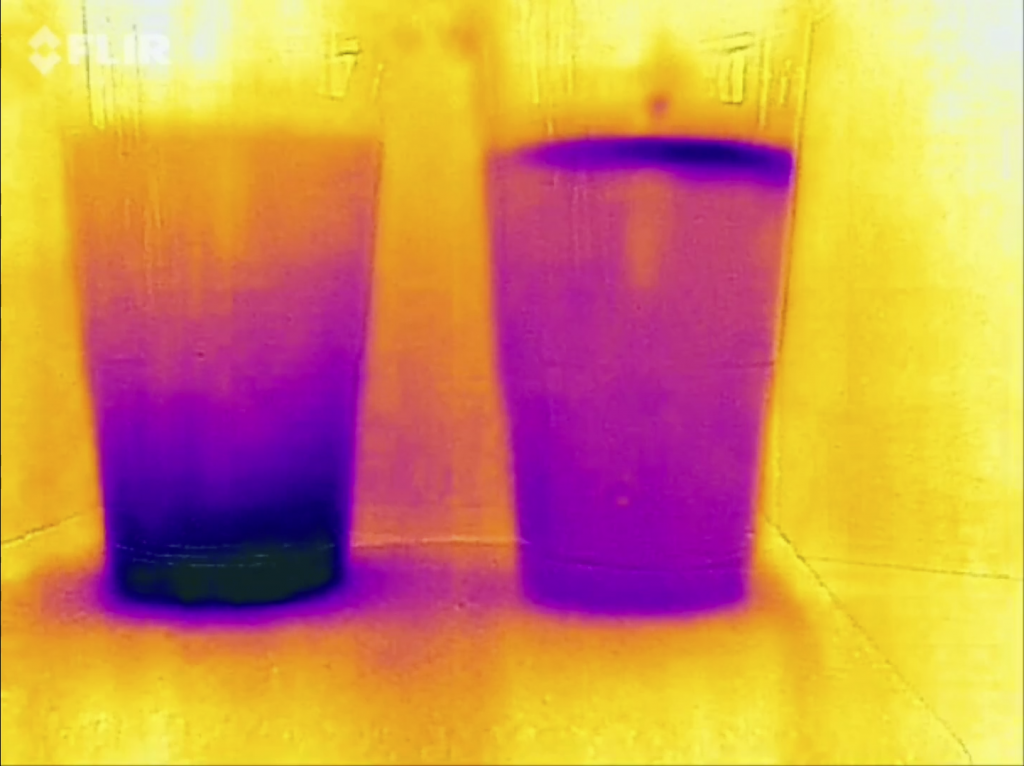
A circulation develops. If you drop dye crystals in the tank, the ribbon that formed gets deformed by the currents for yet another visualization of the flow field.
Thermally-driven overturning circulation. In the middle of the tank you see a ribbon of dye, caused by falling dye crystals, being transformed by the currents in the tank.
Here is the video:
What observations to make
Besides the obvious observation, watching, there are a couple of things you can ask your audience to do.
For example, if they carefully slide their fingers up and down the side of the tank, they will feel the warm water near the surface and the cold water at the bottom.
If you have a clear straw, you can use it as plunging syphon to extract a “column” of water from the middle of the tank, showing again the stratification of red, clear, blue.
If you put little paper bits on the surface, you will see them moving with the surface current.
Can you come up with more?
Who can I do this experiment with?
Someone recently asked me whether I had ideas for experiments for her course in ocean sciences for non-majors. Since most of the experiments I’ve been showing on this blog were run in the context of Bachelor or Master oceanography-major courses, she didn’t think that the experiments were as easily transferable to other settings as I had claimed.
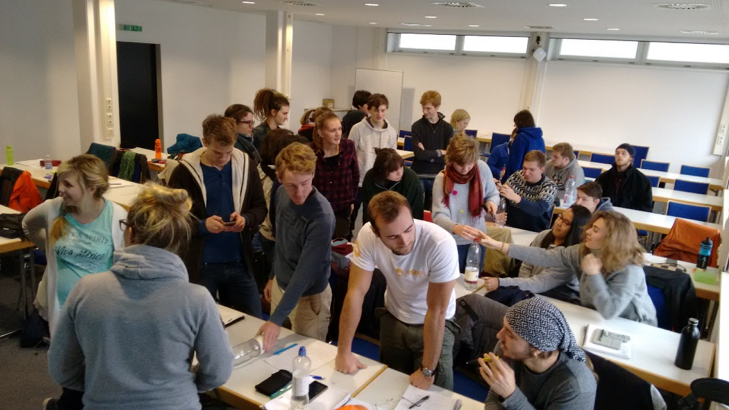
So here is proof: You can do pretty complex experiments with non-university level students. To prove my point, let’s go to a primary school.
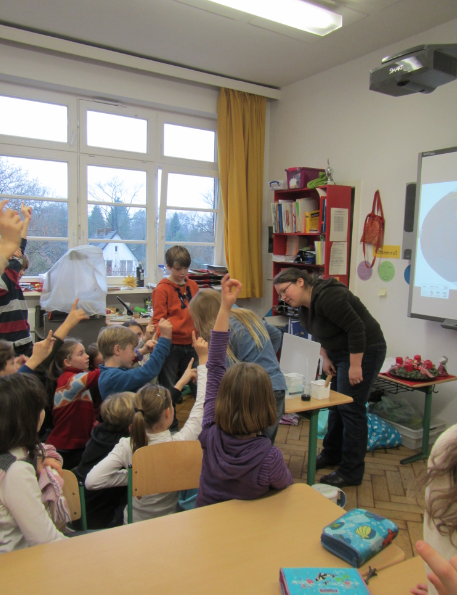
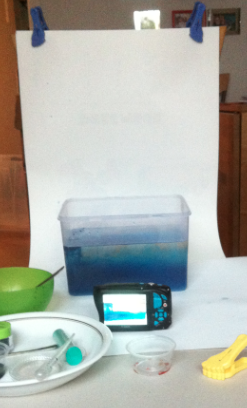
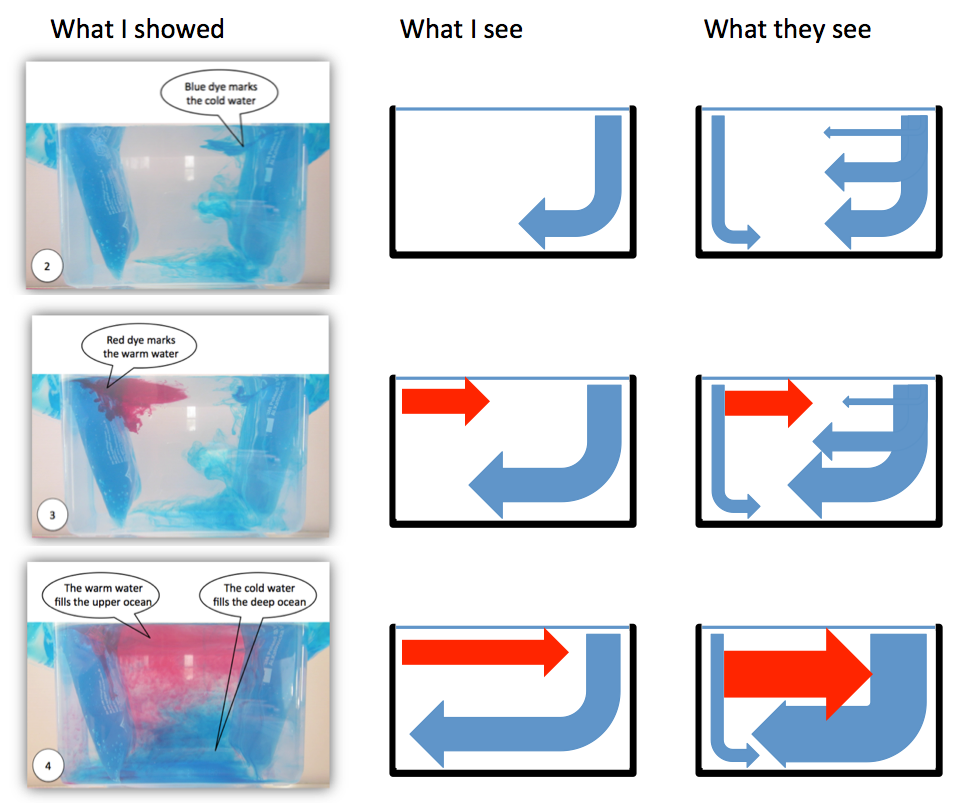
Me running the overturning experiment with a primary school class in 2012.
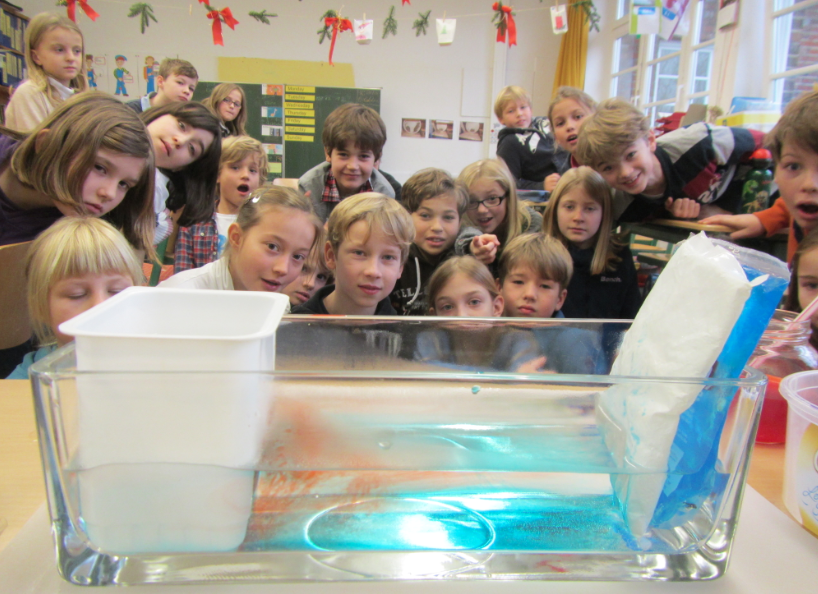
The overturning experiment as seen by the teacher (2012).
Of course, you can adapt this experiment to different levels of prior knowledge. For example, in the primary school, I introduced this experiment by showing pictures of lions and penguins and other animals that the pupils knew live in warm or cold climates, and we talked about where those animals live. In the end this aimed at how temperatures are a lot colder at the poles than at the equator. This is the differential heating we need for this experiment to work. While this is something that I felt the need to talk about with the primary school kids, this can be assumed as a given with older students (or at least that is the assumption that I made).
With the university-level courses, one of the points that I made sure came up during the discussion are the limitations of this model. For example that we apply both heating and cooling over the full depth of the water column. How realistic is that? Or the fact that we heat at one end and cool at the other, rather than cooling on either end and heating in the middle?
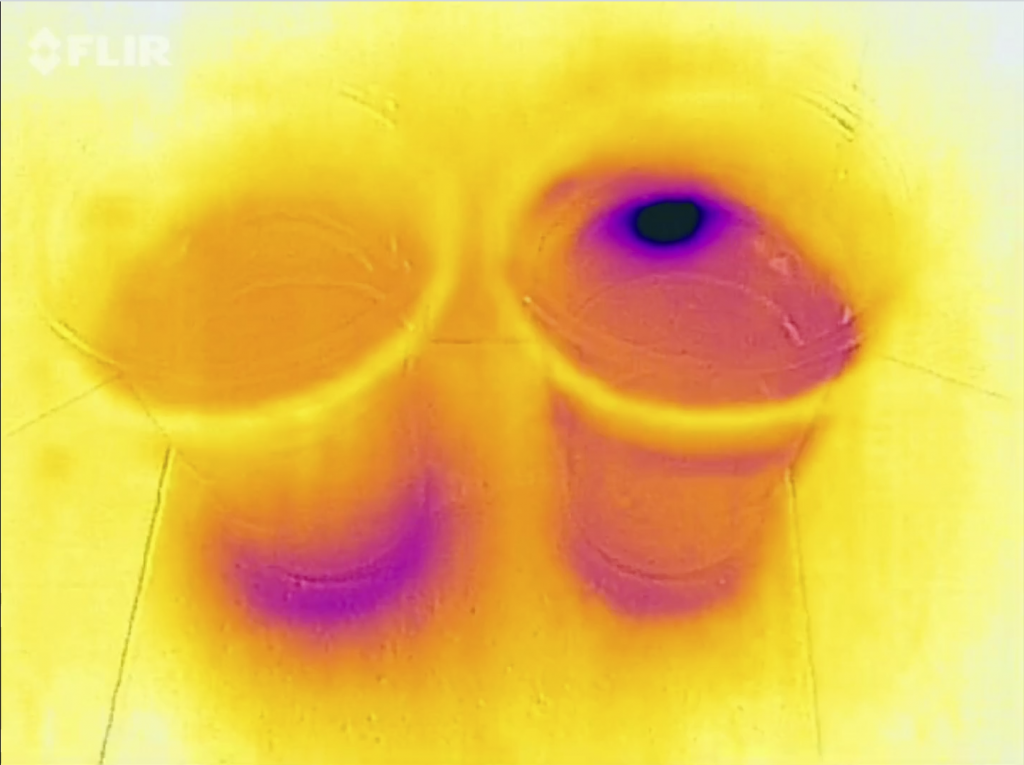
Let me zoom in on something in the picture above.
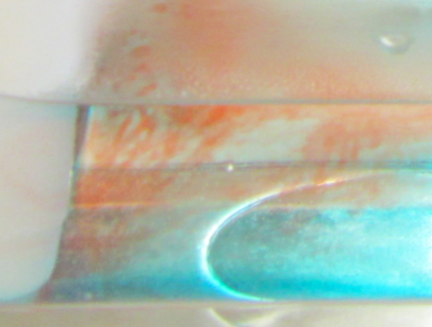
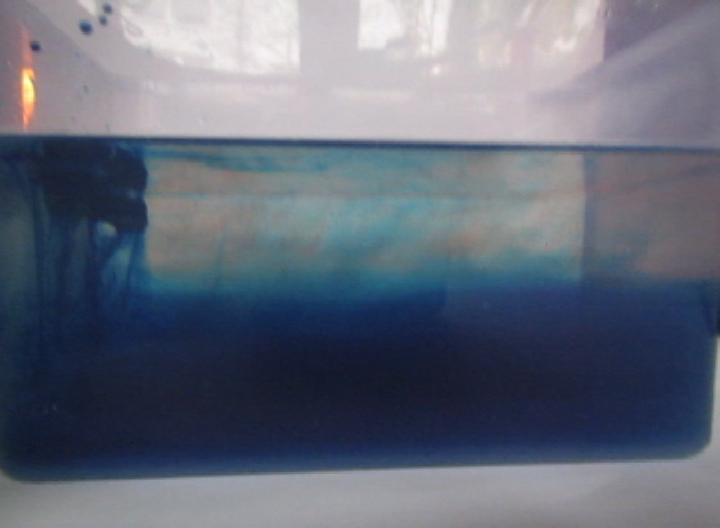
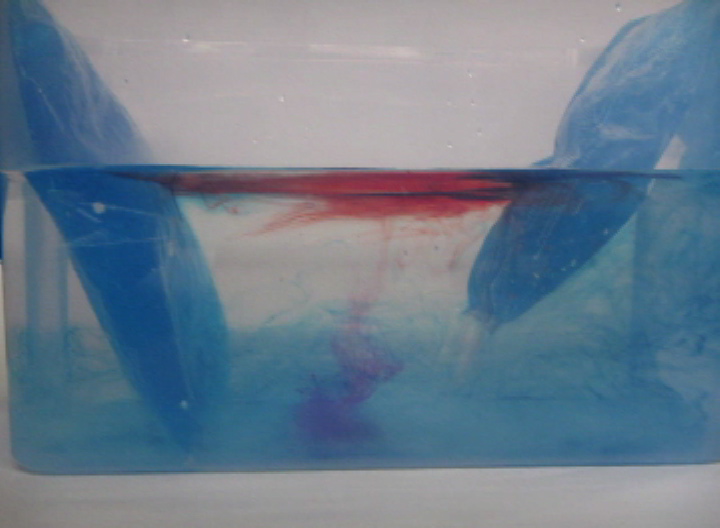
Curious features in the thermal conveyor experiment. Do you know what this is about?
Do you see these weird red filaments? Do you think they are a realistic part of the thermal circulation if it was scaled up to a global scale?
Of course not. What we see here is salt fingering. This is a process that is caused by the different diffusivities of heat and of the red dye. And while it is pretty large scale in our small tank, you cannot scale it up just like that when talking about the real ocean. And it is also really difficult to get rid of salt fingers for this experiment, in fact I haven’t yet managed. But I am open to suggestions! :-)
Another point that I would talk about with university-level students that I would probably not bring up with primary school kids (- although, why not if I had more time than just those 45 minutes per class?) is that ocean circulation is driven by more than just differential heating. Even when just considering the density-driven circulation, that is additionally influenced by changes in salinity. Put that together with wind-driven circulation and we are starting to talk about a whole new level of complicated…
But anyway. My point is that even primary school kids can benefit from doing this kind of experiments, even if what they take away from the experiments is not exactly the same as what older students would take away.
Discussion
—
P.S.: This text originally appeared on my website as a page. Due to upcoming restructuring of this website, I am reposting it as a blog post. This is the original version last modified on January 13th, 2016.