Category Archives: tank experiment

Rotating vs non-rotating turbulence — now with movie!

Lots of demonstrations being prepared for Torge’s and my “dry theory to juicy reality” project. Shown here today: rotating vs non-rotating turbulence. Because the only way to really appreciate how amazing rotating flows are is to compare them with non-rotating ones. And not everybody does have a clear idea what non-rotating flows would even look like.

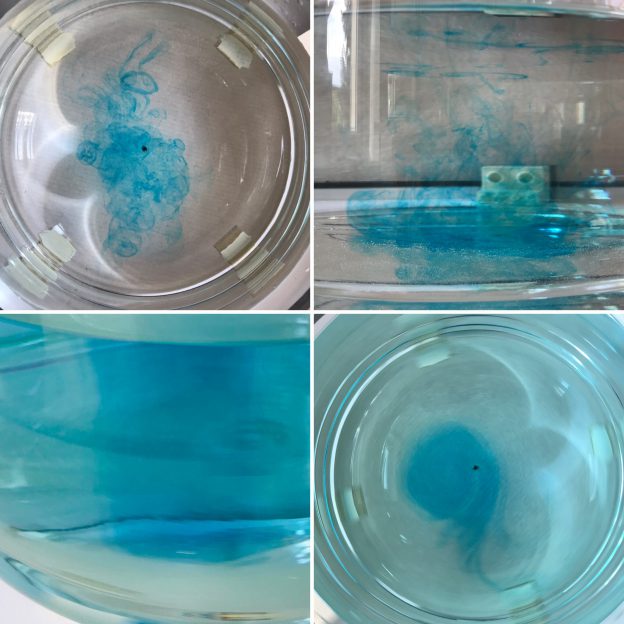
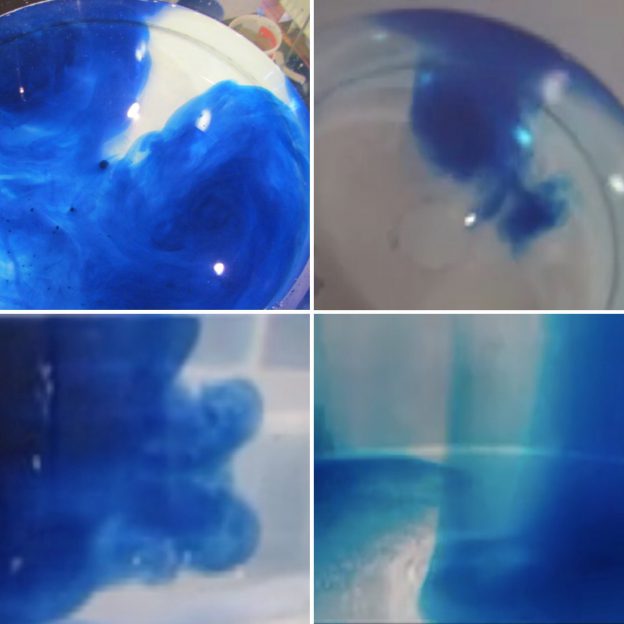
So here we are dropping dye into a non-rotating tank. Top view shows it forming tons of small eddies and spreading to the sides.

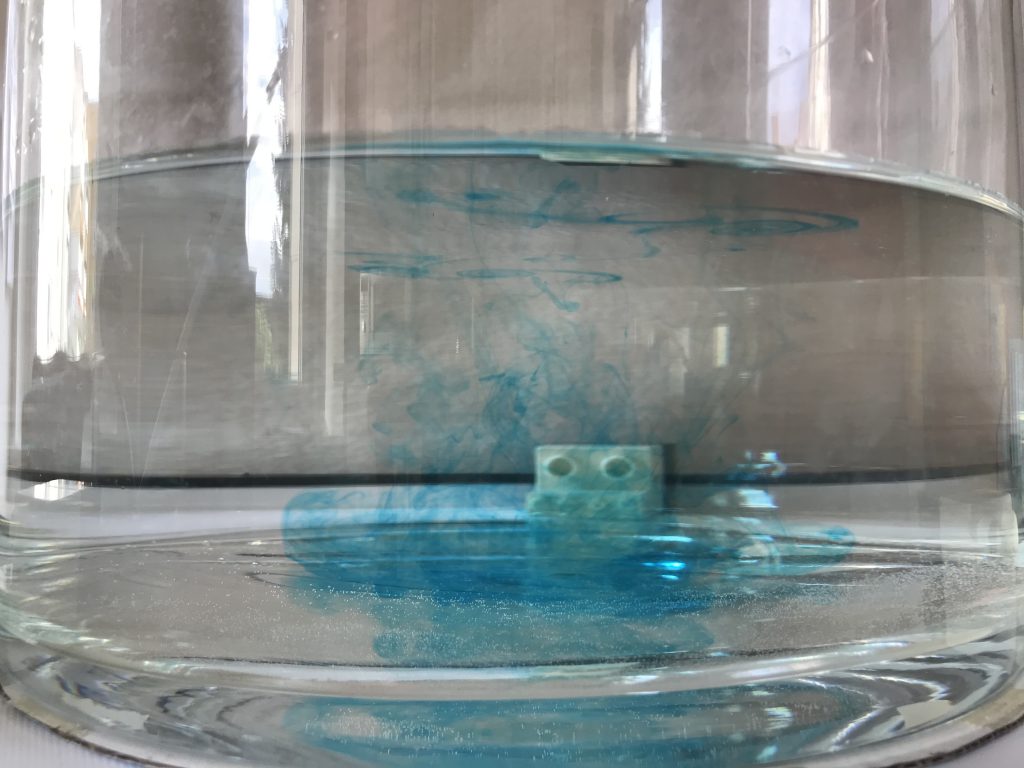
Side view shows that most of the dye sank to the bottom of the tank and is spreading there, showing 3-dimensional turbulence.

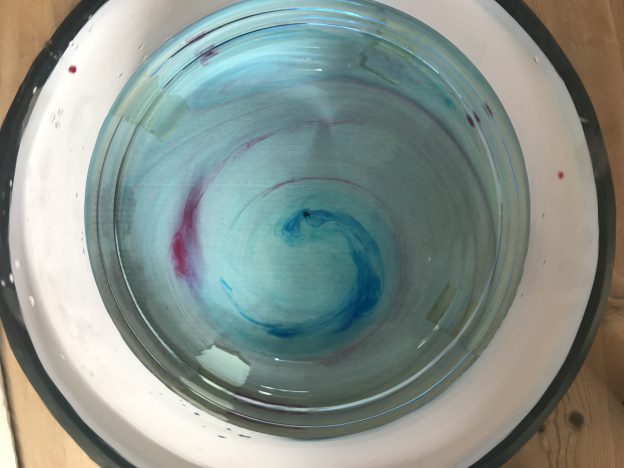
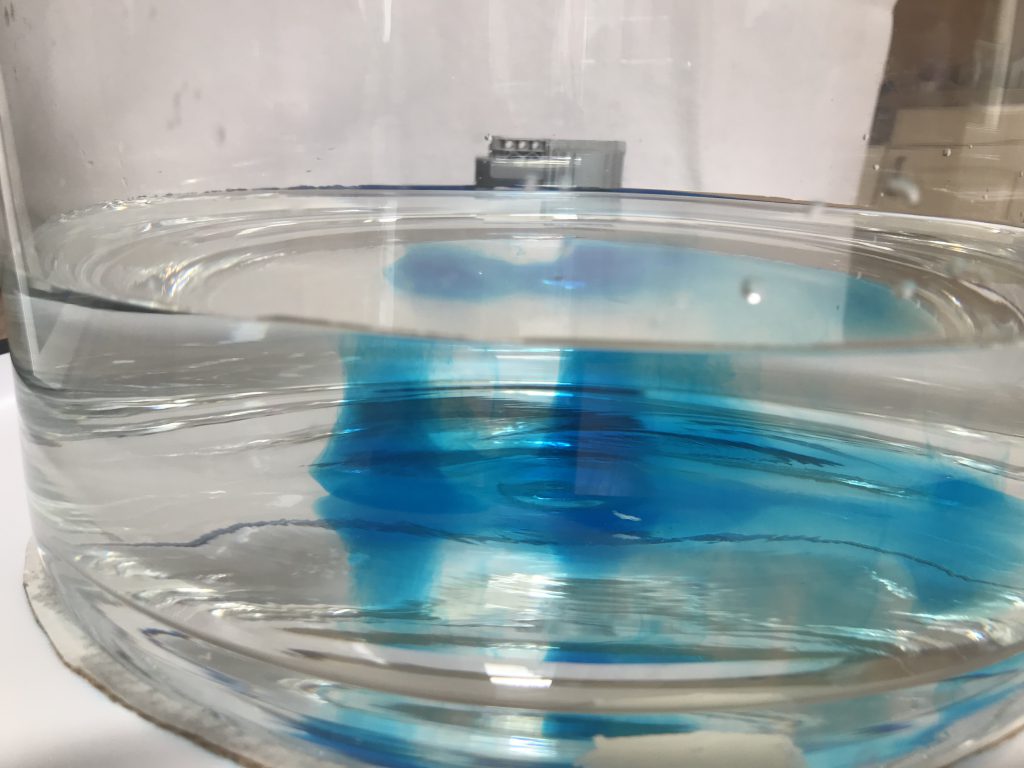
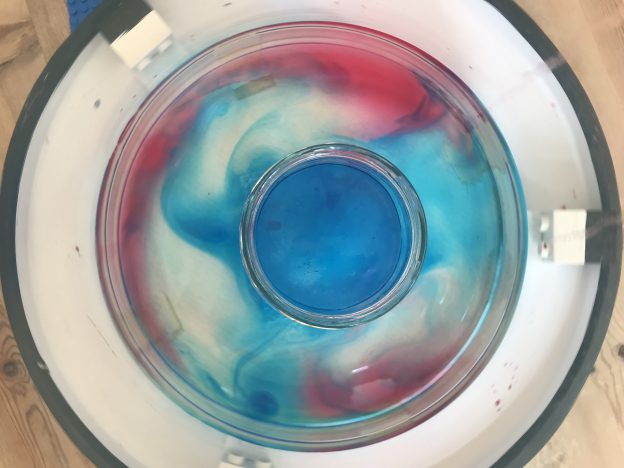
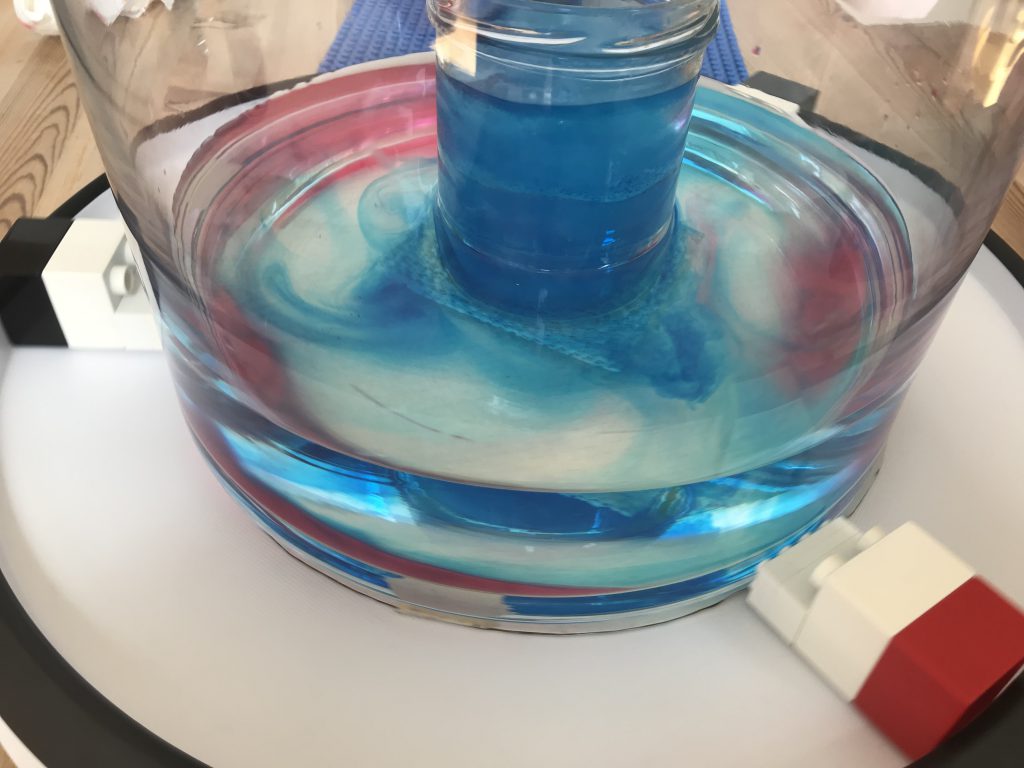
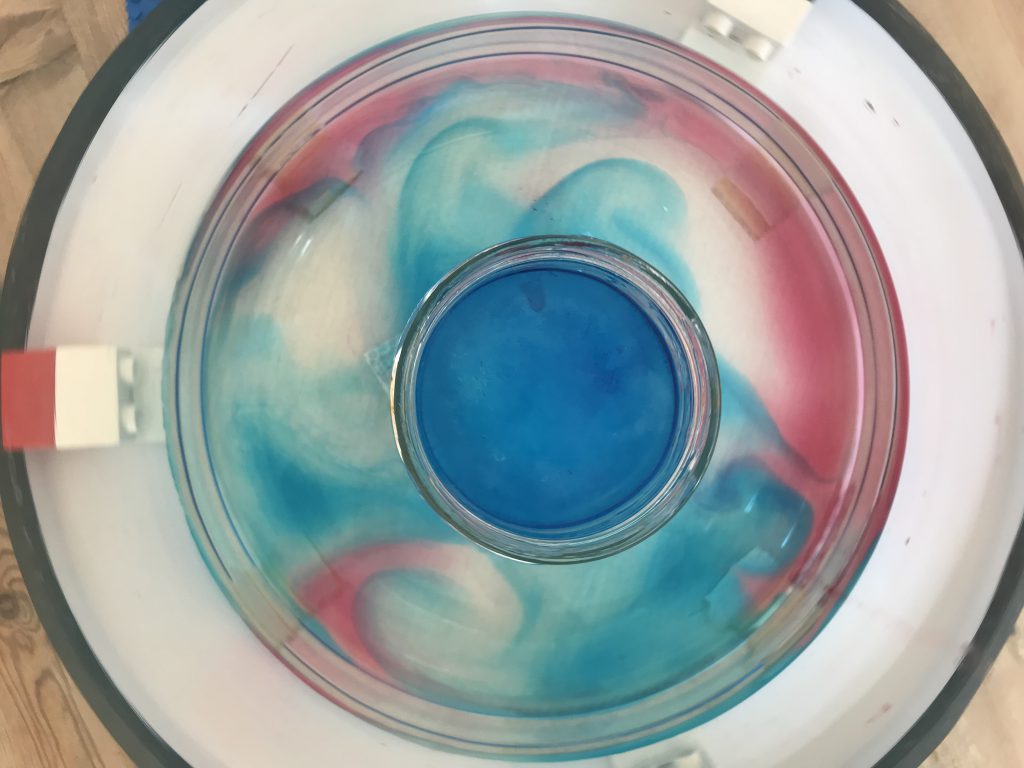
Now, for comparison, the rotating case!

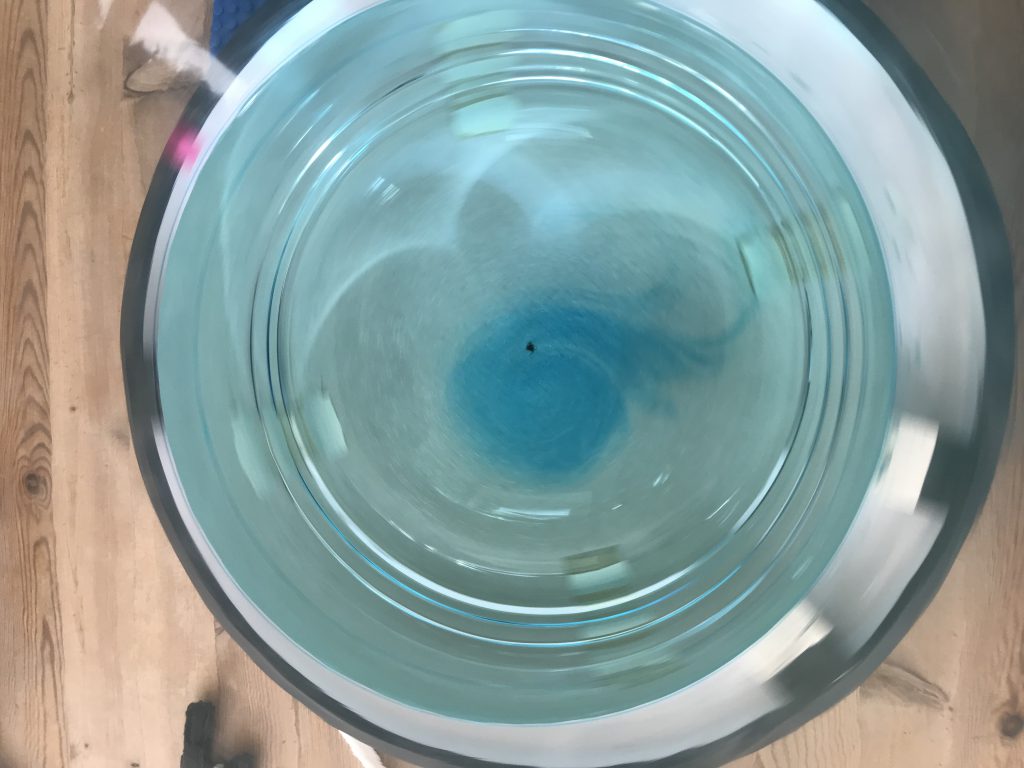
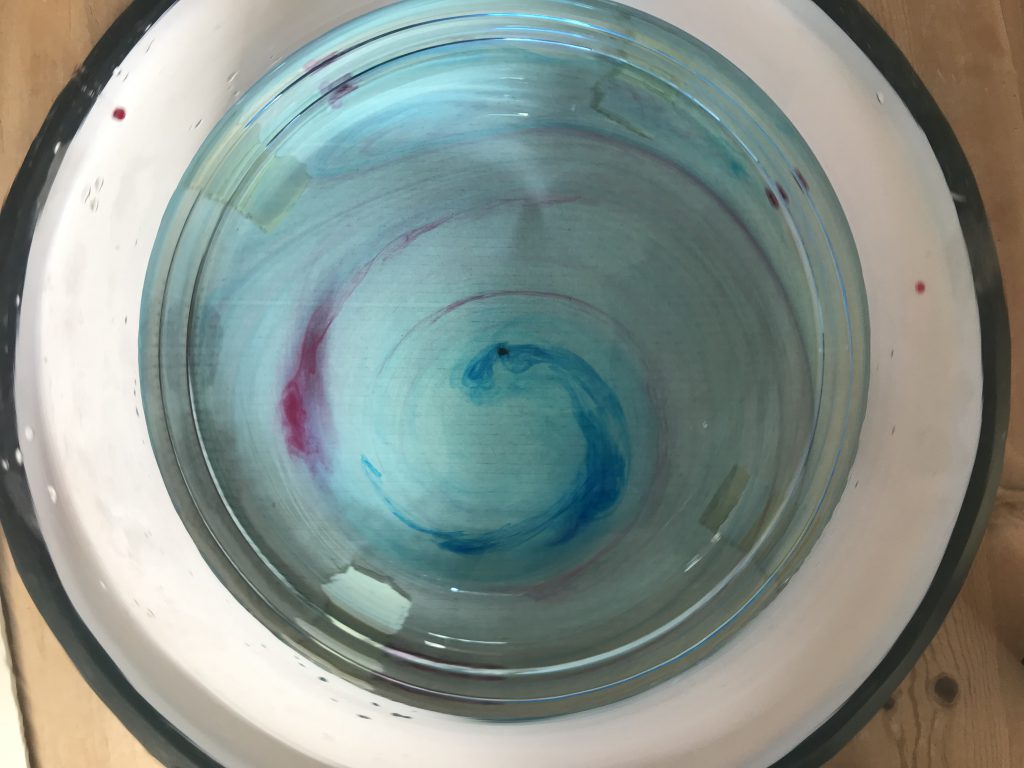
Top view shows one single, clean eddy.

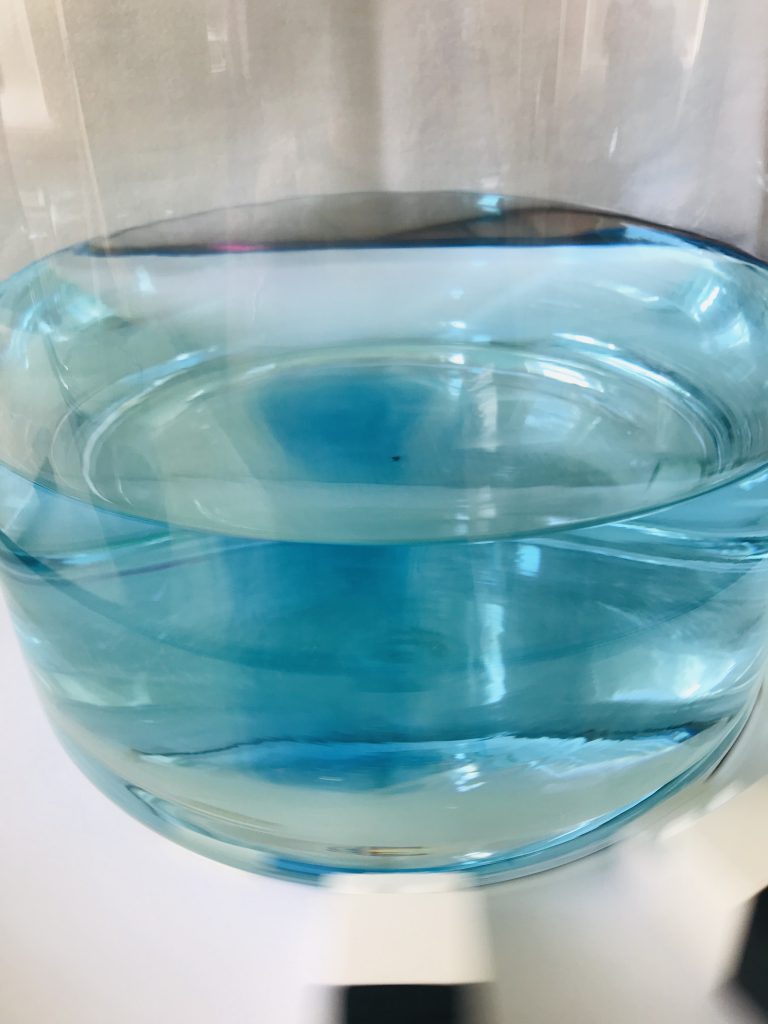
And side view shows that the structure is coherent all the way from surface to bottom. Now doesn’t this look really fascinatingly different from the non-rotating case?

To show the difference even more clearly, check out the movie below. Speed of both movies is the same!


Spinning dye curtain — when a tank full of water has not reached solid body rotation yet

With all the rotating tank experiments I’ve been showing lately, one thing that comes up over and over again is the issue of solid body rotation.

On our DIYnamics-inspired turntable for our “dry theory to juicy reality” project, Torge and I came up with a fun way to illustrate the importance of full body rotation in tank experiments, again inspired by the DIYnamics team, this time their youtube channel.

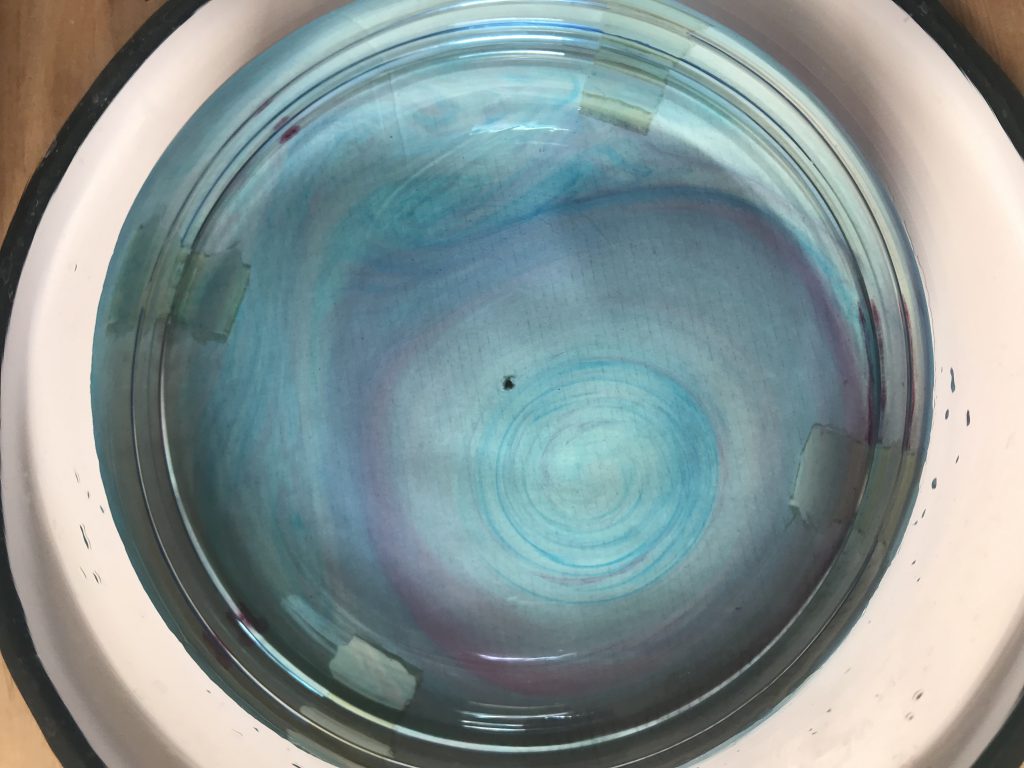
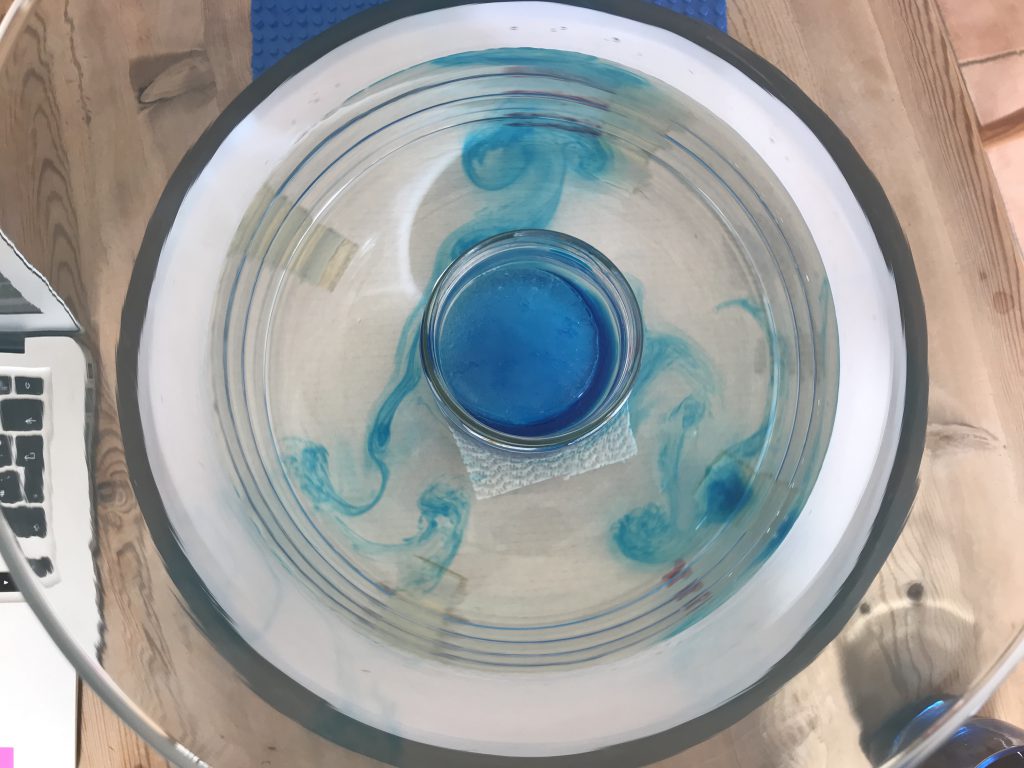
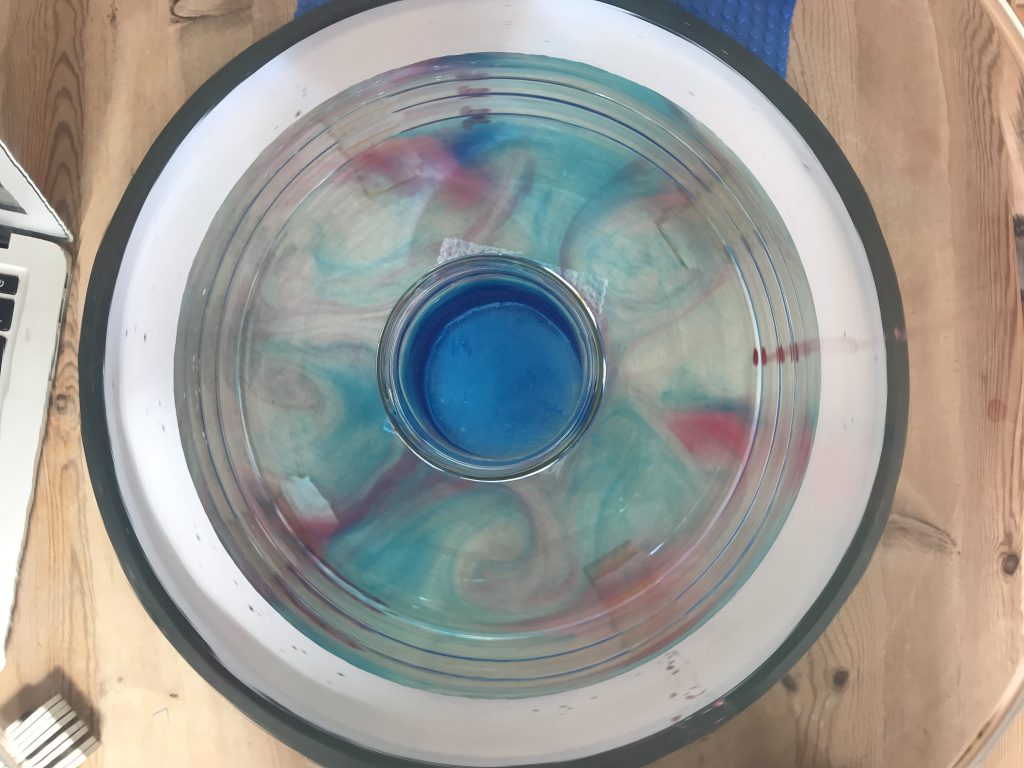
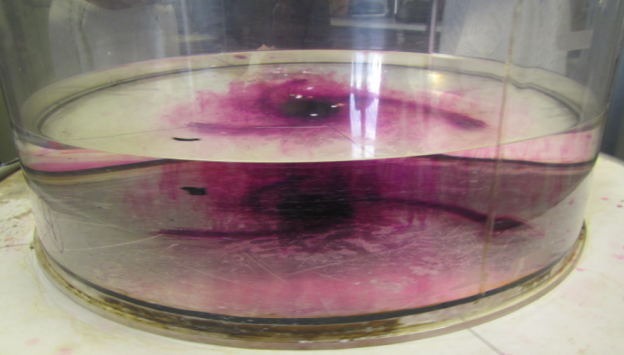
For the spinning dye curtain experiment, we start up the rotating table, and then pretty much immediately add in some dye. Below, you see what happens when you add in the dye too late (we waited for 2 minutes here before we added it): The water is so much in solid body rotation already, that we only form columns and 2D flow.

But if we add in the dye right away after starting up the tank, we form these spirals where the water further away from the center is spinning faster than the water right at the center, thus distorting the dye patches into long, thin filaments (Btw, I’ve shown something similar in my “eddies in a jar” experiment earlier, where instead of starting up a turntable I just stirred water in a cylindrical tank).

But as the tank continues to spin up, the eddies eventually stop spinning and the tank turns into solid body rotation. If new dye is added now, only columns form, but they stay intact as if they were, indeed, solid bodies.

But seeing the behaviour of a fluid change within half a minute or so is really impressive and something we definitely want to do in class, too!

Baroclinic instabilities / Hadley cell circulation in a tank

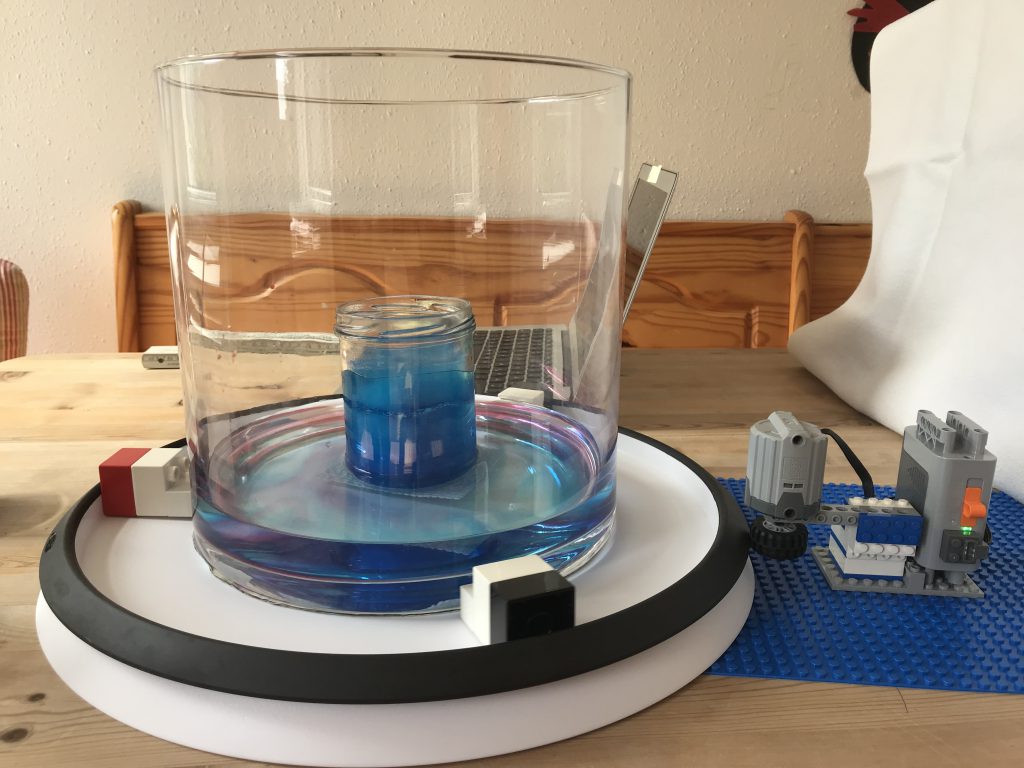
The DIYnamics-inspired turntable that Torge and myself have been working on for our “dry theory to juicy reality” project is finally working well!

This is what the setup now looks like (how simple is that?!) and we had an exciting morning testing different experiments!

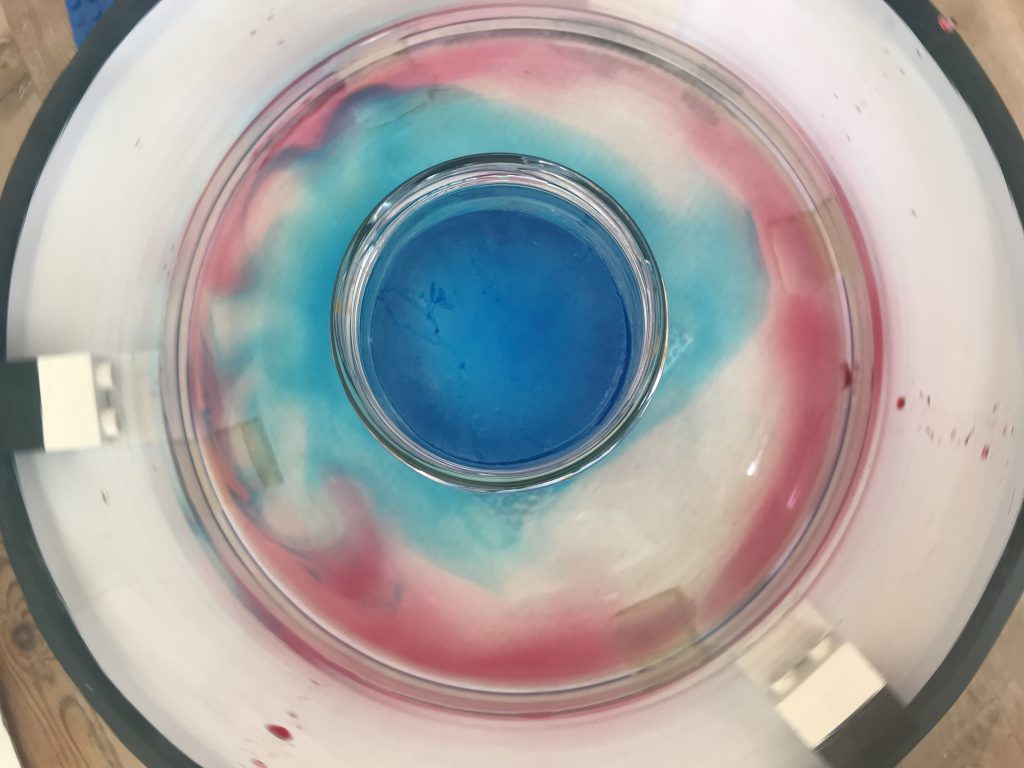
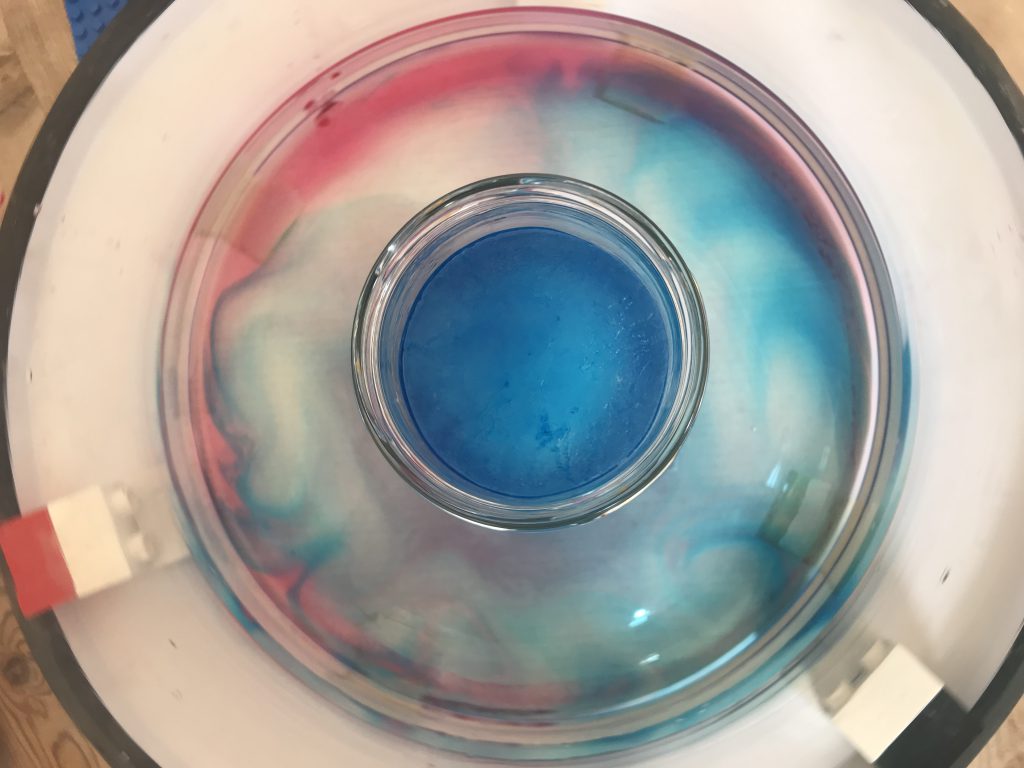
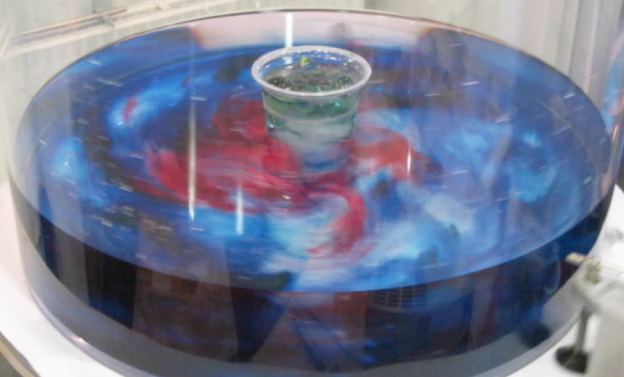
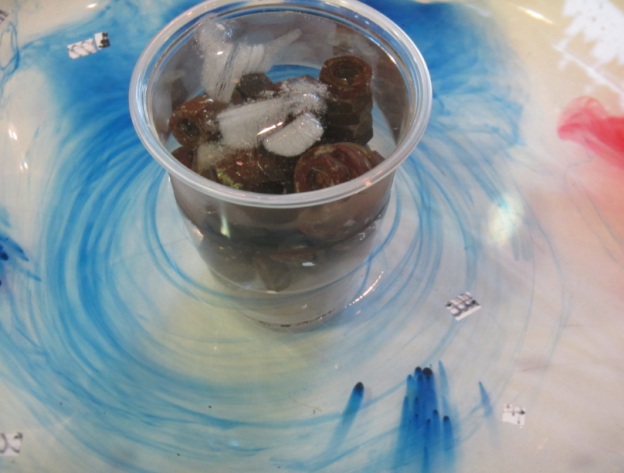
The one experiment that we have been using as test case in all our previous sessions is the Baroclinic Instability / Hadley cell circulation. There are sketches of the setup and the expected circulation in this blogpost, so just a quick reminder: We place a cold core in the center of our tank (here a glass with blue ice in it), spin the tank (at approximately 20rpm) into solid body rotation, and introduce dye (blue towards the center, red towards the outer edge of the tank).

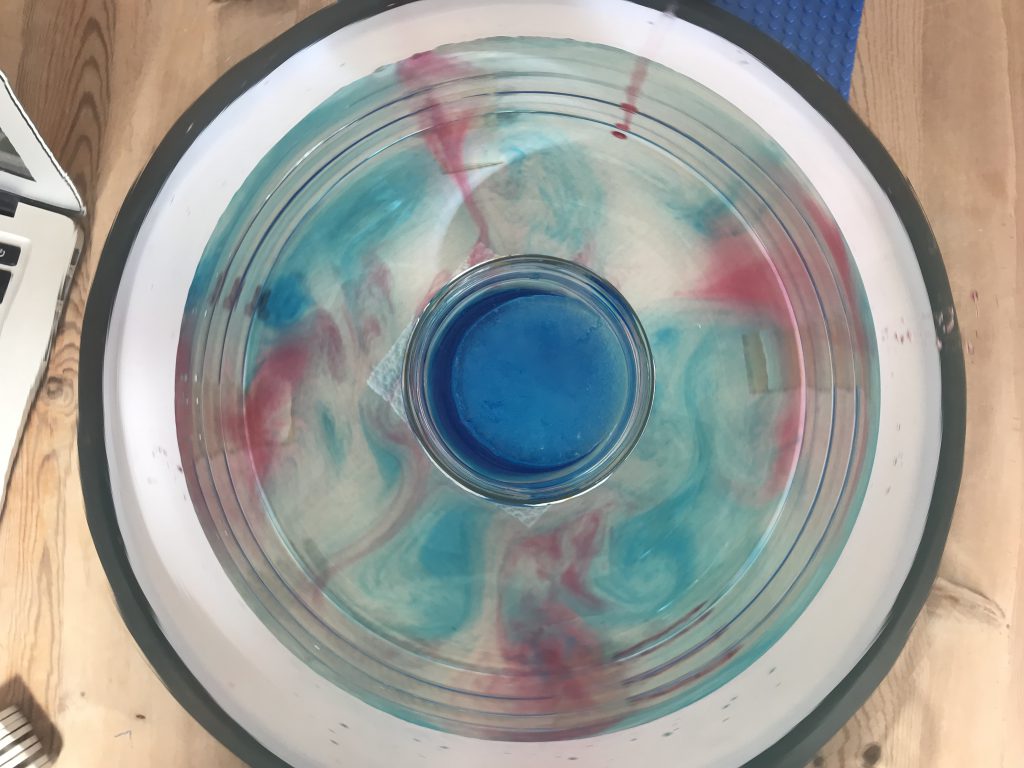
And what happens then is just beautiful: We get 2D instabilities that transport cold (blue) water outwards and warmer (room-temperature, red) water towards the center of the tank.

We’ve run the experiment three times with different water levels (and once with Southern Hemisphere rotation just for fun) and it worked beautifully each time.

I find it always fascinating how there is hardly any mixing between the red and blue curtains (and there shouldn’t be any because rotating flows become 2D (as shown here)).

Just look at how the dye curtains form when we first add the blue dye…

And then a little later added some red dye…

And then let the field develop.

So I think we’ve got this experiment down and can run it with the students once the semester starts up again in October! :-)

Combining rotation of a water tank with a temperature gradient: A Hadley cell circulation demo!

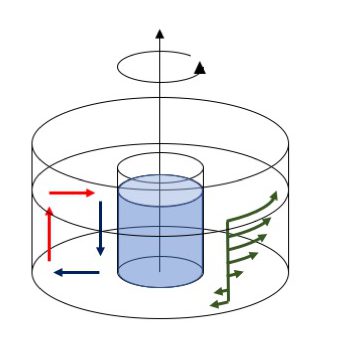
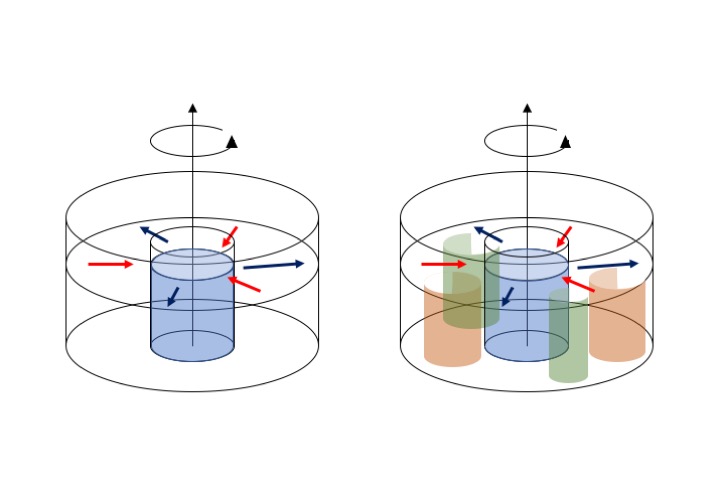
Yesterday, we combined a thermally-driven overturning circulation with the effects of rotation, and thus created a Hadley cell circulation. And while the tank was turning faster than we would have liked, we still managed to create a circulation that largely resembles the sketch below: An axially-symmetric overturning circulation (with cold water, indicated by blue arrows, moving down near the cooling in the middle and then outwards, and warmer water moving up along the outer rim and then towards the middle of the tank) which induces the thermal wind flow (sketched in green: Fast surface current in the direction of rotation but even faster than the tank is rotating, and slow bottom flow in the opposite direction).

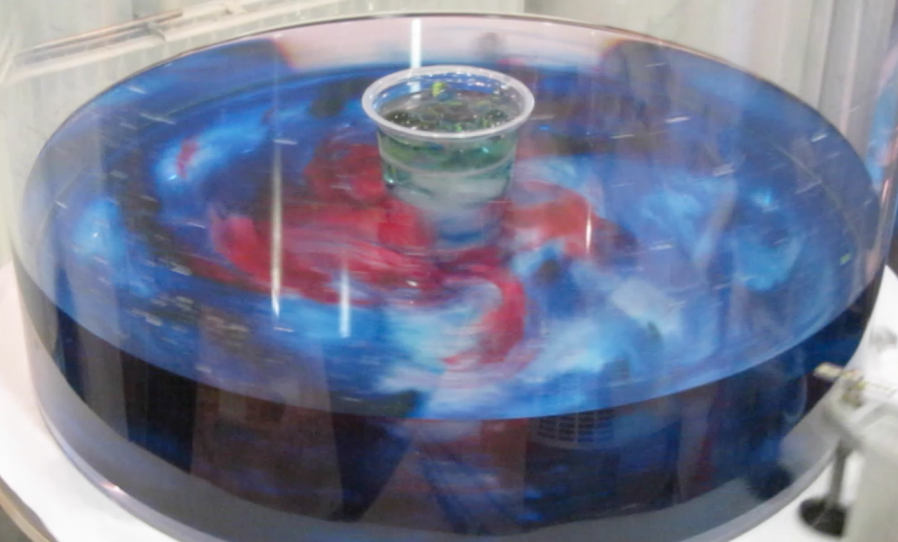
But what would happen if we increased the tank’s rotation rate? It would make the induced azimuthal flow, the thermal wind, faster too, until it eventually becomes unstable and breaks down into eddies. And then, the experiment (first blogged about a long time ago) looks similar to this one: Lots and lots of eddies that are now rigid vertically and move as Taylor columns!

Heat exchange between the cold core and the warmer areas towards the rim of the tank now doesn’t happen via overturning any more, but looks something like sketched below: We now have radial currents bringing warm water towards the middle (red) and cold water away from it (blue), and the eddies that create those currents are coherent over the whole depth of the tank.

This is actually a really nice demonstration of the circulation in mid- and high latitudes where the weather is determined by baroclinic instabilities, i.e. weather systems just like the eddies we are showing here.

Btw, having two different experiments both represent the same Hadley cell circulation isn’t a contradiction in itself: On Earth, the Coriolis parameter changes with latitude, but in the tank, the Coriolis parameter is the same throughout the tank. So depending on what latitude we want to represent, we need to change the tank’s rotation rate.

Here is an (old) movie of the experiment, and I can’t wait for our own tanks to be ready to produce a new one!


Combining a slowly rotating water tank with a temperature gradient: A thermal wind demonstration!

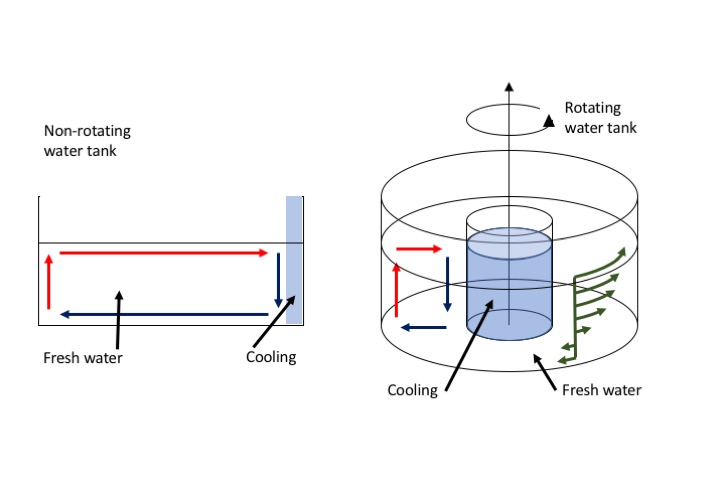
Setting up an overturning circulation in a tank is easy, and also interpreting the observations is fairly straightforward. Just by introducing cooling on one side of a rectangular tank a circulation is induced (at least for a short while until the tank fills up with a cold pool of water; see left plot of the image below).

But now imagine an axially symmetric setup where the cooling happens in the middle. What will happen to that overturning circulation if the tank is set into rotation (see right plot above)?

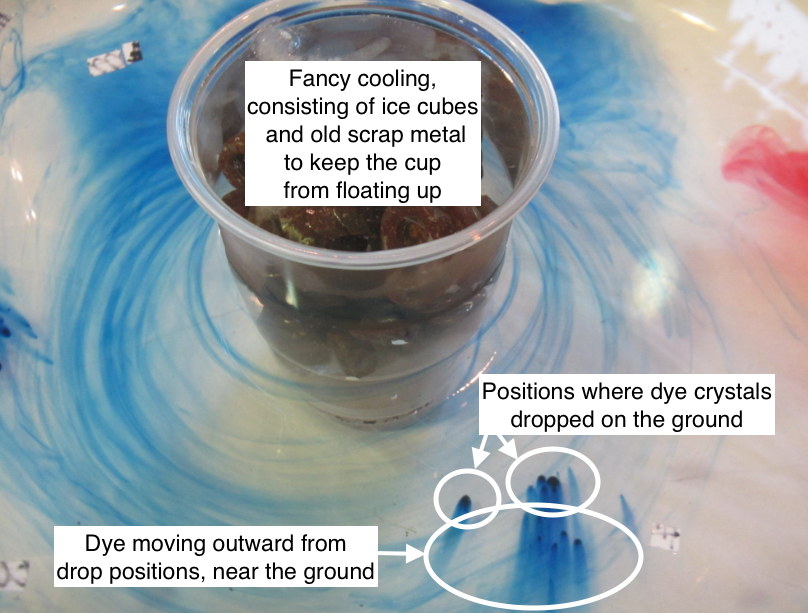
First, let’s check there is an overturning circulation. We can see that there is when we look at dye crystals that sank to the bottom of the tank: Dye streaks are moving outwards (and anti-clockwise) from where the crystals dropped on the ground, so at least that part of the overturning circulation is there for sure. If our tank were taken to represent the Hadley cell circulation in the atmosphere, this bottom flow would be the Trade winds.

Now, in addition to having water sink in the middle of the tank, spread radially outwards, and returning by rising near the outer edge of the tank and flowing back towards the middle, a secondary circulation is induced, and that’s the “thermal wind”. The thermal wind, introduced by the temperature gradient from cold water on the inside of the tank to warmer waters towards the rim, tilts columns that would otherwise stay vertically.

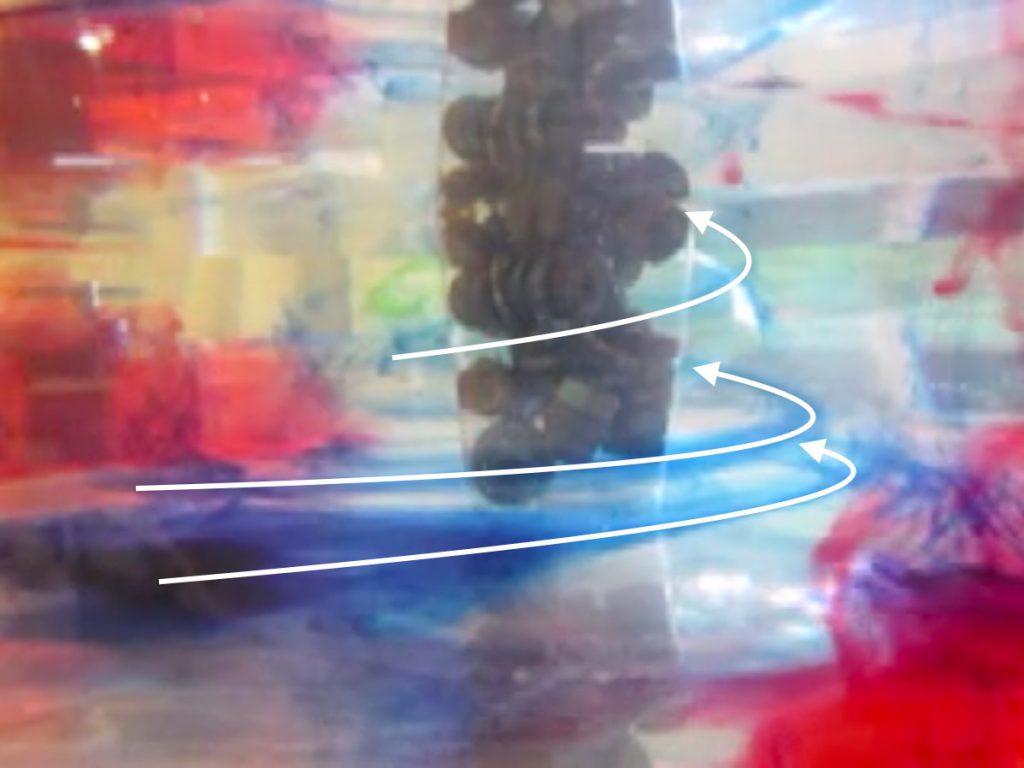
You see that in the image below: Dye dropped into the tank does not sink vertically, but gets swirled around the cold center in a helix shape, indicated in the picture below by the white arrows. In that picture, the swirls are tilted very strongly (a lot stronger than we’d ideally have them tilted). The reason for that is that we just couldn’t rotate the tank as slowly as it should have been, and the higher the rotation rate, the larger the tilt. Oh well…

So this is the current pattern that we observe: An overturning circulation (sketched with the red arrows representing warmer water and the blue arrows representing colder waters below), as well as the thermal wind circulation (indicated in green) with stronger currents near the surface (where the water is moving in the same direction as the rotating tank, but even faster!) and then a backward flow near the bottom. The velocities indicated here by the green arrows are what ultimately tilted our dye streaks in the image above.

The thermal wind component arises because as the overturning circulation moves water, that water carries with it its angular momentum, which is conserved. So water being brought from the rim of the tank towards the middle near the surface HAS to move faster than the tank itself the closer it gets to the middle. This flow would be the subtropical jets in the Hadley cell circulation if out tank were to represent the atmosphere.

Here is an old video of the experiment, first shown 5 years ago here. I’m looking forward to when Torge’s & my rotating tanks are ready so we can produce new videos and pictures, and hopefully being able to rotate the tank even more slowly than we do here (but that was the slowest possible rotation with the setup we had at that time). I promise you’ll see them here almost in realtime, so stay tuned! :-)

Why do we need a rotating tank to study ocean and atmosphere dynamics? A demonstration

For our project “Ocean currents in a tank: From dry theory to juicy reality“, Torge, Joke and I are working on building affordable rotating tanks to use in Torge’s Bachelor class on ocean and atmosphere dynamics. When people ask what we need rotating tanks for, the standard answer is that rotation of the tank simulates rotation of the Earth. Which is of course true, but it is not really satisfying because it doesn’t really convey the profound effect that rotation has on the behaviour of the ocean and atmosphere, which is actually very easy to show in a quite dramatic way (at least I think it’s dramatic ;-)).

Imagine a cylindrical tank filled with fresh water. In its middle, we place a (bottom-less) cylinder filled with dyed, salty water. When we lift the cylinder out of the tank, the blue dye is released into the freshwater. And depending on whether the tank is rotating or not, the blue water behaves very differently.

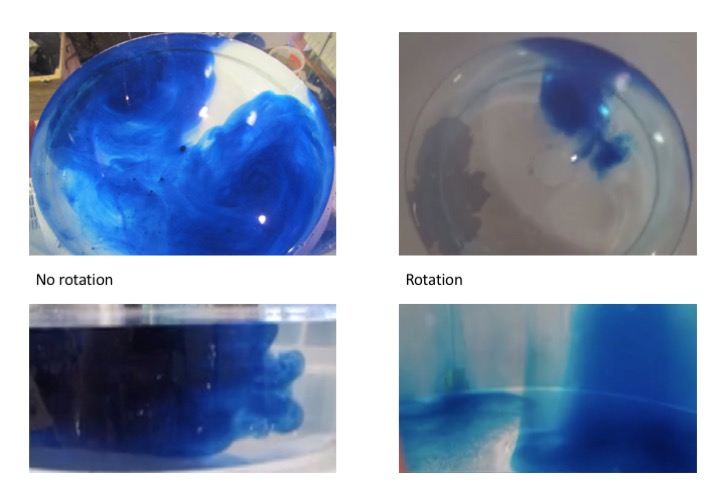
The picture below shows top views and side views of a non-rotating and a rotating experiment, taken after similar amounts of time after the “release” of the blue water.

Let’s focus on the top view first. In the non-rotating experiment, a dipole of two counter-rotating eddies develops within seconds of the central dense column being released, spreading blue water pretty much all throughout the tank. In the rotating experiment, after a similar amount of time, the dipole looks different: Even though the same amount of dyed water was released, the two eddies are much smaller and much more well-defined.

In the side view, the difference becomes even more clear. In the non-rotating experiment, looking at the boundary between the blue and clear water, we see eddies moving water in all directions, so in combination with the top view, we know that turbulence is three-dimensional.

In the rotating experiment, however, the boundary between blue and clear water looks very different. There is a clear separation between a blue column of water and the clear water surrounding it. From the side view, we don’t see any turbulence. We know, however, from the top view that there is turbulence in the horizontal plane. In the rotating case, turbulence is two-dimensional.

And this is the dramatic difference between rotating and non-rotating fluids: rotating fluids are rigid in a way that non-rotating fluids are not. And this means that they behave in fundamentally different ways: rather than developing in 3 dimensions, they only develop in 2 dimensions. So in order to simulate the atmosphere and ocean of the rotating earth correctly, we need to also rotate our water tank.

P.S.: Images for this post were originally posted in this post (and in other posts linked therein) 5 years ago. Hoping we’ll have new images soon when our new tanks are up and running! :-)

Tidal mixing on a (fjord’s) sill

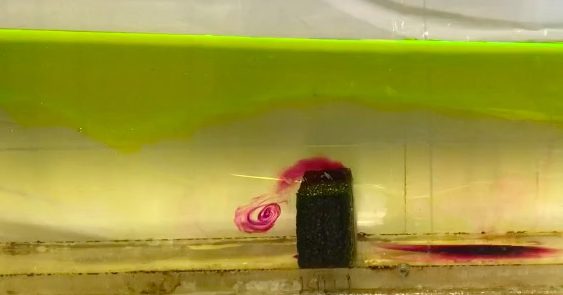
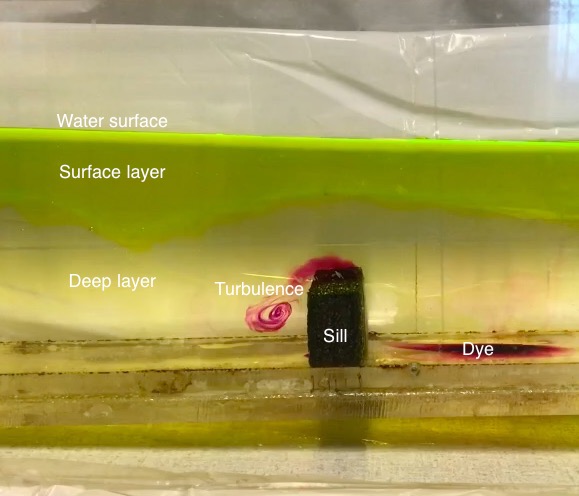
A pink swirl going across a styrofoam block underneath a layer of yellow water? What’s going on here?

The picture was taken in a water tank, simulating the circulation of water masses in a fjord. A fjord is a long and narrow bay, usually with a sill that is separating the bay from the open ocean. And those sills play an important role in on the one hand preventing water exchange between the fjord and the open ocean (because everything below sill depth has a really hard time getting across the sill) and on the other hand mixing water masses inside and outside of the fjord (which we see visualized with the pink dye).

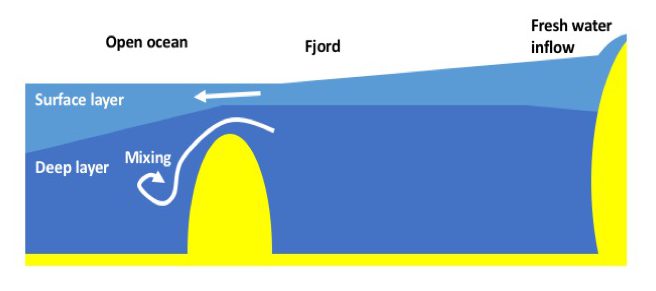
And here is why the sill is so important: Every time the tide goes in or out of the fjord (so pretty much all the time), the sill acts as an obstacle to the water that wants to go in or out. And flow across a ridge tends to create mixing downstream of the ridge.

In the picture below, we see a sketch of the situation in an outgoing tide, which is what we also see represented in the photo above: Water wants to push out of the fjord and has to accelerate to get through the much smaller cross section where the sill is located. This leads to strong currents and strong mixing “downstream” of the obstacle.

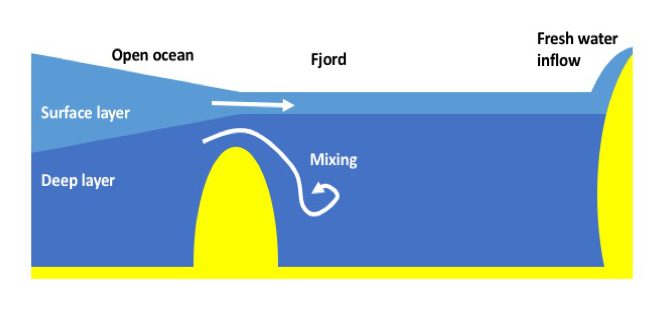
Except that “downstream” is on the other side of the sill only a couple of hours later, when the tide is pushing water into the fjord, but is again hindered by the sill.

So what is happening is this: The tidal current goes in and out, and mixing occurs on one or the other side of the sill. So the situation looks like this:

This is what that looks like in our tank (the “tidal waves” are generated by lifting the right end of the tank and then just slushing back and forth):

Of course, in reality we don’t see pink swirls, and the surface layer isn’t a different color from the deep layer, either. But that’s why tank experiments are so cool: They show us what’s going on deep below the waves, that we can otherwise only deduce from complicated measurements of temperatures, salinities or mixing rates, which require highly specialized equipment, a research ship, and lots of technical know how to process and analyse and display. Which, of course, is also being done, but this demonstration gives a quick and easy visual representation of the processes at play at sills all around the world.

P.S.: The photos in this blog post were taken when I ran the fjord circulation experiment with Steffi and Ailin at GFI earlier this year. I am posting about this again now because I wanted to use the picture for other purposes and realized that I never actually wrote about this feature in as much detail as it deserves!


Demonstrating Ekman layers in a rotating tank: High pressure and low pressure systems!

Ekman spirals — current profiles that rotate their direction over depth, caused by friction and Coriolis force — are really neat to observe in a rotating tank. I just found out that they are apparently (according to Wikipedia) called “corkscrew currents” in German, and that’s what they look like, too. I tend to think of Ekman spirals more as an interesting by-product that we observe when stopping the tank after a successful experiment, but they totally deserve to be featured in their own experiments*.

Ekman layers form whenever fluid is moving relative to a boundary in a rotating system. In a rotating tank, that is easiest achieved by moving the boundary relative to the water, i.e. by increasing or decreasing the rotation rate of a tank and observing what happens before the water has adjusted to the new rotation and has reached solid body rotation. Spinning the tank up or down creates high and low pressure systems, respectively, similar to atmospheric weather system.

Creating a low-pressure system: Slowing down the tank

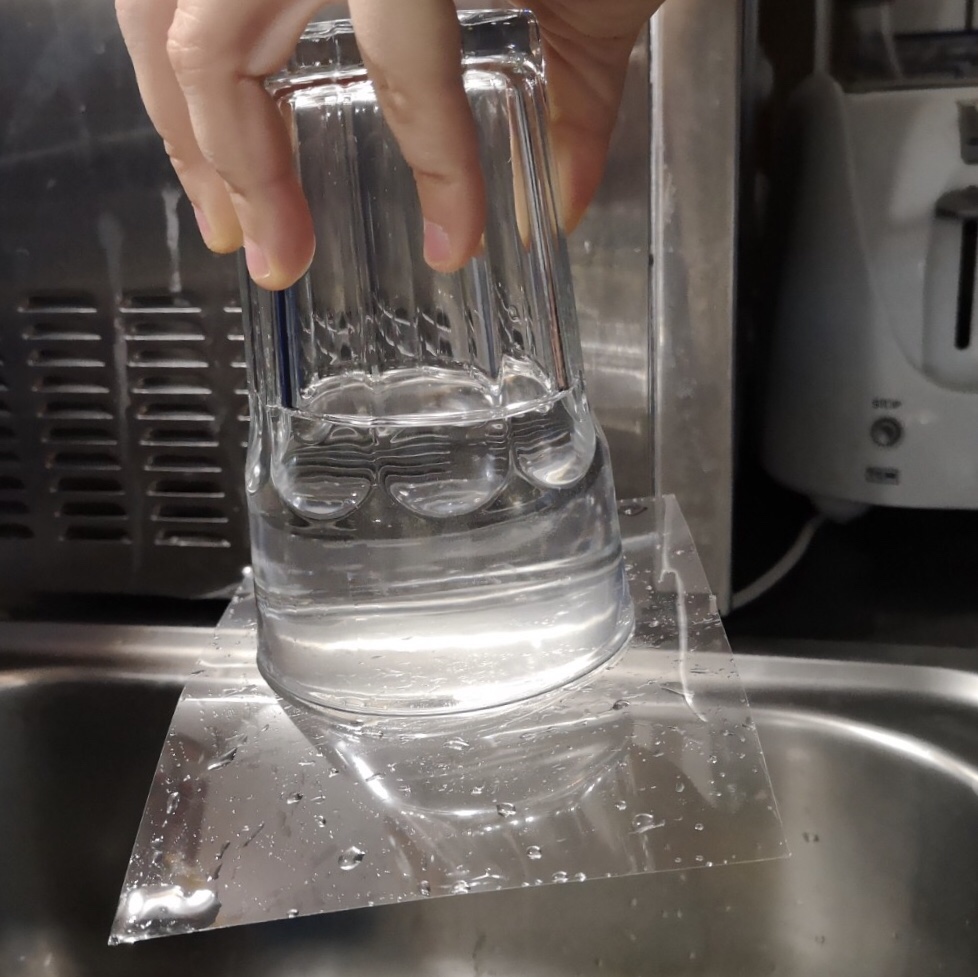
In atmospheric low pressure systems, air moves towards the center of the low pressure system, where it rises, creating the low pressure right there. This situation can probably easiest be modelled by stirring a cup of tea that has some tea leaves still in it. As the surface deforms and water bunches up at the sides, an overturning circulation is set into motion. Water sinks along the side walls and flows towards the center of the cup near the bottom. From there it rises, but any tea leaves or other stuff floating around get stuck in the middle on the bottom because they are too heavy to rise with the current. So there you have your low pressure system!
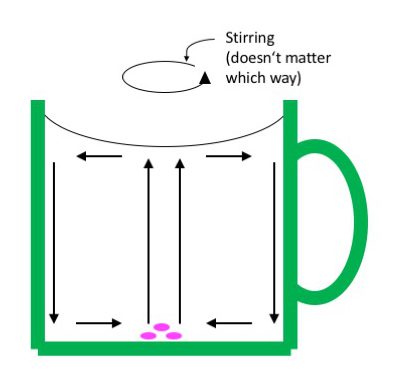
You can observe the same thing with a rotating tank, except now we don’t stir. The tank is filled with water and spun up to solid body rotation on the rotating table. When the water is in solid body rotation, a few dye crystals are dropped in, leaving vertical streaks as they are sinking to the ground (left plot in the image below).

Then the tank is slowed down. The resulting friction between the water body and the tank creates a bottom Ekman spiral. The streaks of dye that were left when the dye crystals were dropped into the tank move with the water when the tank is slowed down. In the upper part of the tank, the dye stripes stay vertical. But at the bottom, within the Ekman layer, they get deformed as the bottom layer lifts up, and thus show us the depth over which the water column is influenced by bottom friction (see black double arrow in the right plot in the picture below). Again, we have created a low pressure system with a similar overturning circulation as we saw in the tea cup.
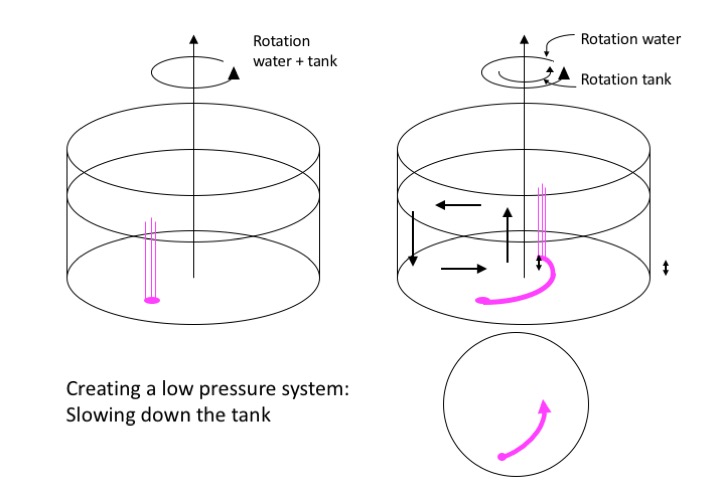
In the bottom right corner of the image above, we see a top view of the tank with the trajectory the dye is taking from the spot where it rested on the ground before the rotation of the tank changed.

Looking into the tank with a co-rotating camera, we can also observe the Ekman depth, i.e. the depth that is influenced by the bottom: We see a clear distinction between the region where the dye streaks from the falling crystals are still vertical and the bottom Ekman layer, where they are distorted, showing evidence of the friction with the bottom.

So this was what happens when water is spinning relativ to a slower tank (or a non-rotating cup) — the paraboloid surface is adjusting to one that is more even or completely flat. But then there is also the opposite case.

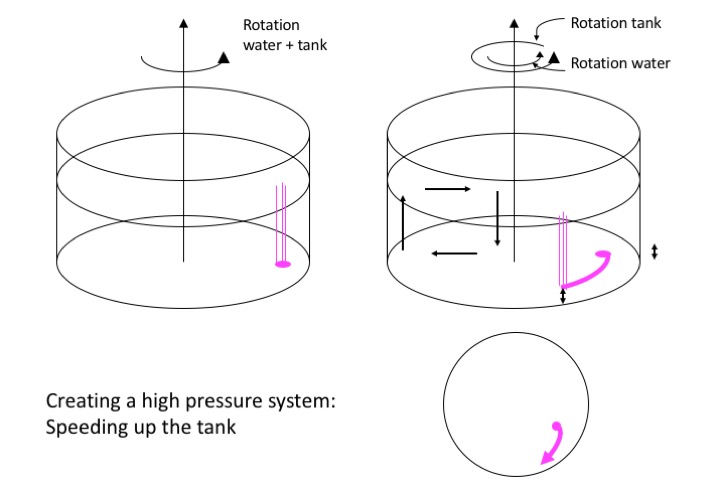
Creating a high-pressure system: Spinning up the tank

If we take water that is at rest and start spinning the tank (or spin a moving tank faster suddenly), we create a high pressure system until we again reach solid body rotation.

Again, we dropped dye crystals when the water was in solid body rotation (or in solid body without rotation) before we start the spinup, as we see in the left plot below.

Now the sudden spinning of the boundaries relative to the body of water creates a high pressure system with the bottom flow outward from the center, which again we see in the deformation of the dye streaks. The Ekman depth is again the depth over which the dye streaks get bent, below the water column that isn’t influenced by friction where they still have their original vertical shape.

In the bottom right corner of the image above, we see a top view of the tank with the trajectory the dye is taking from the spot where it rested on the ground before the rotation of the tank changed.

Here is what this experiment looks like in a movie:

So here we have it. High pressure and low pressure systems in a tank!

*Which I actually did before, both in a rotating tank as well as on a Lazy Susan.
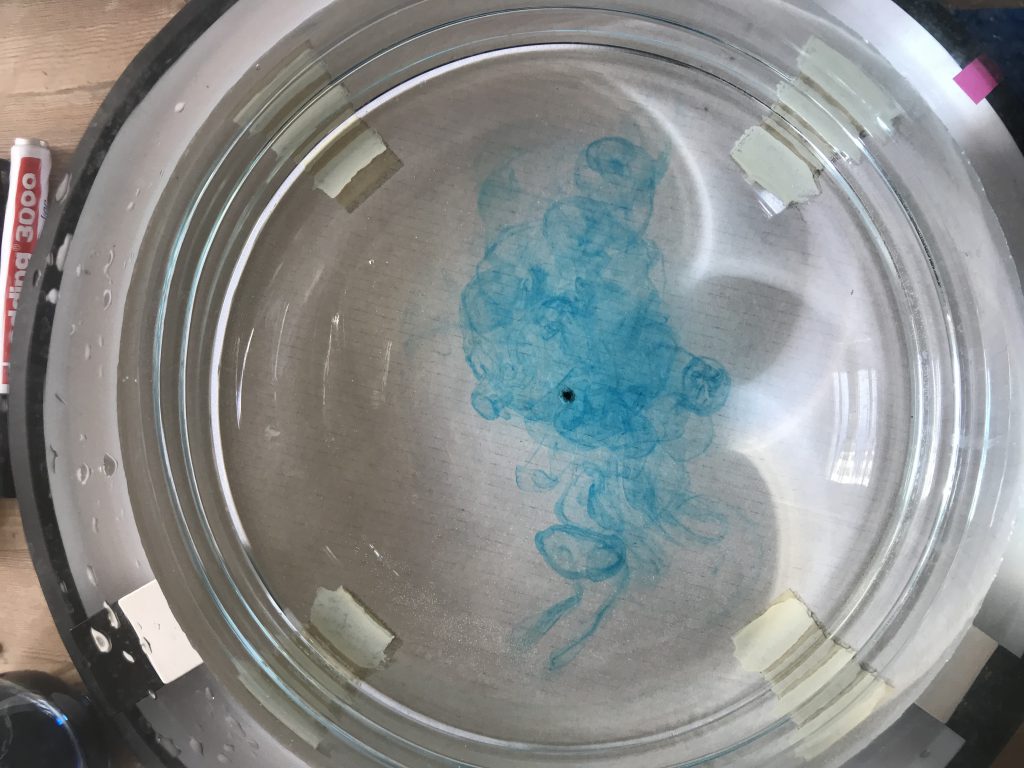
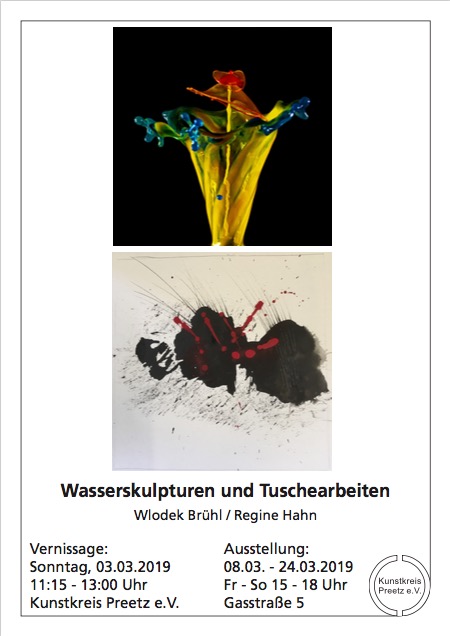
Vernissage of water sculpture photography by Wlodek Brühl, with explanations of the physics behind the pictures by yours truly!

I am a huuuge fan of Wlodek Brühl’s liquid art: Pictures of water sculptures that are created with focus on the tiniest of details, that only persist for milliseconds, but that are captured forever in all their fragile beauty. And I think these pictures are an awesome tool in science communication — I see so much physics in them (some of which I wrote about here already), and even if you come to an exhibition for the art, who wouldn’t love to learn some physics while they were there, too?

Well, we are about to find out! There is a new exhibition being opened (with brand new pictures!) on March 3rd in Preez. And I will actually give the opening speech for the liquid art half of the exhibition! I haven’t seen all the pictures yet so I can’t tell you exactly what I will be talking about, but whatever I say will definitely have to involve lots of fun physics :-)

Click for pdf