Category Archives: observation

Same wind, different waves, or: the influence of fetch length on the size of waves

I just found this picture that I took back in May near my friend Elin’s cabin on an island in western Norway, and it’s a really nice illustration of how the same wind will cause very different waves depending on whether it’s blowing over the sea for many kilometres, or over a puddle for only a couple of centimetres.

Did you know that uranine starts fluorescing again when the ice cubes melt?

Yes, I had to test that! :-D

Top pic: Ice cubes (left) and leftover uranine solution from when I was preparing those ice cubes Bottom left pic: Melting the ice cubes in a water bath to see if they start glowing again when melting. Bottom right pic: Yes, they do! :-)

Top pic: Ice cubes (left) and leftover uranine solution from when I was preparing those ice cubes Bottom left pic: Melting the ice cubes in a water bath to see if they start glowing again when melting. Bottom right pic: Yes, they do! :-)

Why do I find this exciting? Because that means that a phase change of the water switches fluorescence as a tracer of that water on and off. Or the other way round: Seeing water fluoresce (or not) tells you what state the water is in without having to figure out anything else about that water.

…and funny how that the apprenticeship as chemical technician that I started in parallel to finishing high school (and didn’t finish because other stuff — oceanography — became more interesting) does come into play in the most unexpected moments :-)

Did you know uranine doesn’t fluoresce when frozen?

Something else I found out when checking on my ice cubes yesterday:

I had frozen a second tray* with ice cubes dyed with uranine (you know, the green stuff I found in the lake near my house the other day?). Like the other ones, they clearly froze back-of-the-freezer-forward, and the most interesting thing to me: Only the parts that weren’t frozen were fluorescing in the fridge!

For comparison, here a picture of the leftover water (so same dye concentration as the ice cubes) in the beaker, and the tray with frozen ice cubes next to it. You can see the beam of the UV lamp on the table* so you believe me that the ice cubes were lit with UV light, too, they just don’t fluoresce!

*Ailin and Steffi, did you see I got you a gold colored ice cube tray? :D Although, had I thought that I would be looking at the ice cubes themselves this much, I would probably have gotten two whites instead of a white and a gold one… But now you at least have a pretty ice cube tray in the lab :-)

**and a stain that I am only now noticing, but it wasn’t me; I was working super carefully since today I am not dressed for the lab and I don’t want that stuff on my clothes!

Why are they so much slower than I thought? Observing the group velocity vs phase velocity of waves

Have you ever seen a speedboat drive past, looked at its wake moving torwards you, then gotten distracted, and when you look back a little while later been surprised that the wake hasn’t moved as far towards you as you thought it would have during the time you looked away?

Well, I definitely have had that happen many times, and the other day I was sitting on the beach with a friend and we talked about why you initially perceive the waves moving a lot faster than they turn out to be moving in the end. While I didn’t film it then, I’ve been putting my time on the GEOF105 student cruise to good use to check out waves in addition to the cool research going on on the cruise, so now I have a movie showing a similar situation!

But let’s talk a little theory first.

Phase velocity

The phase velocity of a wave is the speed with which you see a wave crest moving.

Waves can be classified into long vs short waves, or deep- vs shallow water waves. But neither deep and shallow, nor long and short are absolute values: They refer to how long a wave is relative to the depth of the water in which it is moving. For short or deep water waves, the wavelength is short relative to the water depth (but can still be tens or even hundreds of meters long if the water is sufficiently deep!). For long or shallow water waves, the wave length is long compared to the water depth (for example Tsunamis are shallow water waves, even though the ocean is on average about 4 km deep).

For those long waves, or shallow water waves, the phase velocity is a function of the water depth, meaning that all shallow water waves all move at the same velocity.

However, what you typically see are deep water waves, and here things are a little more complicated. Since phase velocity depends on wave length, it is different for different waves. That means that there is interference between waves, even when they are travelling in the same direction. So what you end up seeing is the result of many different waves all mixed together.

If you watch the gif below (and if it isn’t moving just give it a little moment to fully load, it should then start), do you see how waves seem to be moving quite fast past the RV Harald Brattstrøm, but once you focus on individual wave crests, they seem to get lost, and the whole field moves more slowly than you initially thought?

That’s the effect caused by the interference of all those waves with slightly different wave lengths, and it’s called the group velocity.

Group velocity

The group velocity is the slower velocity with which you see a wave field propagate. It’s 1/2 of the phase velocity, and it is the velocity with which the signal of a wave field actually propagates. So even though you initially observed wave crests moving across the gif above fairly quickly, the signal of “wave field coming through!” only propagates with half the phase velocity.

Usually you learn about phase and group velocities in a theoretical way and are maybe shown some animations, but I thought it was pretty cool to be able to observe it “in situ!” :-)

At the end of the rainbow you’ll find … home-made surface drifters

For Lars Henrik and Harald‘s GEOF105 class we are deploying home-made surface drifters on the student cruise. Today I had the opportunity to join the cruise again, and since the weather today made for beautiful pictures, I just have to share them here.

First, at the end of every rainbow, as we all know, you’ll find … home-made surface drifters!

Inga and Algot getting the drifters ready for deployment

Inga and Algot getting the drifters ready for deployment

The research ship we are on is the Hans Brattstrøm — cosy ship with a super nice and helpful crew!

We are sailing on RV Hans Brattstrøm

We are sailing on RV Hans Brattstrøm

The drifters themselves are equipped with a sea anchor made from a plastic bucket and four paint roller trays underneath a buoy, and then on top all kinds of equipment to make sure nobody runs over it: A safety flag, a lamp, a radar reflector. And, of course, the GPS sender!

Isn't it cool how those wave rings radiate from our drifter?

Isn’t it cool how those wave rings radiate from our drifter?

What we are using those surface drifters for? To determine the circulation in the fjord right outside Bergen. There are several things that might have an influence: Tides, wind, freshwater runoff from the land… And a tilted sea surface (although it is probably not as tilted as in the picture below…)

Drifter in front of RV Hans Brattstrøm in front of mountains covered in clouds

Drifter in front of RV Hans Brattstrøm in front of mountains covered in clouds

Another amazing day “at sea”, thanks for having me along, Lars Henrik!

Drifter in front of RV Hans Brattstrøm

Drifter in front of RV Hans Brattstrøm

Taking water samples

A big part of any oceanographic research cruise: Taking water samples.

Here is a group of students practicing how to arm Niskin bottles that will go into the ocean open on both ends, and that will then, when the whole rosette is on its way up again, be closed one after another at depths that promise to be interesting in terms of water properties.

Arming those Niskin bottles is actually not as easy as it looks, there is a strong spring going through the bottle, connecting the lids. And it is actually pretty painful if you accidentally close the bottles while some part of your body is between the bottle and the lid. Ask me how I know…

When the bottles are all open, the rosette can be lifted off the deck and into the sea.

Usually, rosettes are equipped with instrumentation in addition to the Niskin bottles, usually a CTD, measuring conductivity (to calculate the salinity from), temperature, and depth (actually measuring pressure, which converts easily into depth). I contributed to a very nice movie about how CTDs work a couple of years ago, check it out!

And now the rosette is finally in the water.

Water samples in physical oceanography are mainly used to calibrate the sensors on the CTD, which give (pretty much) continuous measurements throughout the whole depth of the water column. And that’s also what we want to use our water samples for — we have a hand-held conductivity probe that is right now producing values that cannot be correct. How we are going to deal with that? We (and you!) will find out tomorrow! :-)

Home-made surface drifters

A bicycle safety flag, a plastic bucket, four paint roller trays — what are those people doing there?! Until now this might almost count as kitchen oceanography!

Home-made surface drifters

But it’s only almost kitchen oceanography; at least my kitchen isn’t usually stocked with GPS trackers, which is what is mounted on this contraption. Let alone the research ship we used to deploy it. So this must surely count as real oceanography then!

Lars Henrik and students deploying a surface drifter to measure the surface current in a fjord

Lars Henrik and students deploying a surface drifter to measure the surface current in a fjord

Above, you see  Lars Henrik and his students deploying a surface drifter. The red buoy keeps it floating at the surface, the chain hanging below is heavy enough to make sure it stays upright. The bucket and four paint roller trays act as sea anchor so the whole thing moves with the water rather than being blown about by the wind. A safety flag, radar reflector and light make sure nobody accidentally sails over it, and the GPS sender lets the position be tracked.

For example like this:

Screen shot of the map and the drifter positions from my mobile phone

Screen shot of the map and the drifter positions from my mobile phone

Above, you see what it looked like when we had already deployed three of our four surface drifters (the red ones that are moving so slowly that the software tells us they aren’t moving at all), while the fourth one is still onboard the ship, moving to the position where it will be deployed (the green one moving at 3km/h).

Follow their positions on your mobile device!

Following surface drifters’ paths in real time is pretty awesome in itself, but what makes it even better is that the GPS positions can be accessed online from any device. Below, for example, you see the positions on my phone with the drifters behind it in the water (if you look really closely, that is. But they were there!).

My mobile phone with the drifters' positions and the drifters in the background

My mobile phone with the drifters’ positions and the drifters in the background

What you also see is that three of the drifters have huddled together after a couple of hours out in the fjord. Nobody really knows why yet, but that’s what we are here to find out!

Just from observing the wind and the movement of the drifters throughout the day, it seemed that the surface circulation in this fjord is dominated by the wind over the tides. But there will be a Master’s thesis written on the data we collected today (plus a lot more data and a regional ocean model!) so we’ll soon know how good my assumptions are and what really drives the surface currents here.

Three of the drifters huddling together due to currents that have yet to be understood

Three of the drifters huddling together due to currents that have yet to be understood

Come time to recover the drifters, the weather wasn’t quite as nice as earlier throughout the day. Just to give you an impression of the conditions under which the drifters were recovered:

Algot and Inga recovering a drifter

Algot and Inga recovering a drifter

Yep, if you look at the sea state, there is nothing to complain about, really, just a little water coming from the sky! But it was cold water… ;-)

And everything got recovered safely and made it back to port — ready to be deployed again tomorrow to gather more data and understand the fjord a little better. Exciting times! Thanks for letting me be part of this GEOF105 adventure, Lars Henrik!

The drifters coming home to the port of Bergen

The drifters coming home to the port of Bergen

Rainbows in regnbyen Bergen

Yesterday when approaching Bergen airport, I saw something super cool: The lower half of a rainbow!

Even though I grabbed my phone and snapped a picture in record time, I didn’t manage to capture it. Bummer! But that doesn’t keep me from writing about it while showing you a “normal” rainbow I took a picture of a couple of minutes later.

Rainbow seen from a plane approaching Bergen airport

Rainbow seen from a plane approaching Bergen airport

Have you ever seen the lower half of a rainbow?

But can you imagine it? A u-shaped rainbow?

Have you ever seen anything like that before? It’s not something that we are used to seeing, at least not if we are looking a) at rainbows that are occurring on natural rain “curtains” and b) while we are on the ground. Let me explain…

Under perfect conditions, a rainbow is a full circle

Imagine you are a floating in space, looking at a curtain of rain drops. The sun is shining from behind you onto that curtain. What you then see on that rain curtain is a full rainbow circle, purple towards the middle and red towards the outside.

The size of the rainbow depends on how far away from the rain curtain you are. Imagine looking at the shadow that your head is making on the rain curtain. The line from your eyes to the shadow of your head will be our reference. Now imagine looking at any point on the rainbow. The line from your eyes to any point on the rainbow will be at a 40 to 42 degree angle to the reference line (40 degrees if you are looking at a purple point, 42 if you are looking at a red point, anything in between for the other colors).

Tweaking the size of the rainbow

Now imagine moving the rain curtain farther away. The angle between the reference line and the line to the rainbow stays the same, but the further away the rain curtain, the larger the rainbow. And vice versa: The closer the rain curtain, the smaller the rainbow!

So now imagine a nice curtain of droplets that you can walk towards and away from (sprinklers! garden hoses!) — the further you walk away, the larger the rainbow gets. And the closer you come, the more it shrinks again.

Standing on the ground, you only see the upper half

If you walk close enough to the rain curtain, you can actually see a full rainbow. But typically when we think of rainbows, we think of those occurring naturally, and then the rain curtains aren’t as neat and tidy as those from a sprinkler, and rainbows that we see are usually far far away, and thus really big. And that is why we aren’t used to seeing the lower half of a rainbow: Where the lower half would be there isn’t any rain curtain for it to appear on, because there is ground there! And the only way not to have the rainbow hit the ground is either have it close enough in front of us so it’s too small to even reach the ground, or to look at it from a plane that is high enough above the ground that even a large rainbow has enough space above the ground to fully appear on the rain curtain.

Next steps

So where do we go from here? I need to a) play with sprinklers and take pictures of rainbows! b) draw illustrations of the stuff I tried to describe above, and c) hope that I’ll be faster next time to finally get my u-shaped rainbow picture from a plane!

Balances of dyed and un-dyed waters

Oh look, a plume of (almost) un-dyed water hitting the green lake!

I am really fascinated by the balance between green water leaking out of the pipeline and into the rain drainage, the rain falling on the lake, and the rain water coming into the lake through the rain drainage system. Right now, the water coming out of the drainage is a lot less green than the water in the lake, which is itself being diluted by rain. So much so that you can see a clear plume entering before it is mixed so much, entraining so much lake water, that you loose track of it in the green.

This makes me think about all kinds of stuff: how long between it raining on the catchment area that drains into the lake and the water actually reaching it? And how large might the catchment area be relative to the area of the lake (i.e. how large are the respective influences on the color)? So much entertainment just stemming from a little green dye :)

The first autumn storm and its impact on dye tracer and water level

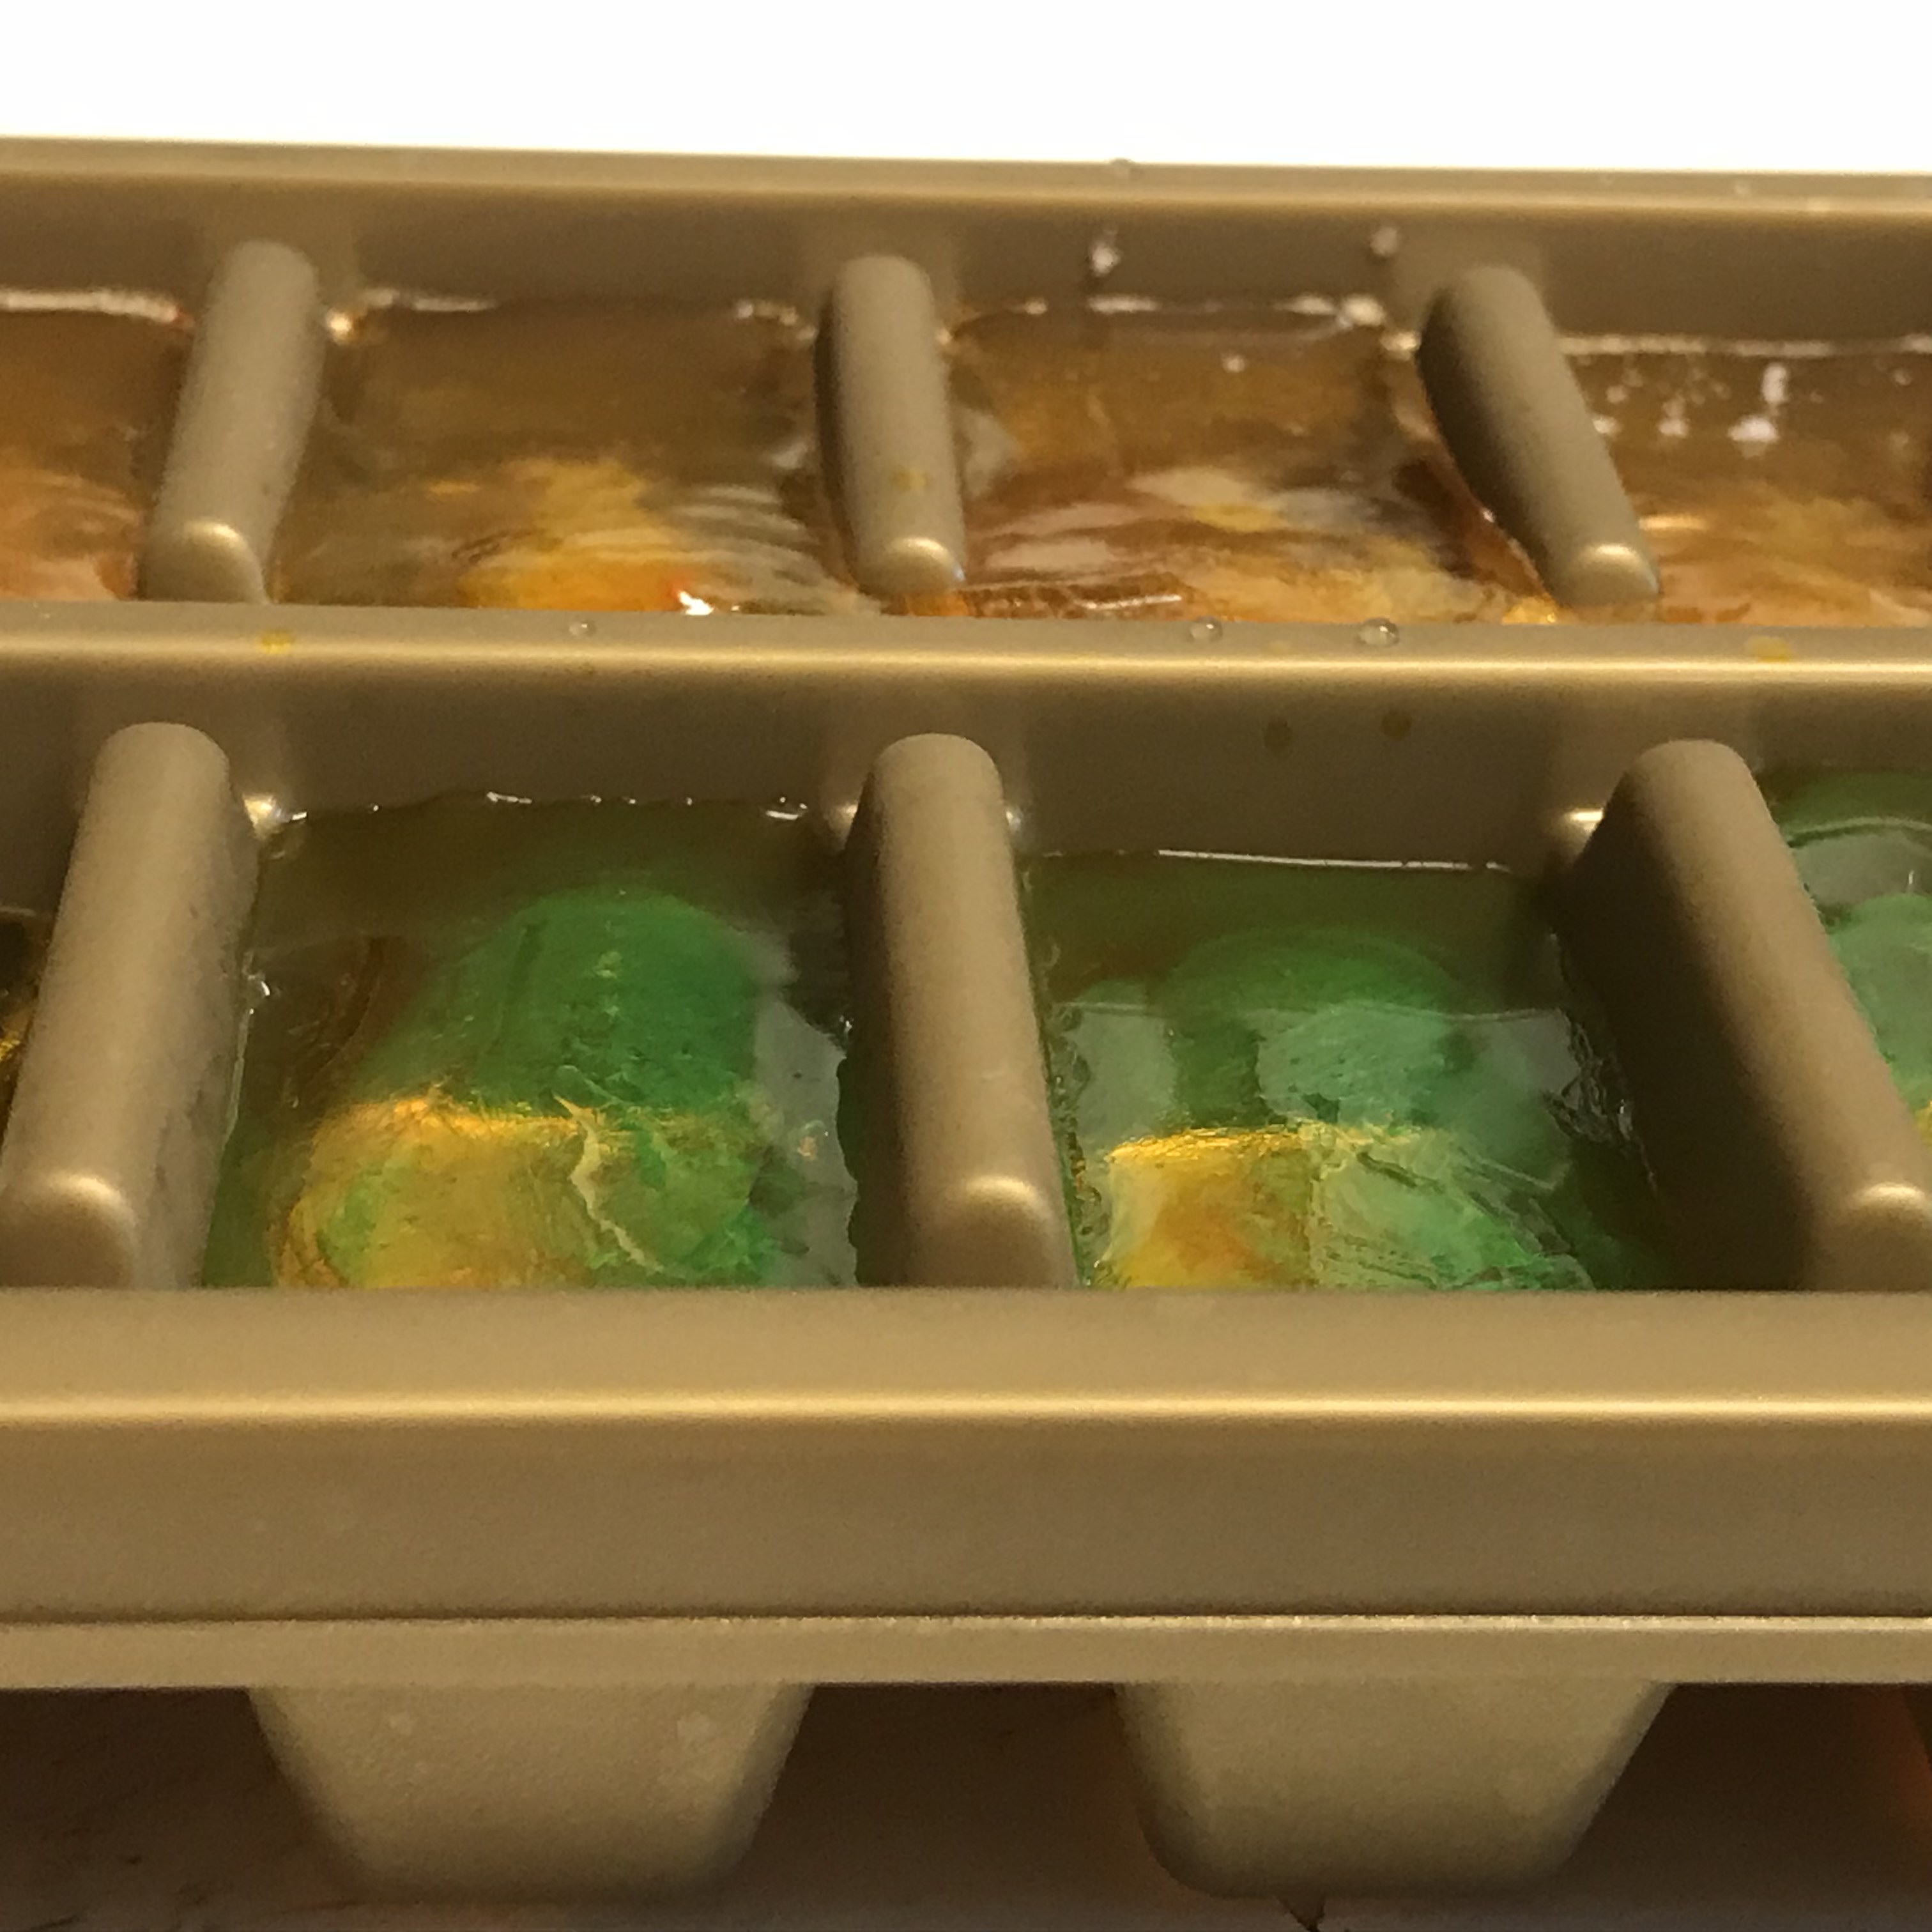
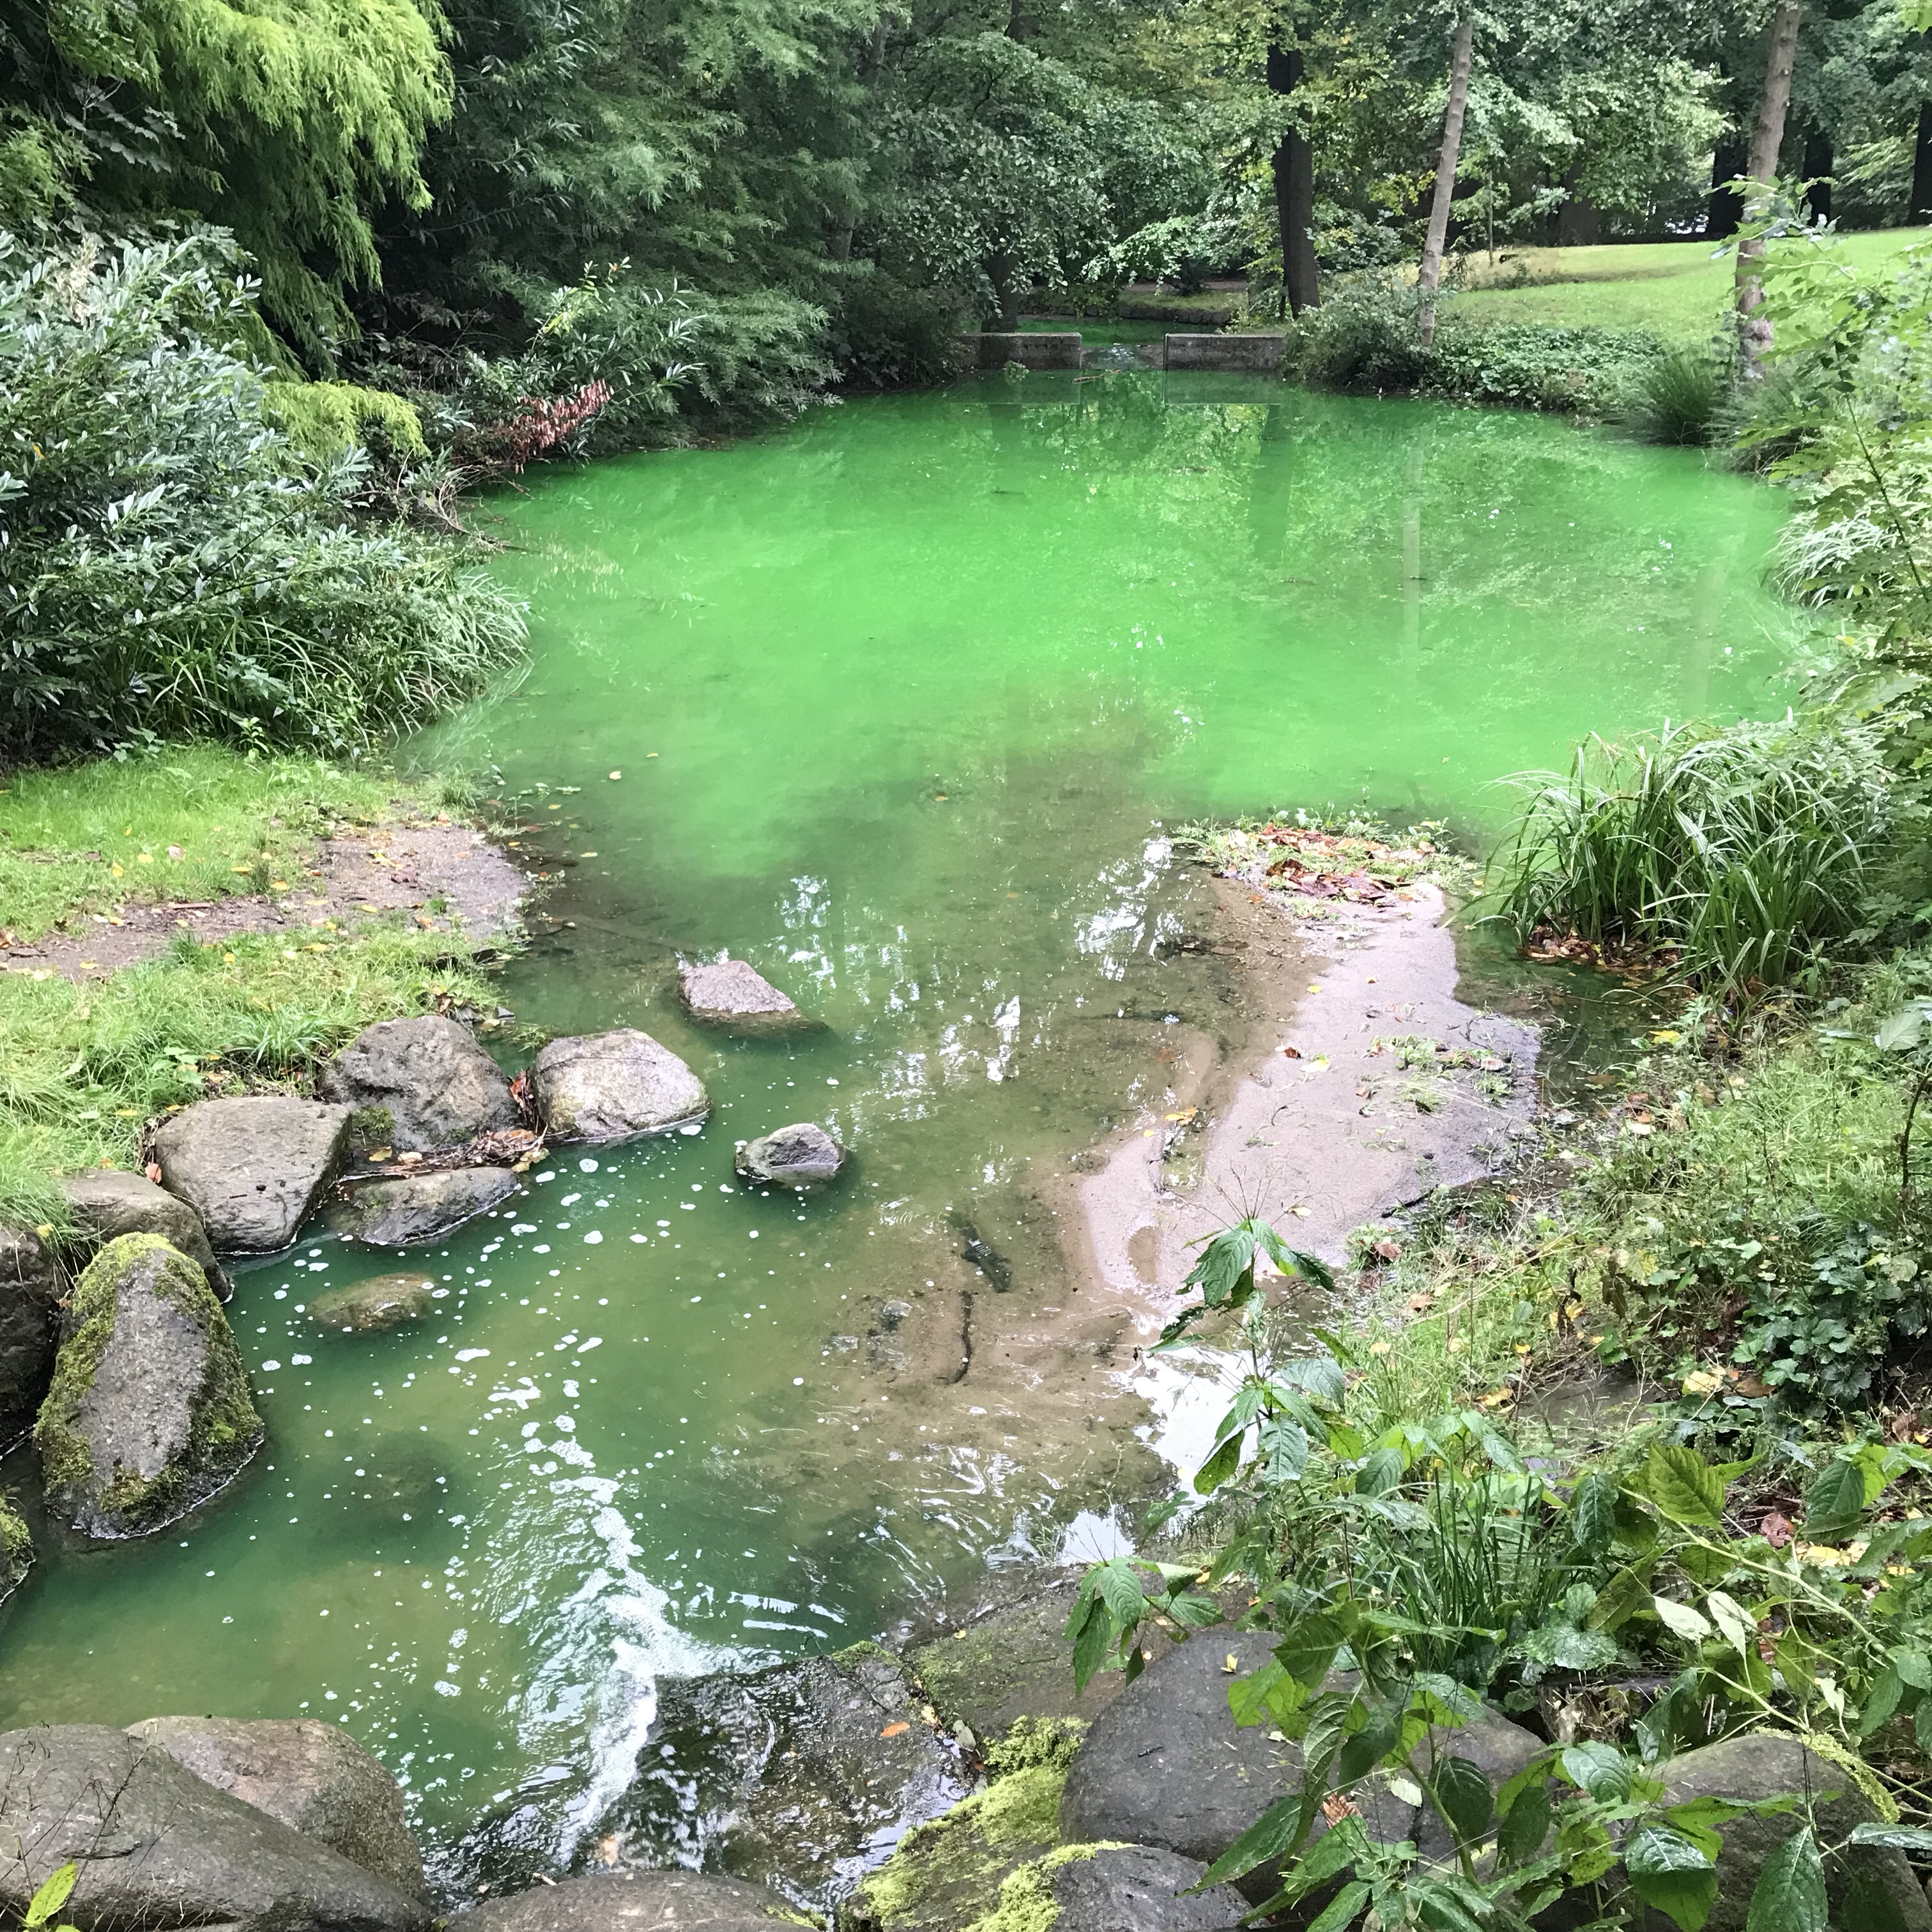
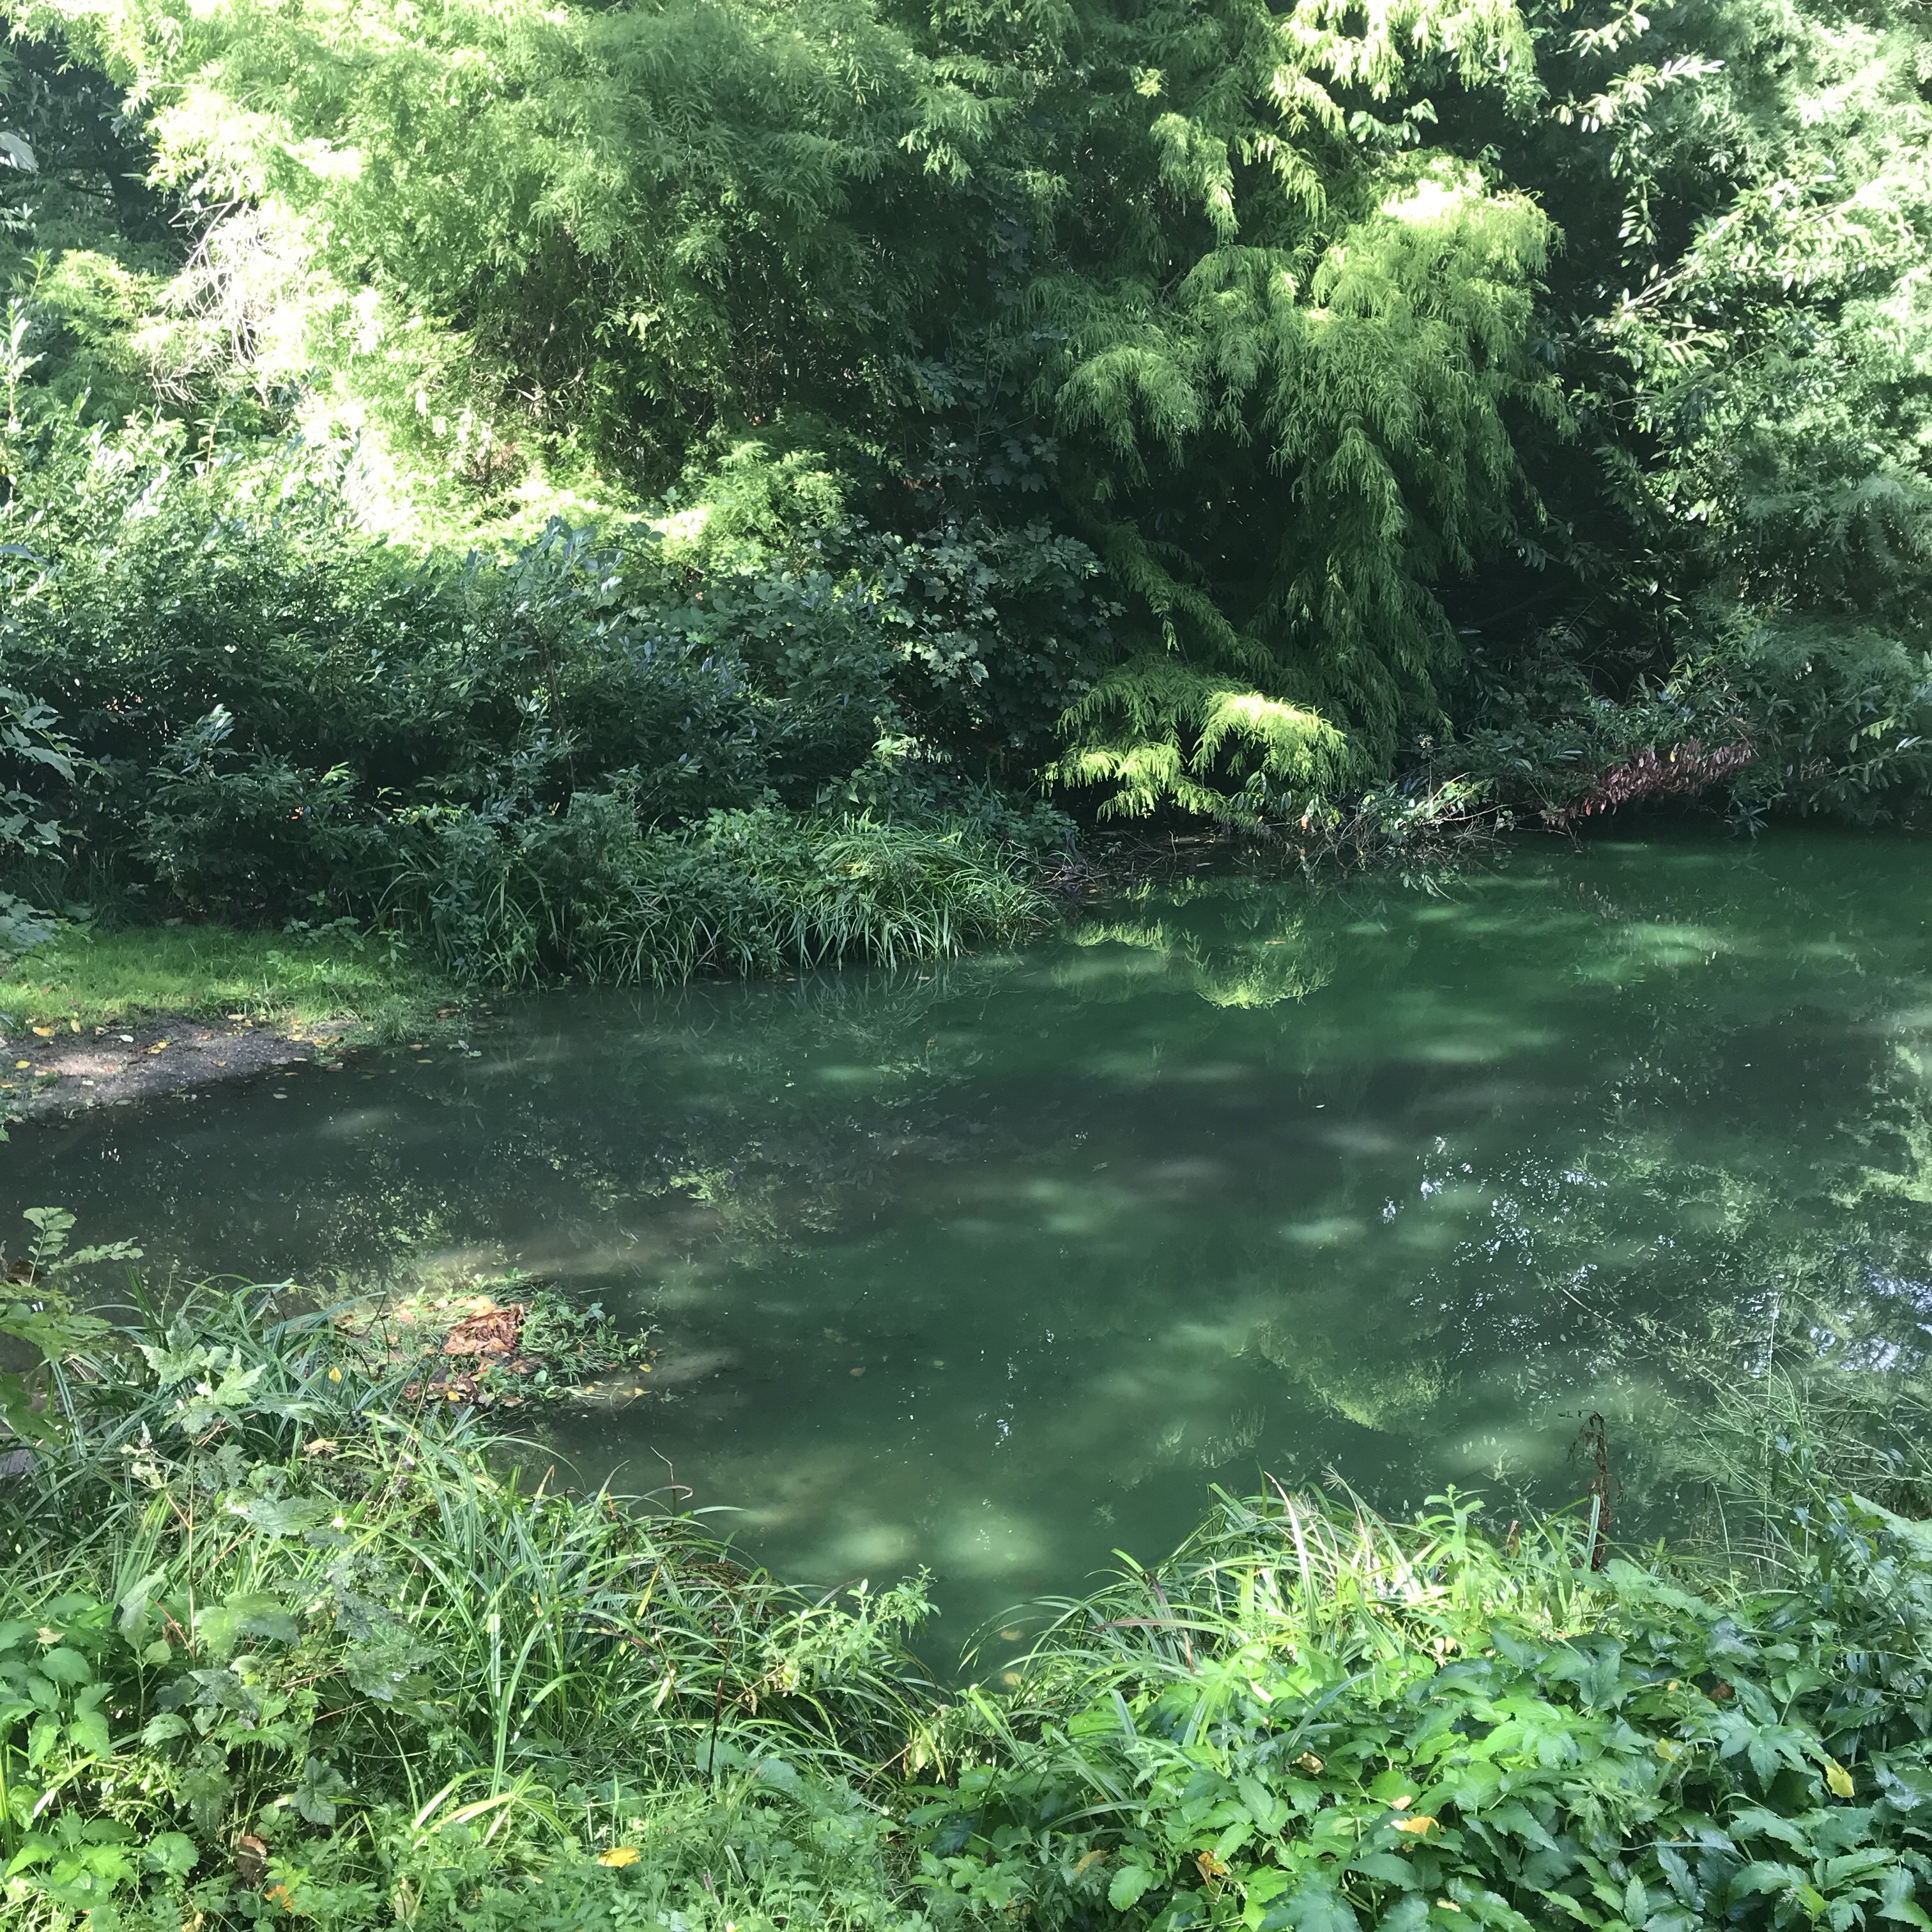
Last night it rained a lot. So the first thing to do this morning was to check what that had done to my green lake!

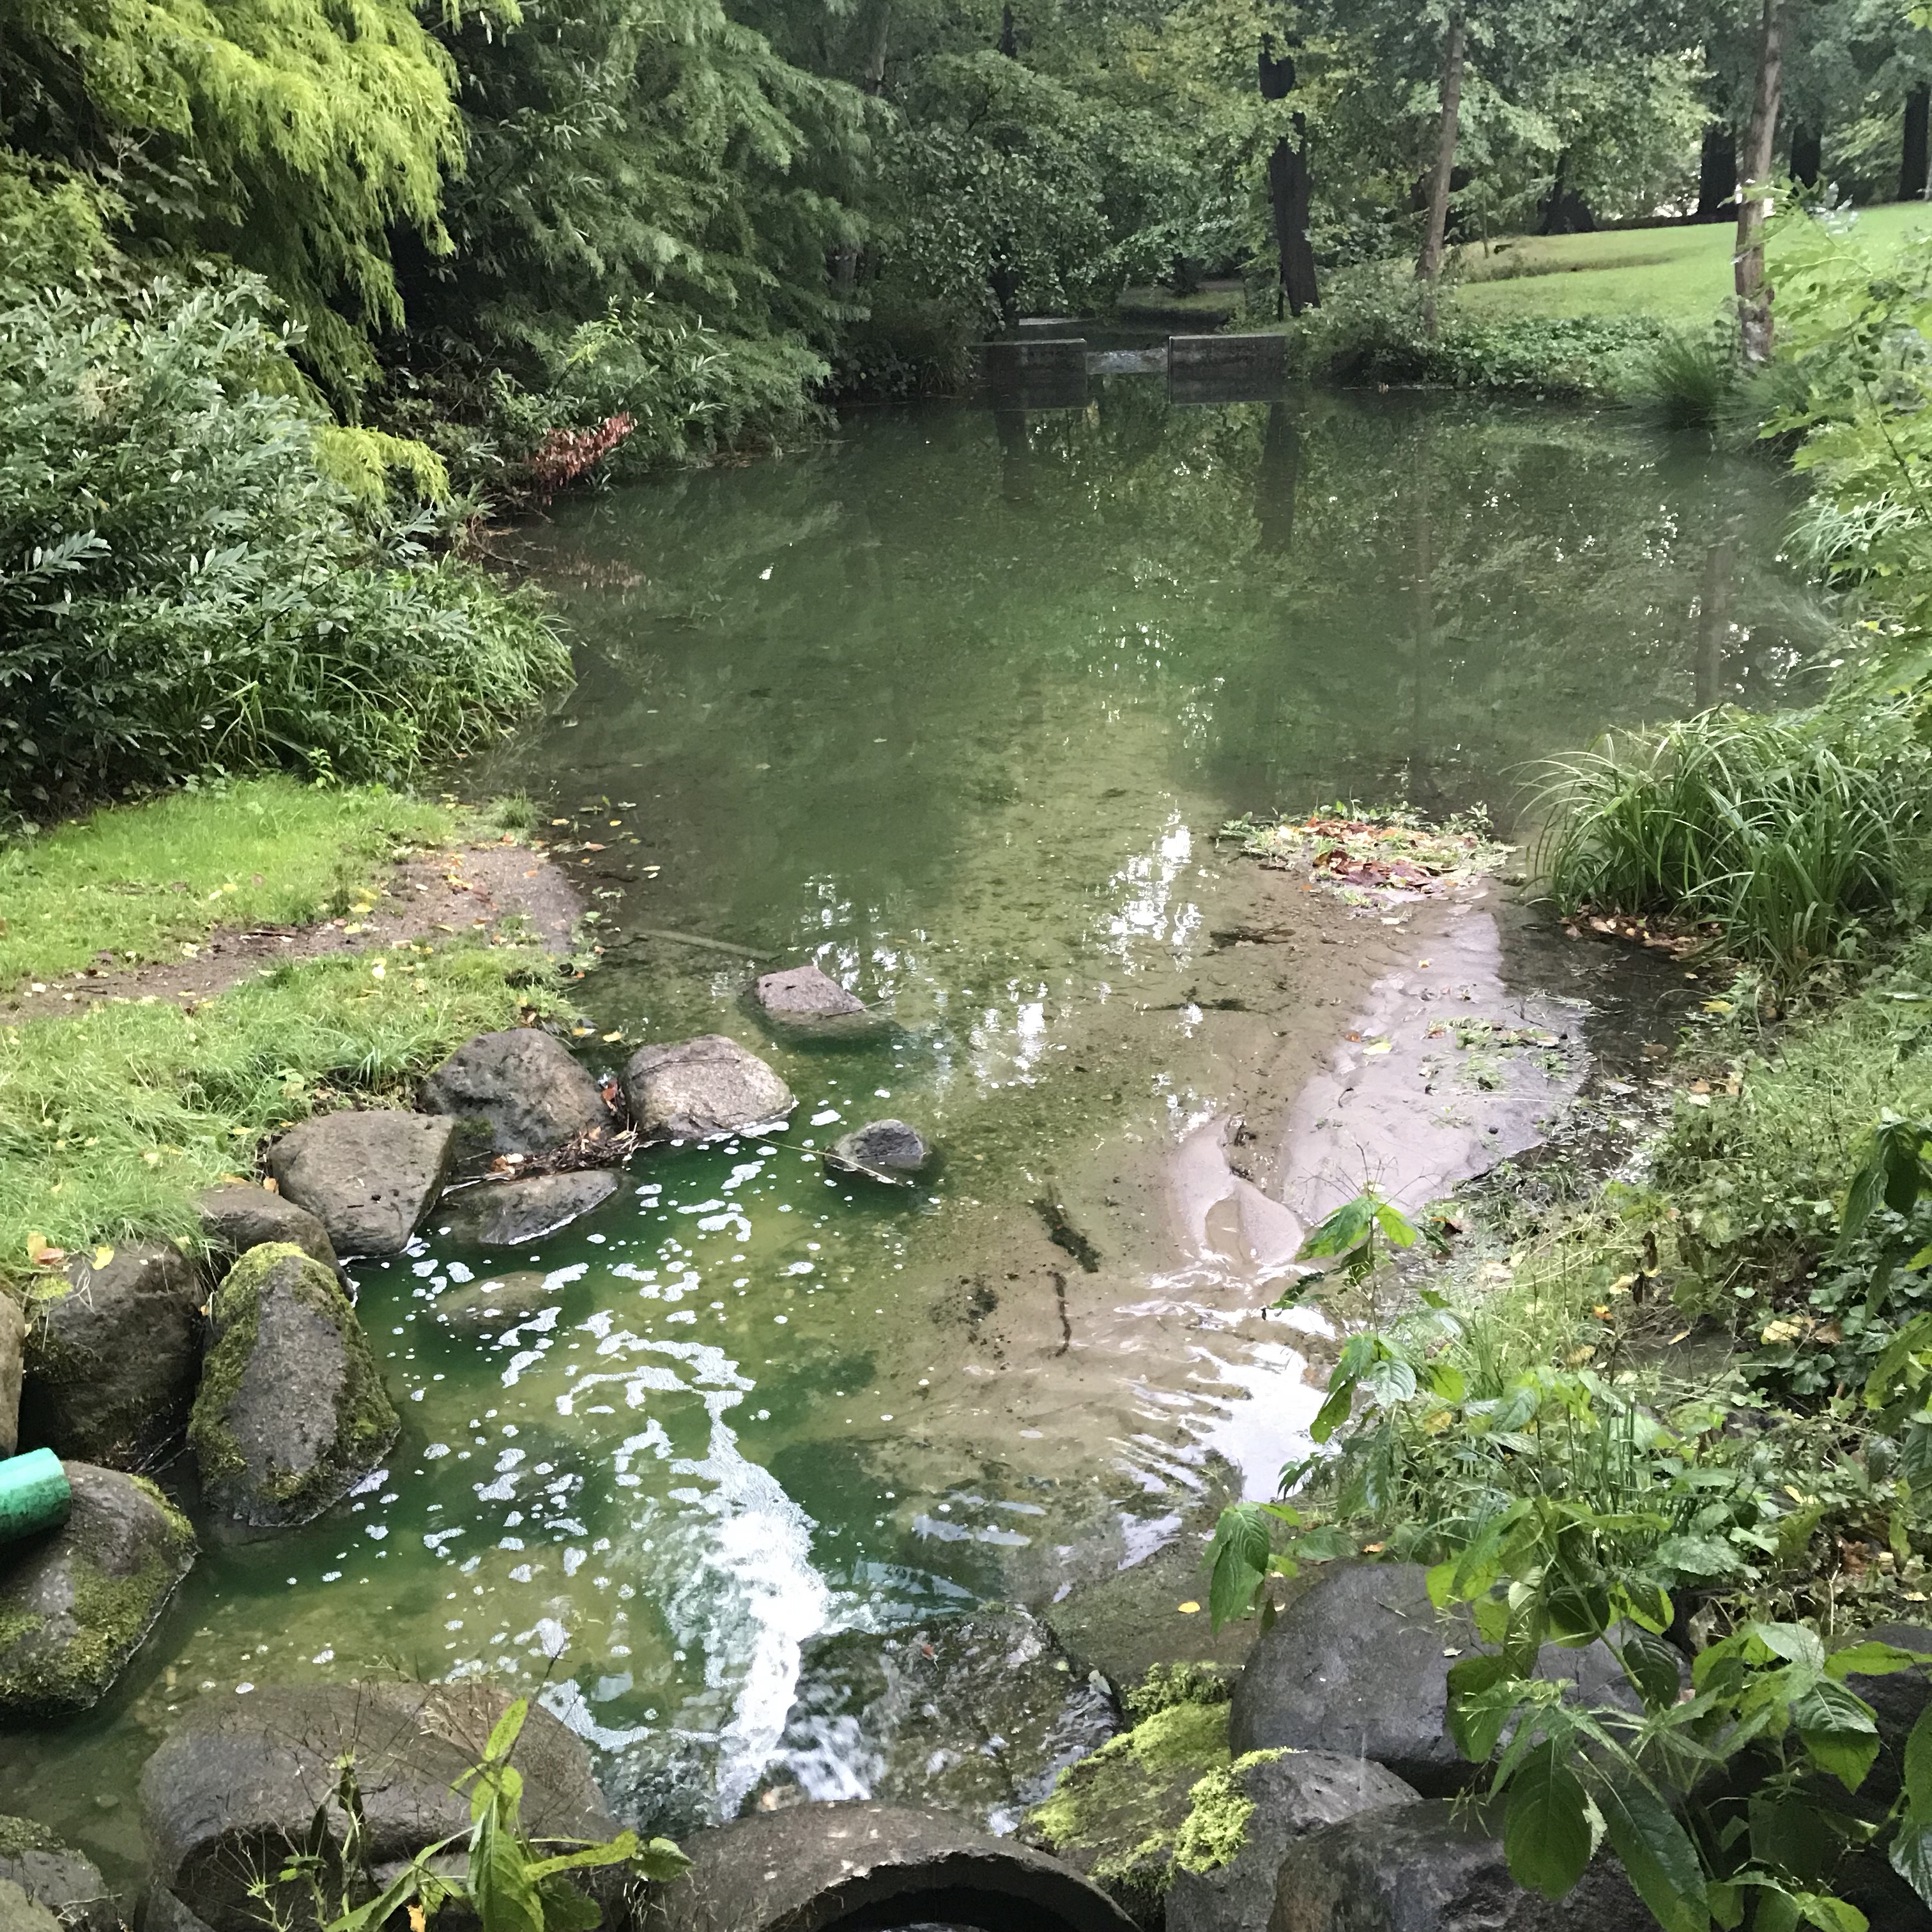
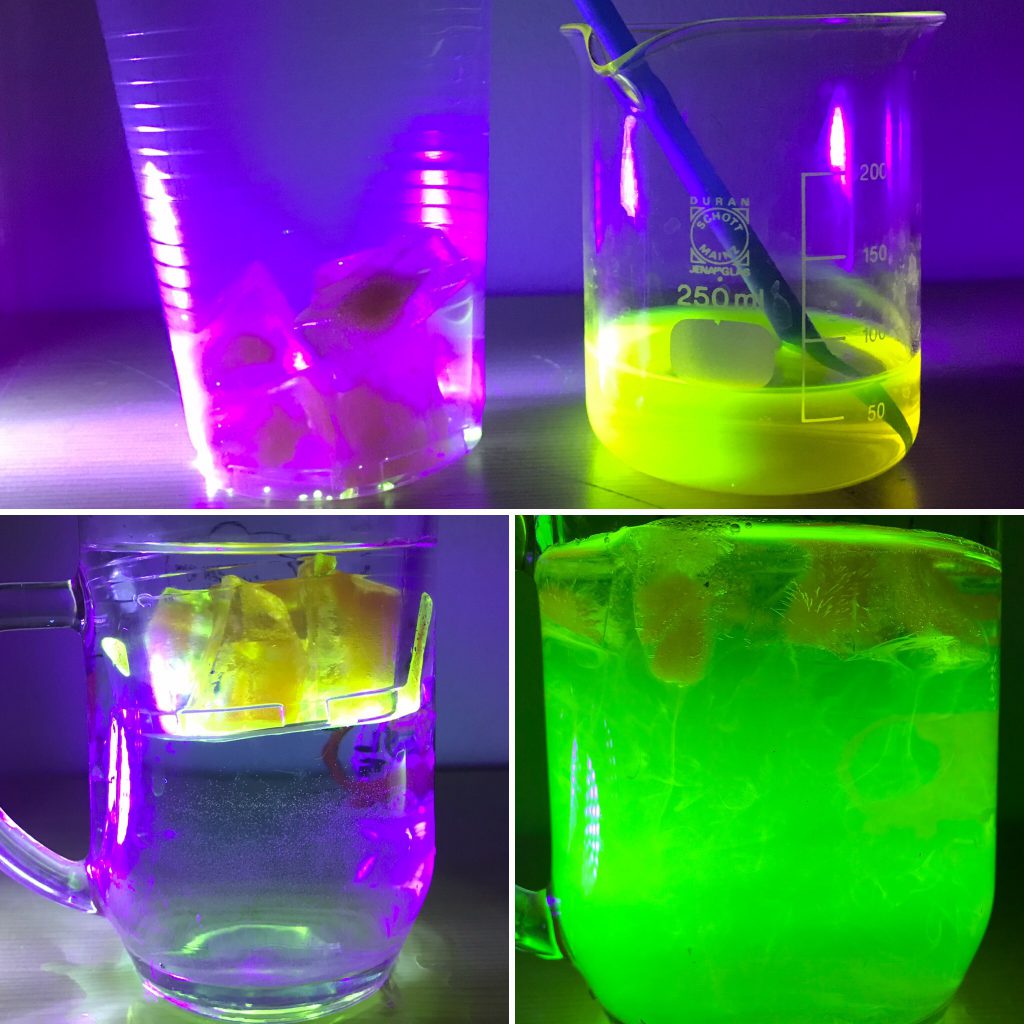
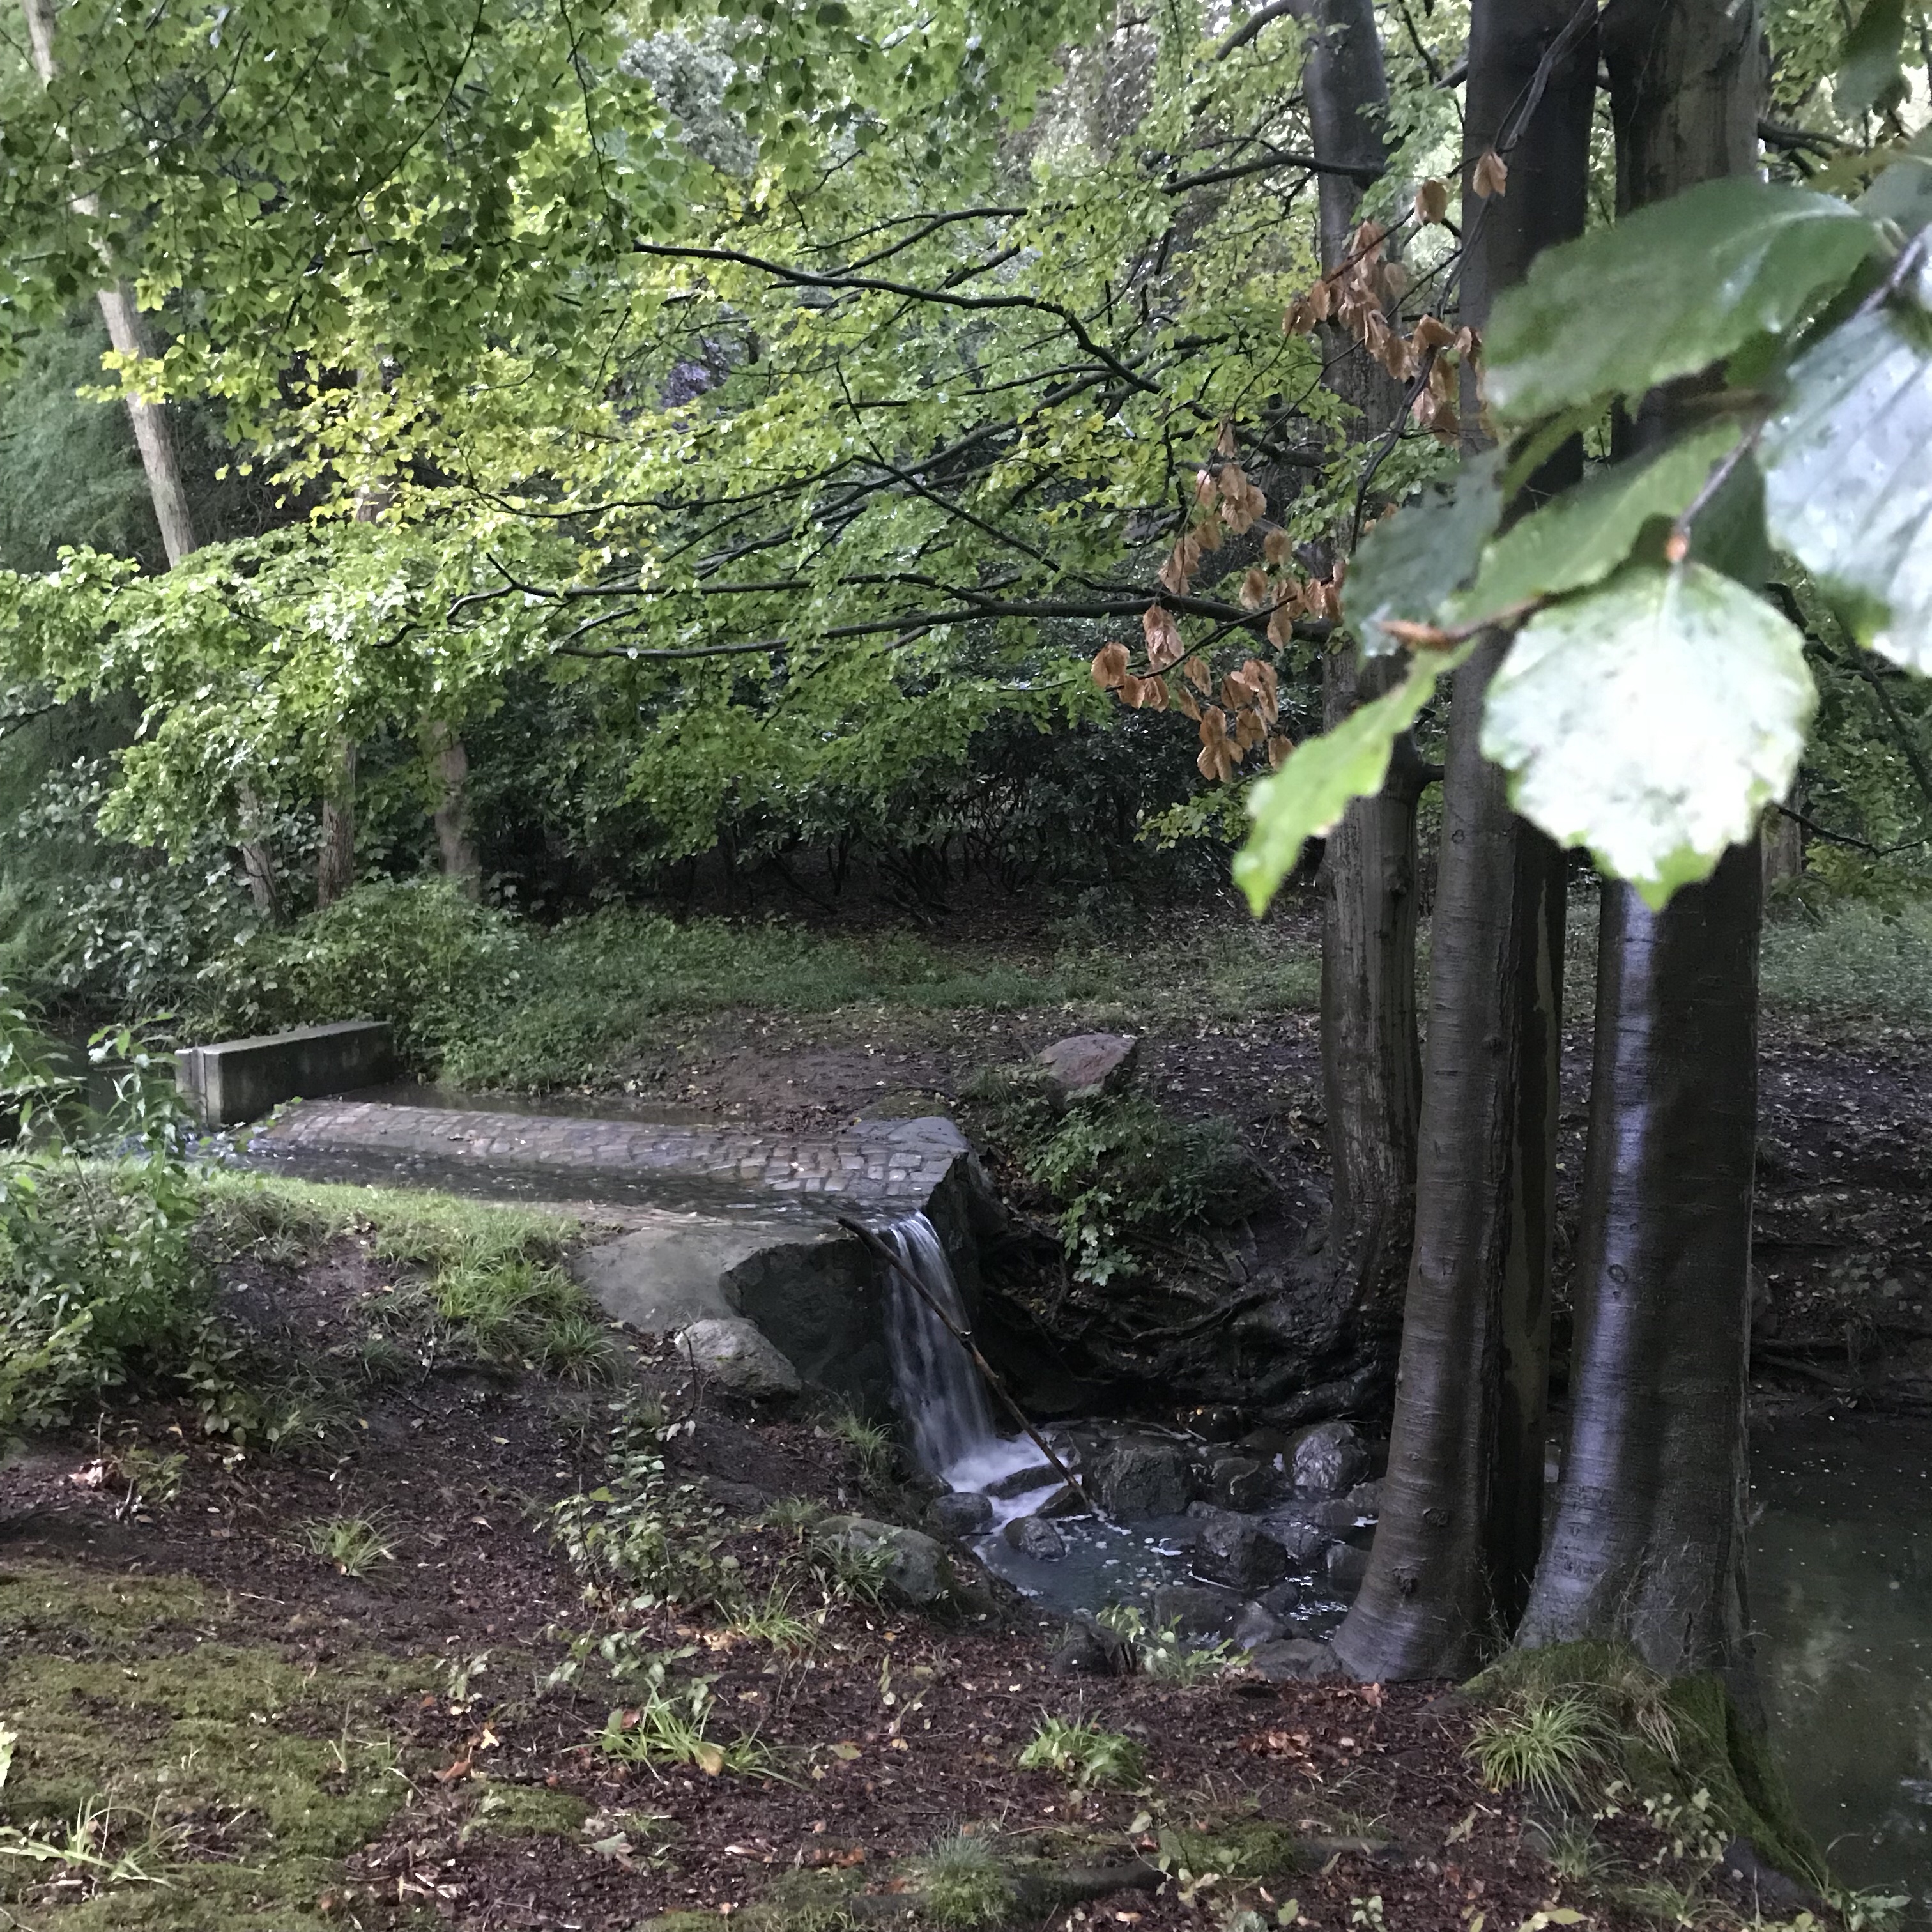
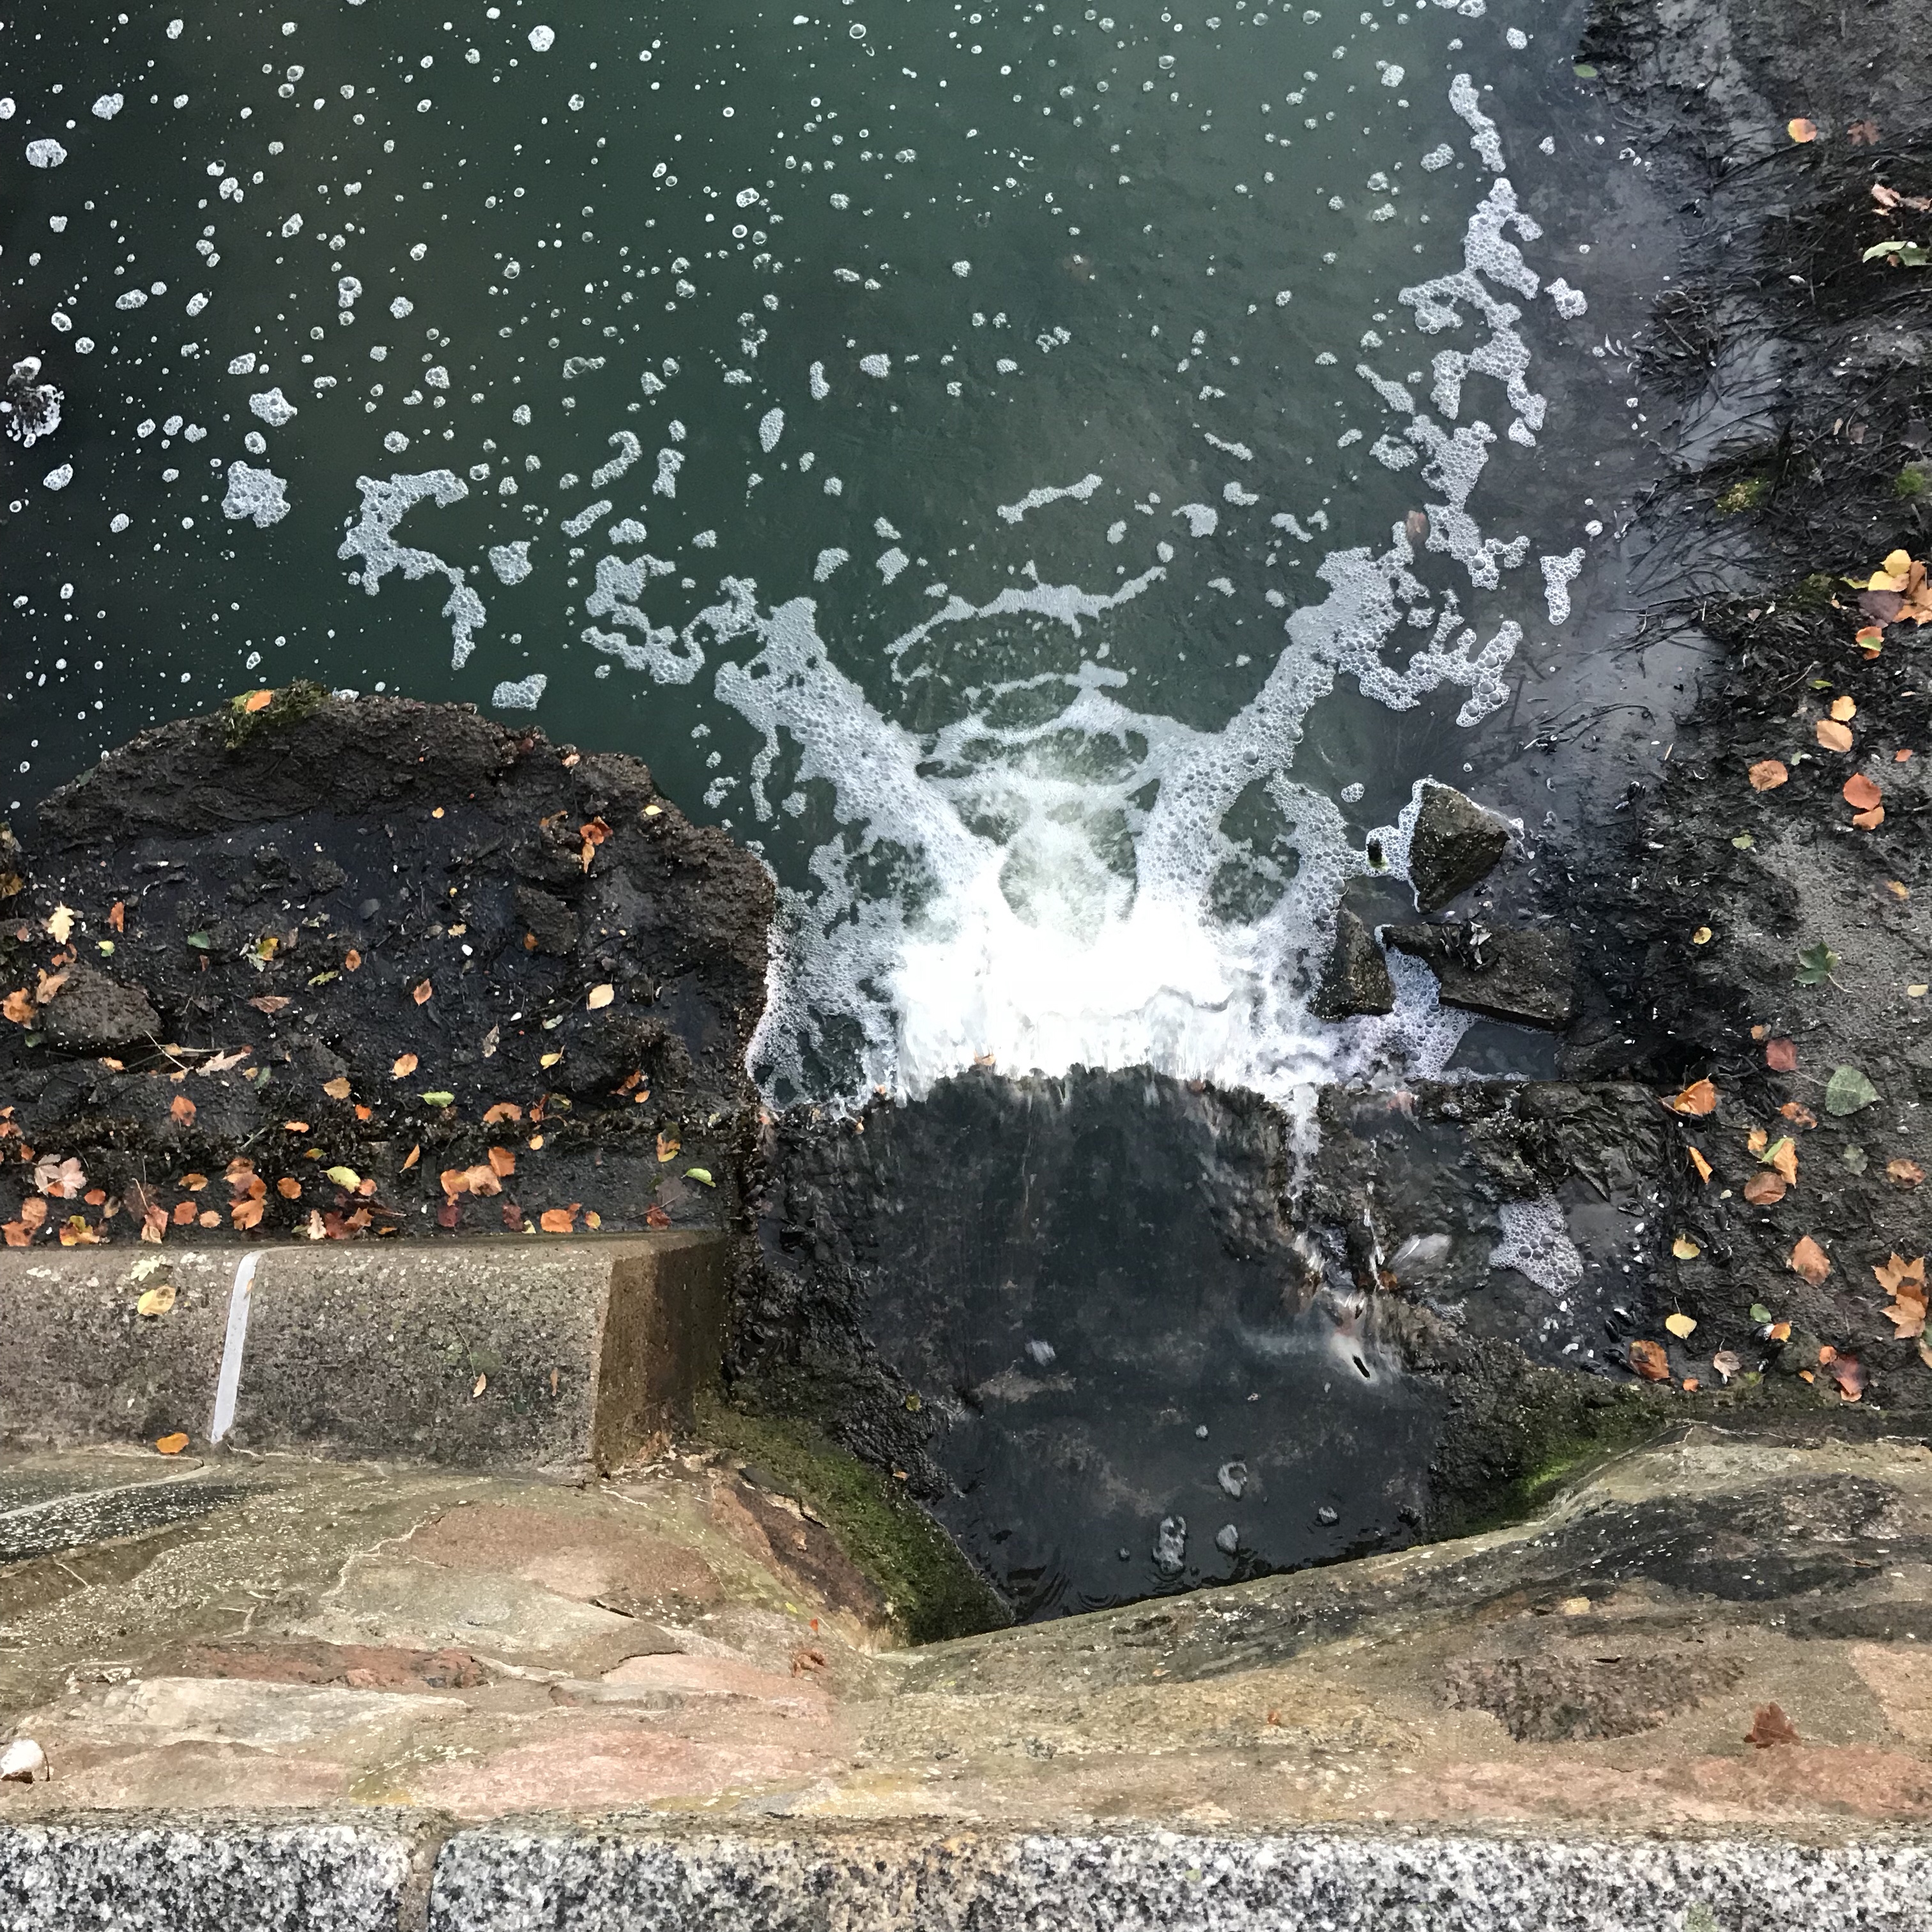
The dye is now a lot more diluted, but overall it still looks surprisingly green seeing that there is a lot of rain water draining into the lake. To give you an idea of how much more water is going through now than when I last showed pictures of the green stream: Look at how clearly you see the inflow into the lake in the picture above! And remember the little waterfall in the picture below? There is a lot more flow now.

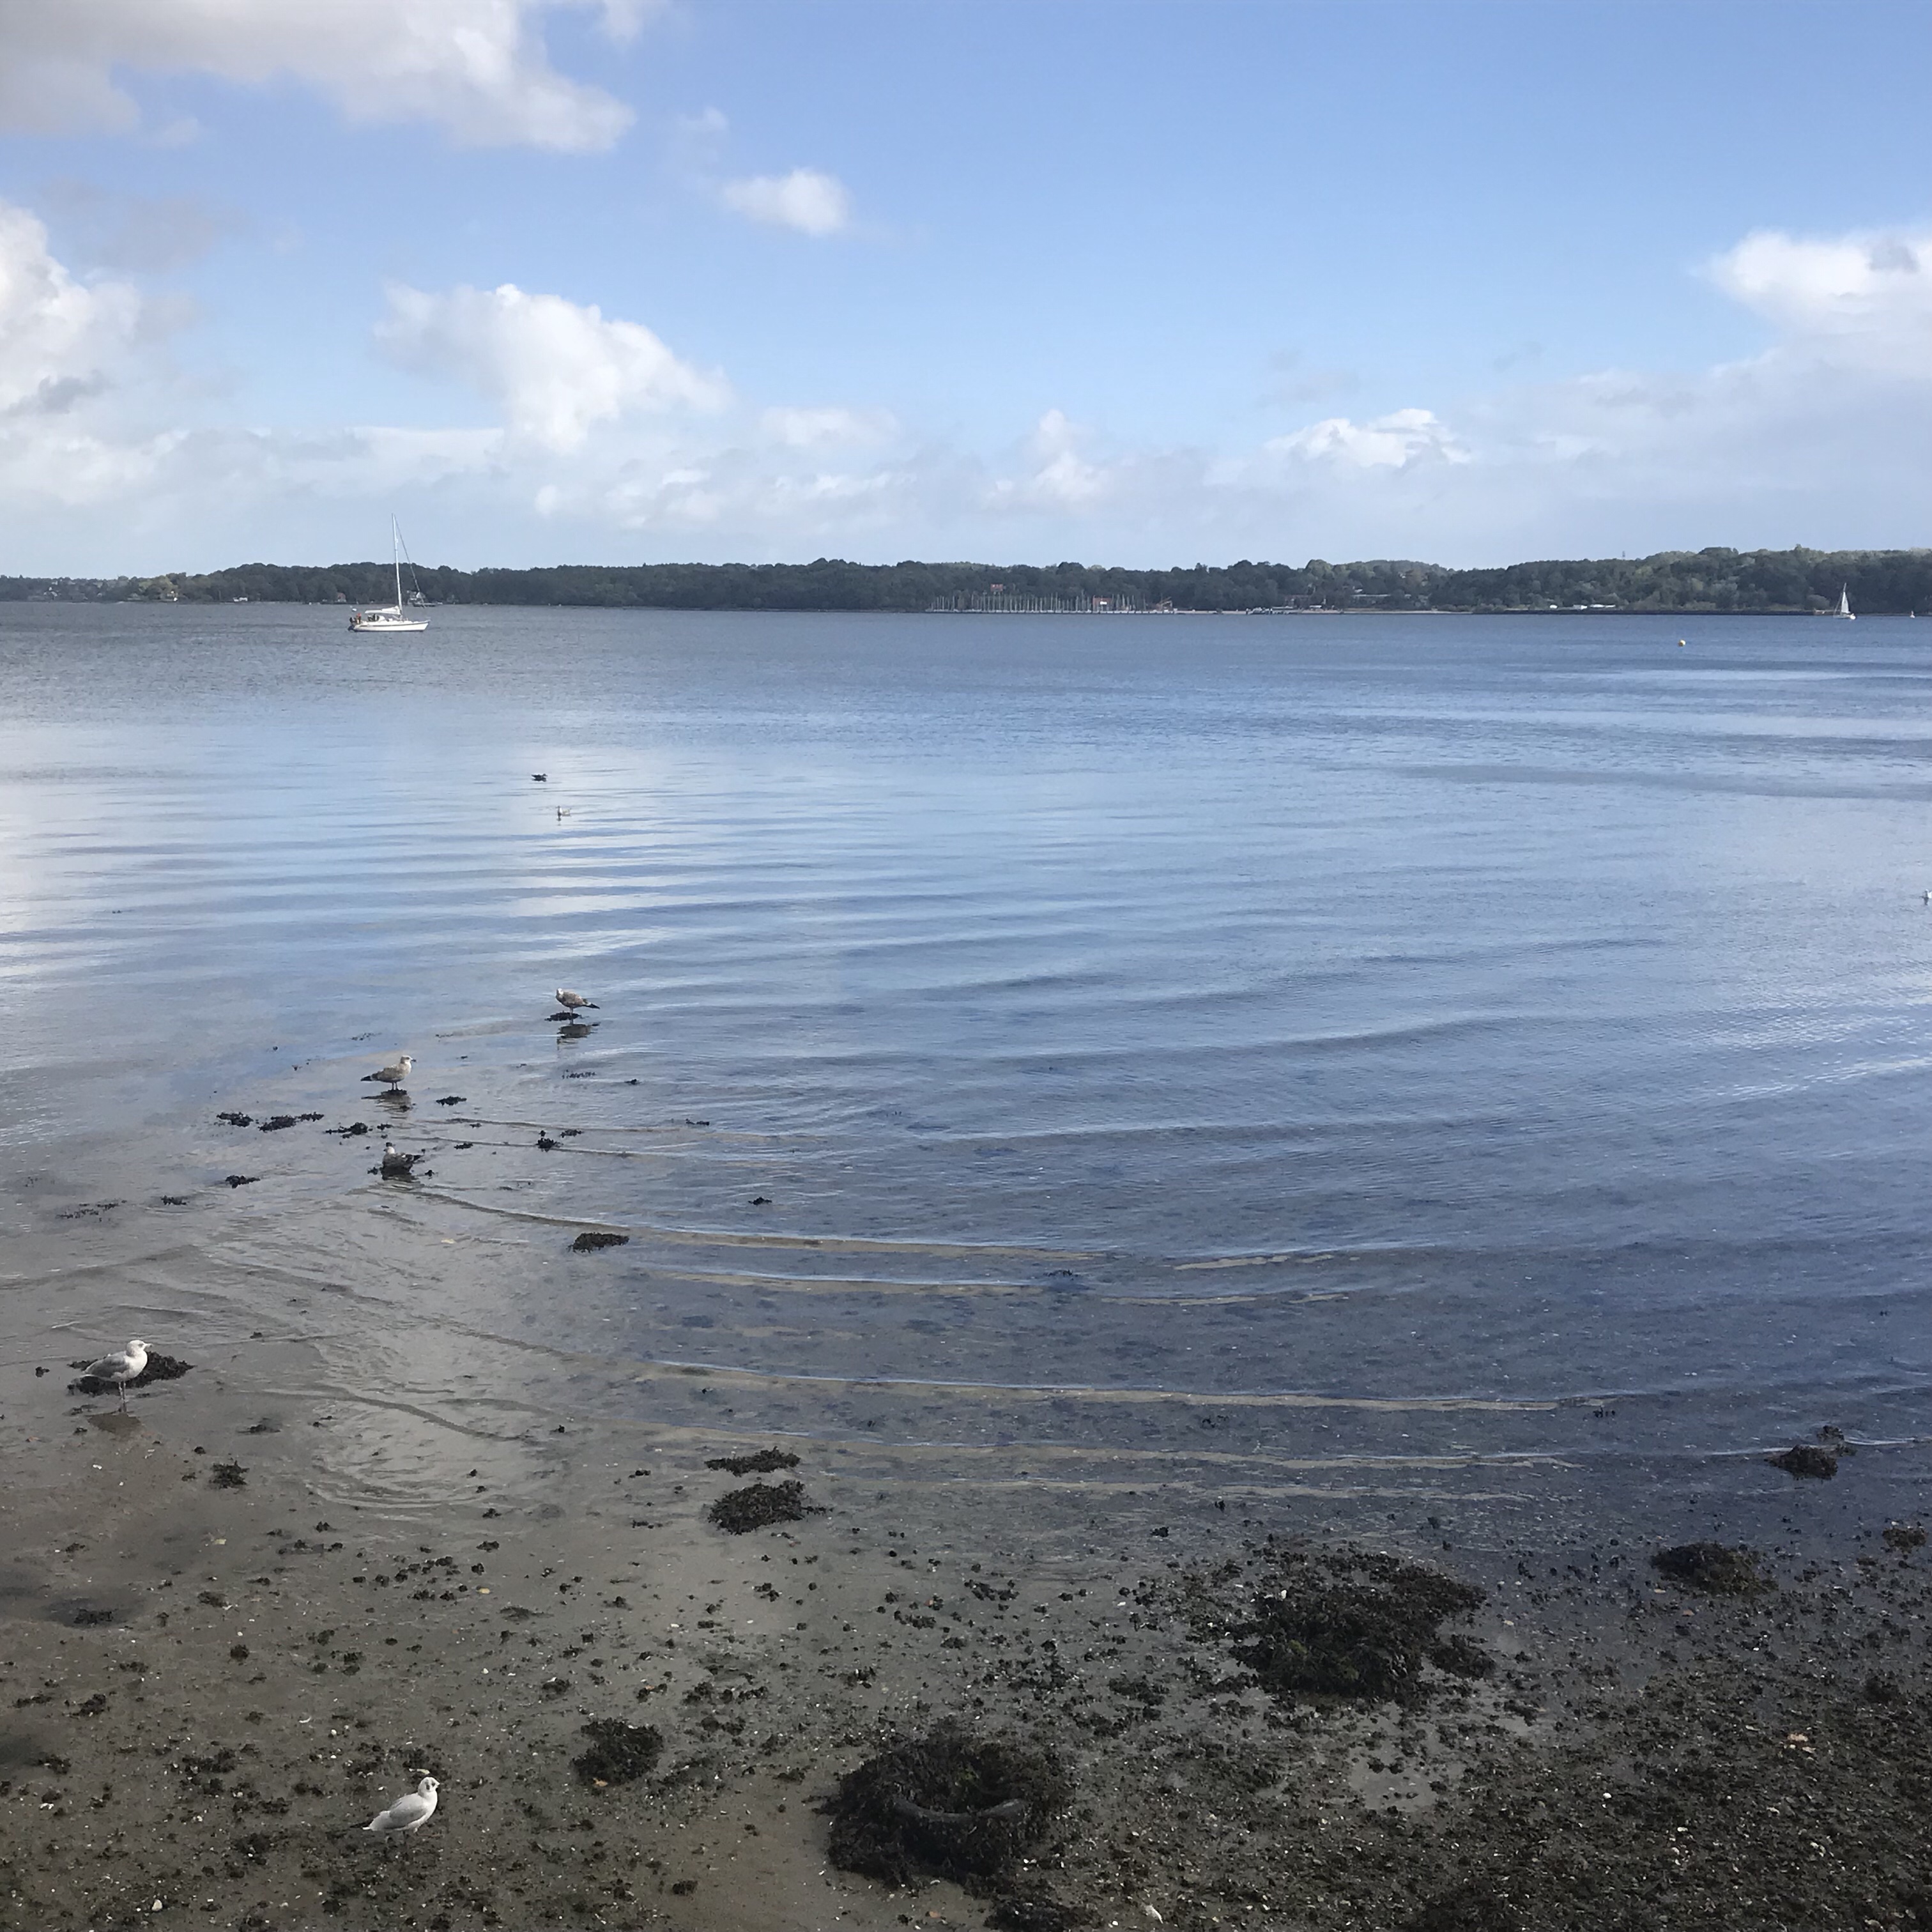
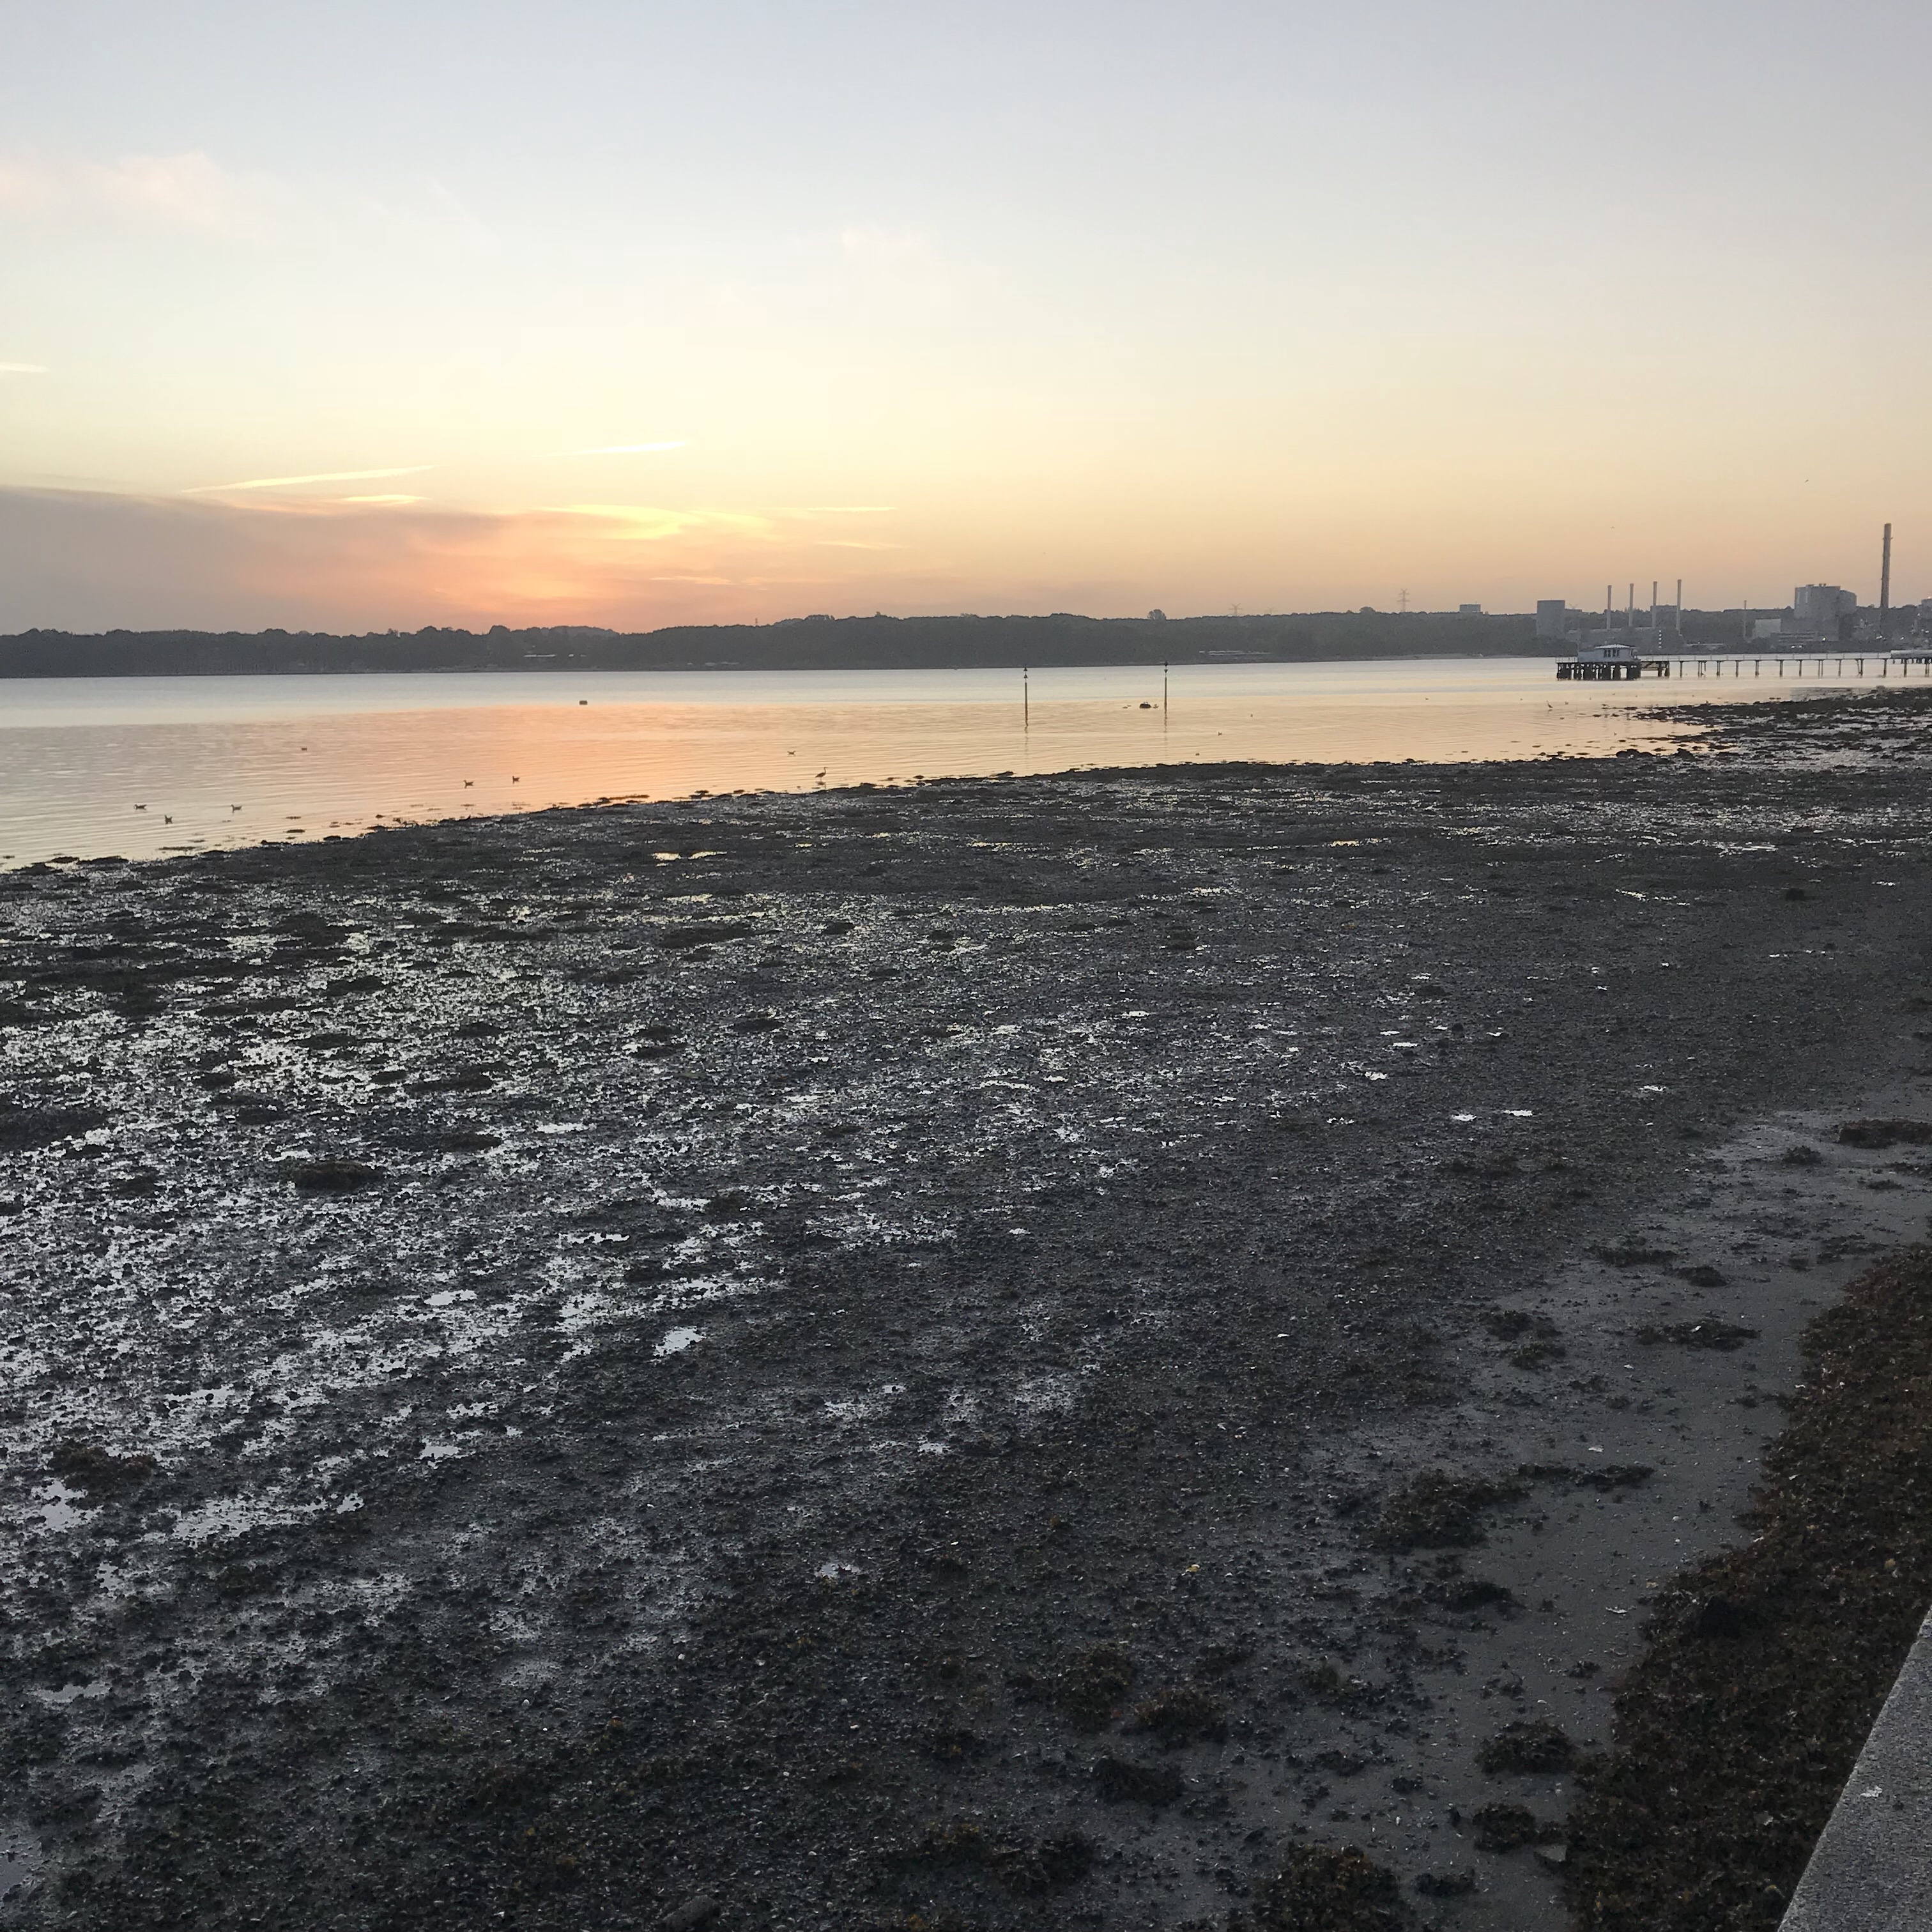
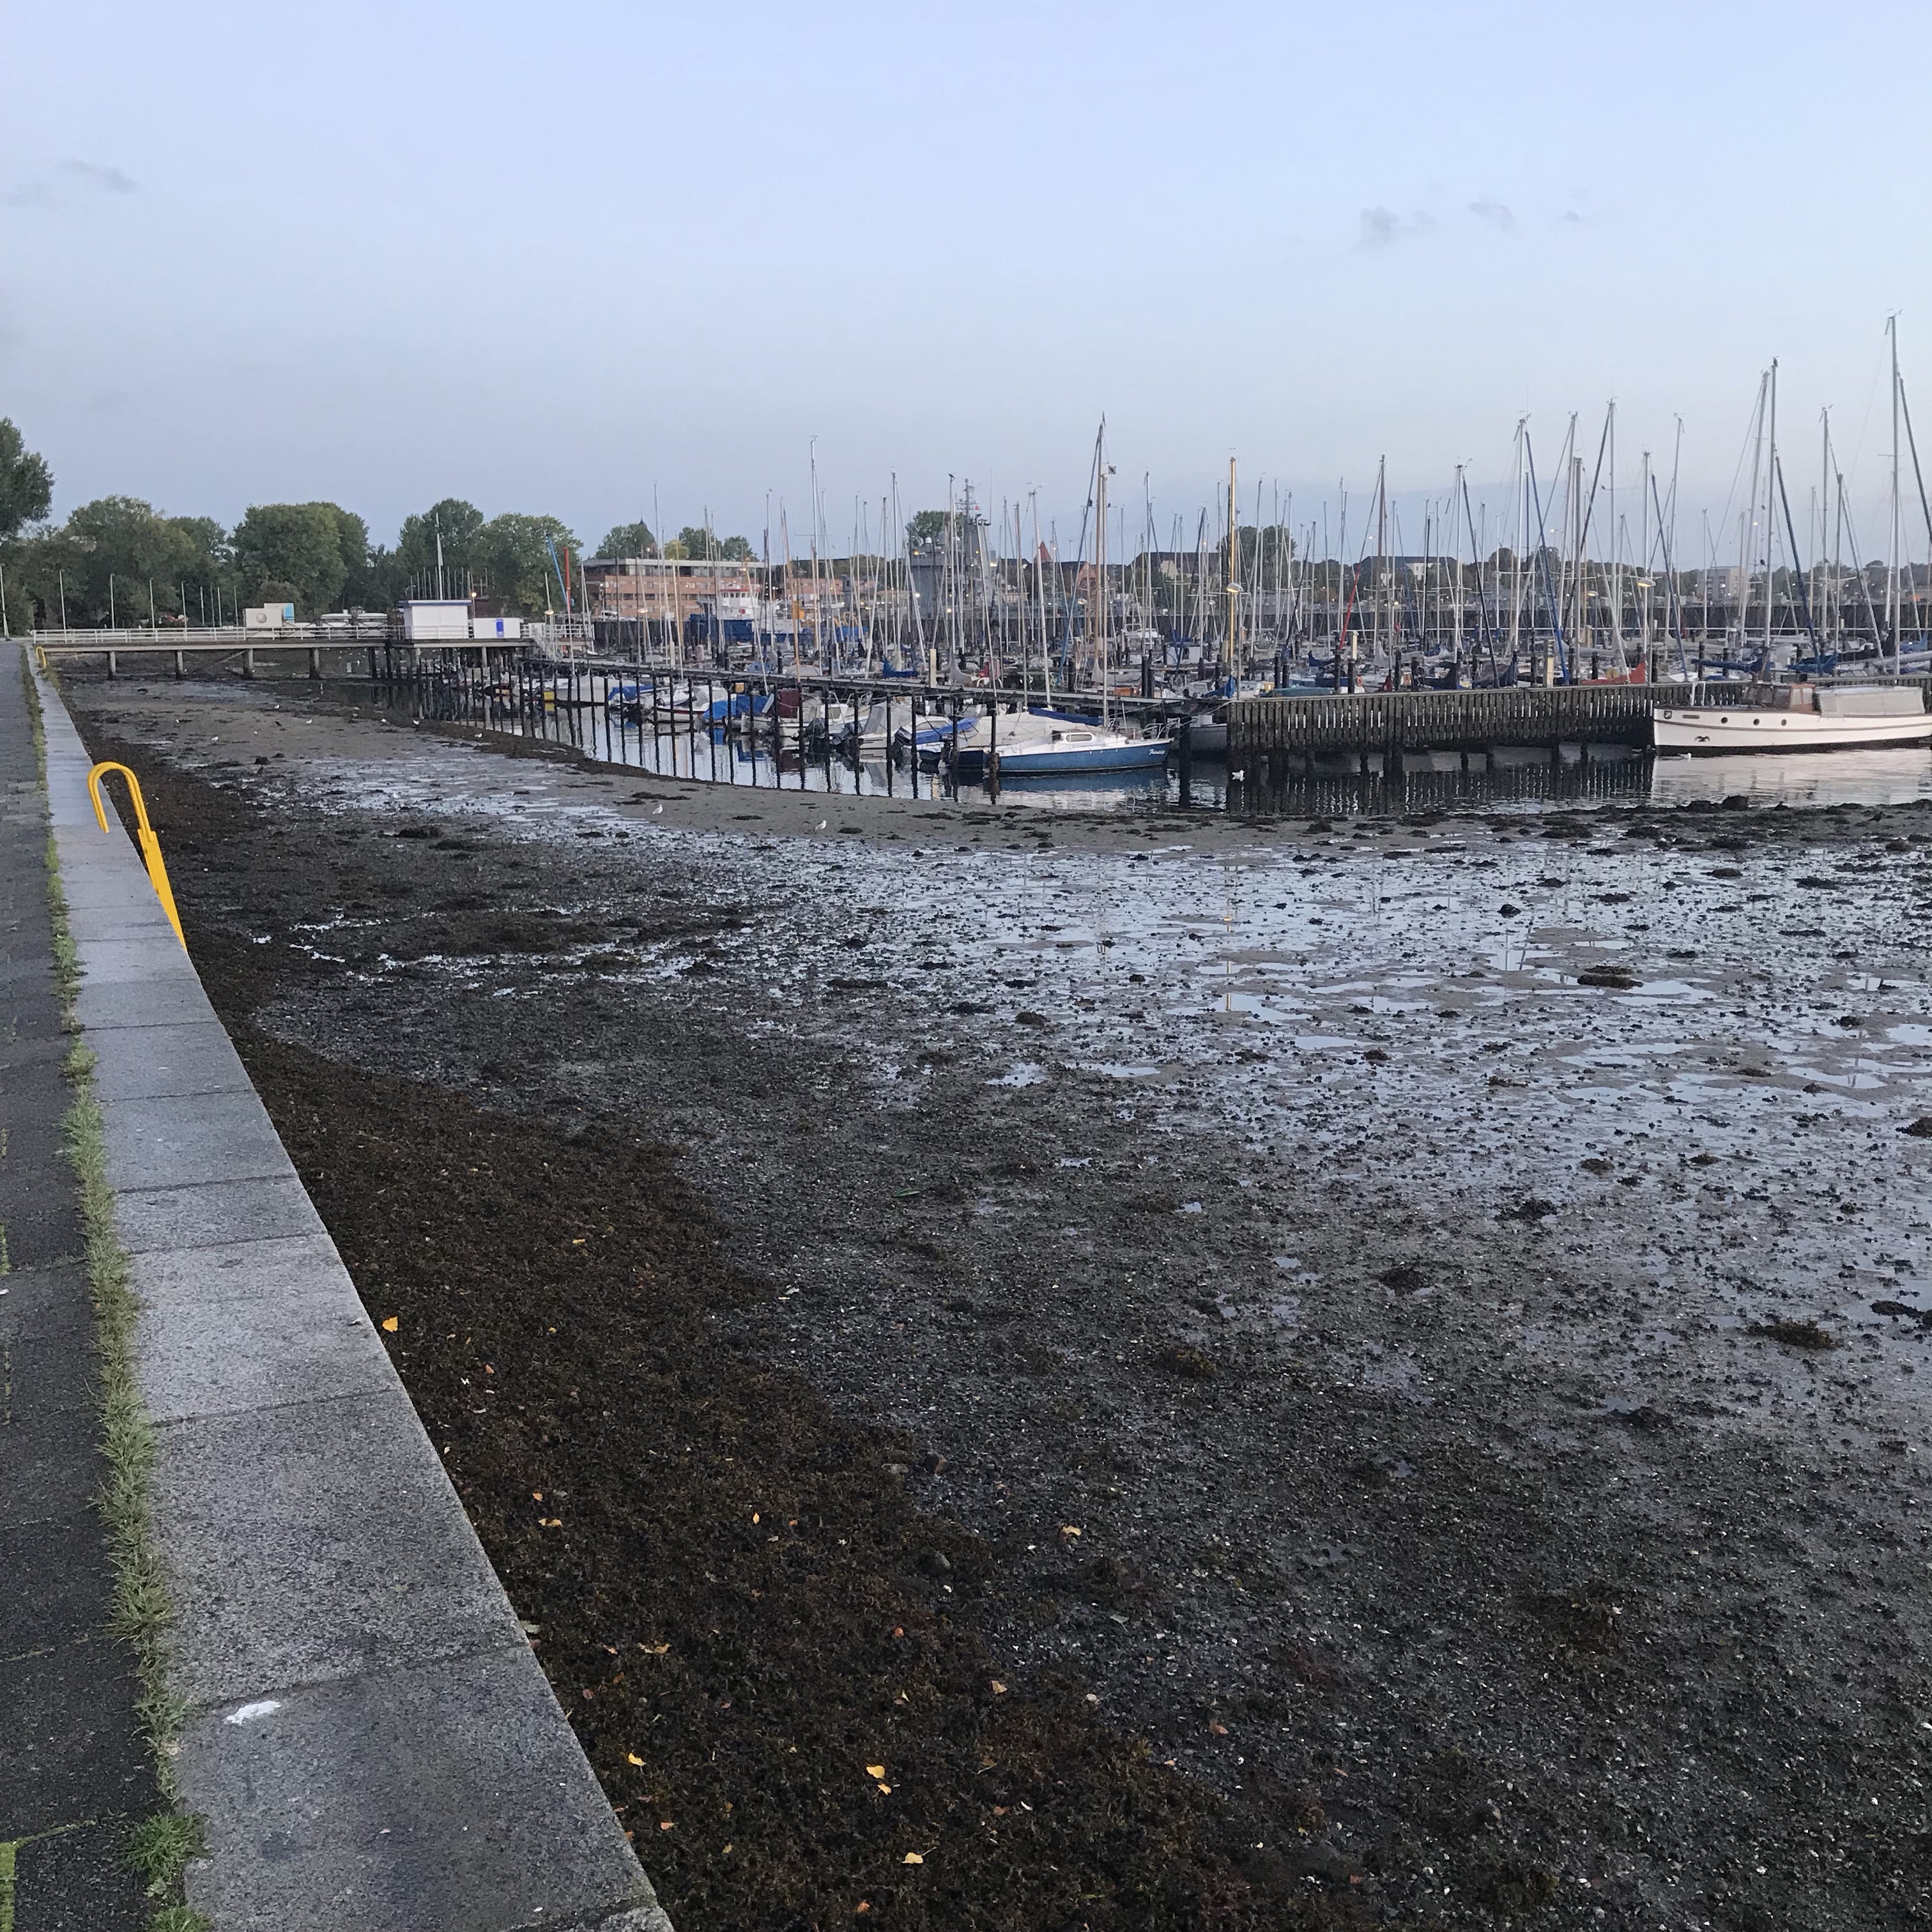
Another thing that has gotten a lot easier to see now is where the dye goes into the Kiel fjord. Because the flow rate is a lot higher, so the flow itself is clearly visible, independent of the tracer, but also because … well, there isn’t a lot of water left in Kiel fjord!

This is what it looks like this morning: That little stream is water from the lake going into the fjord. Usually there is about a meter more water here!

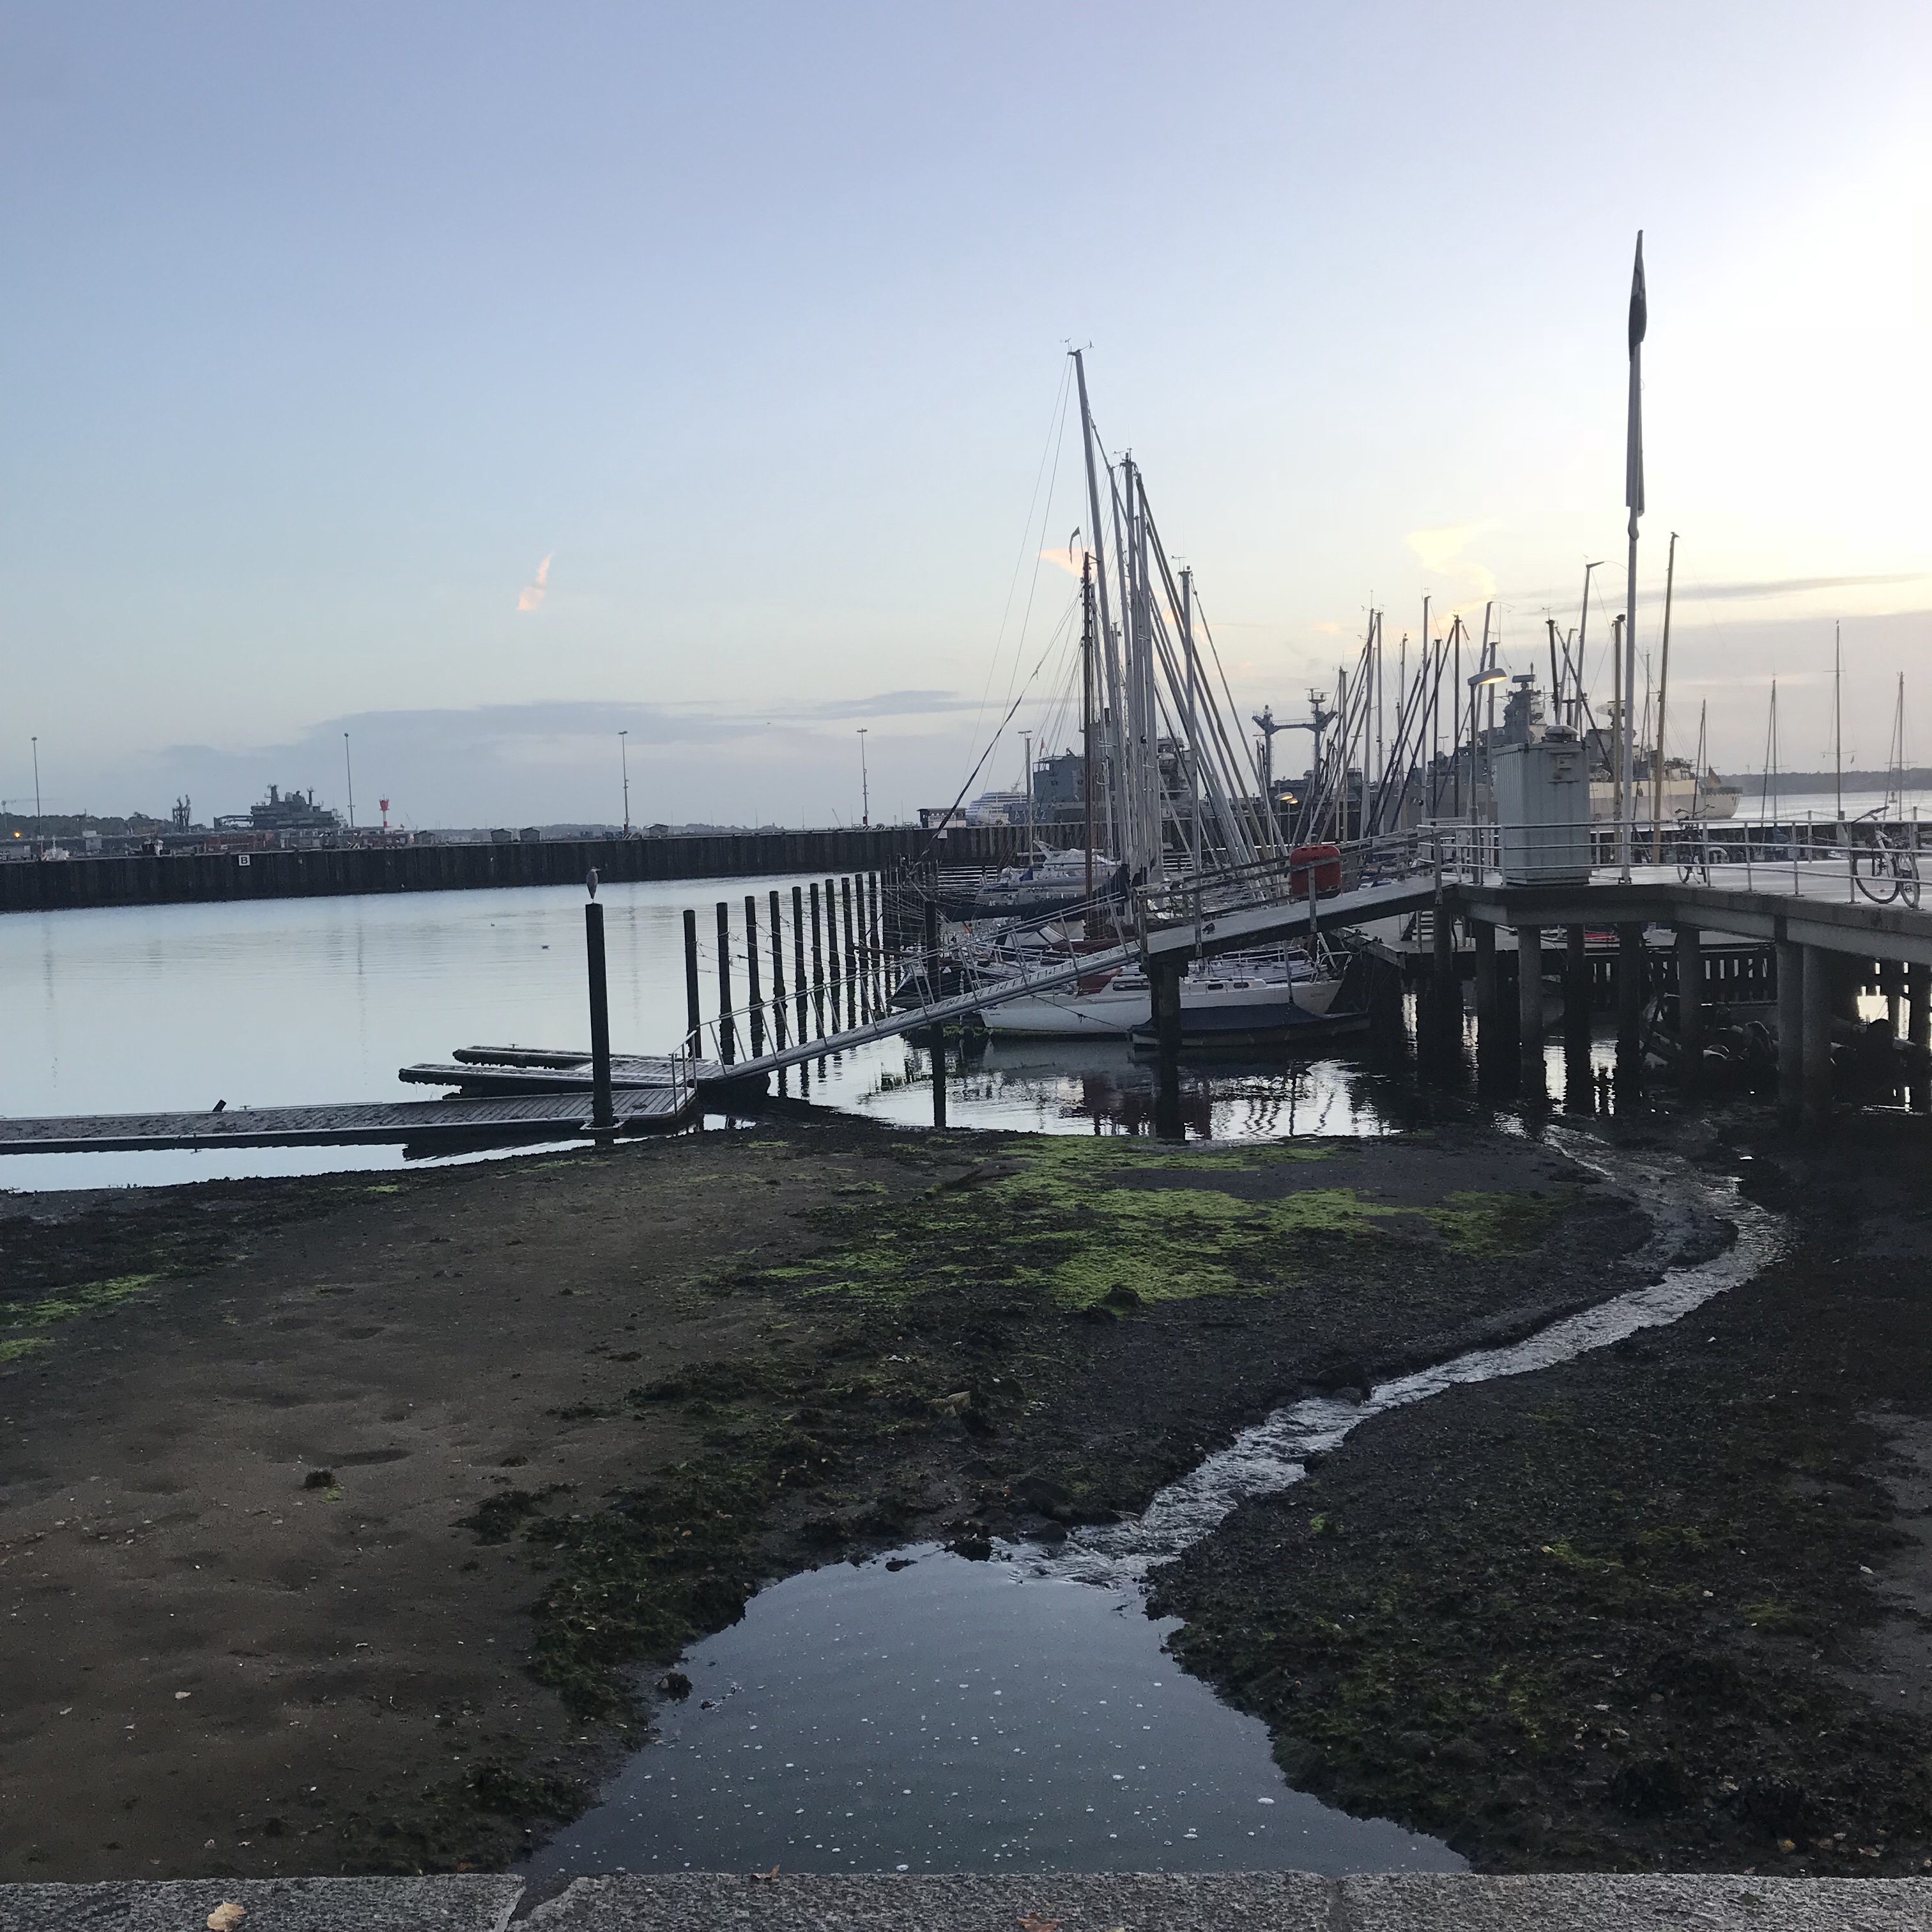
It looks actually pretty cool to see exactly what the sea floor looks like.

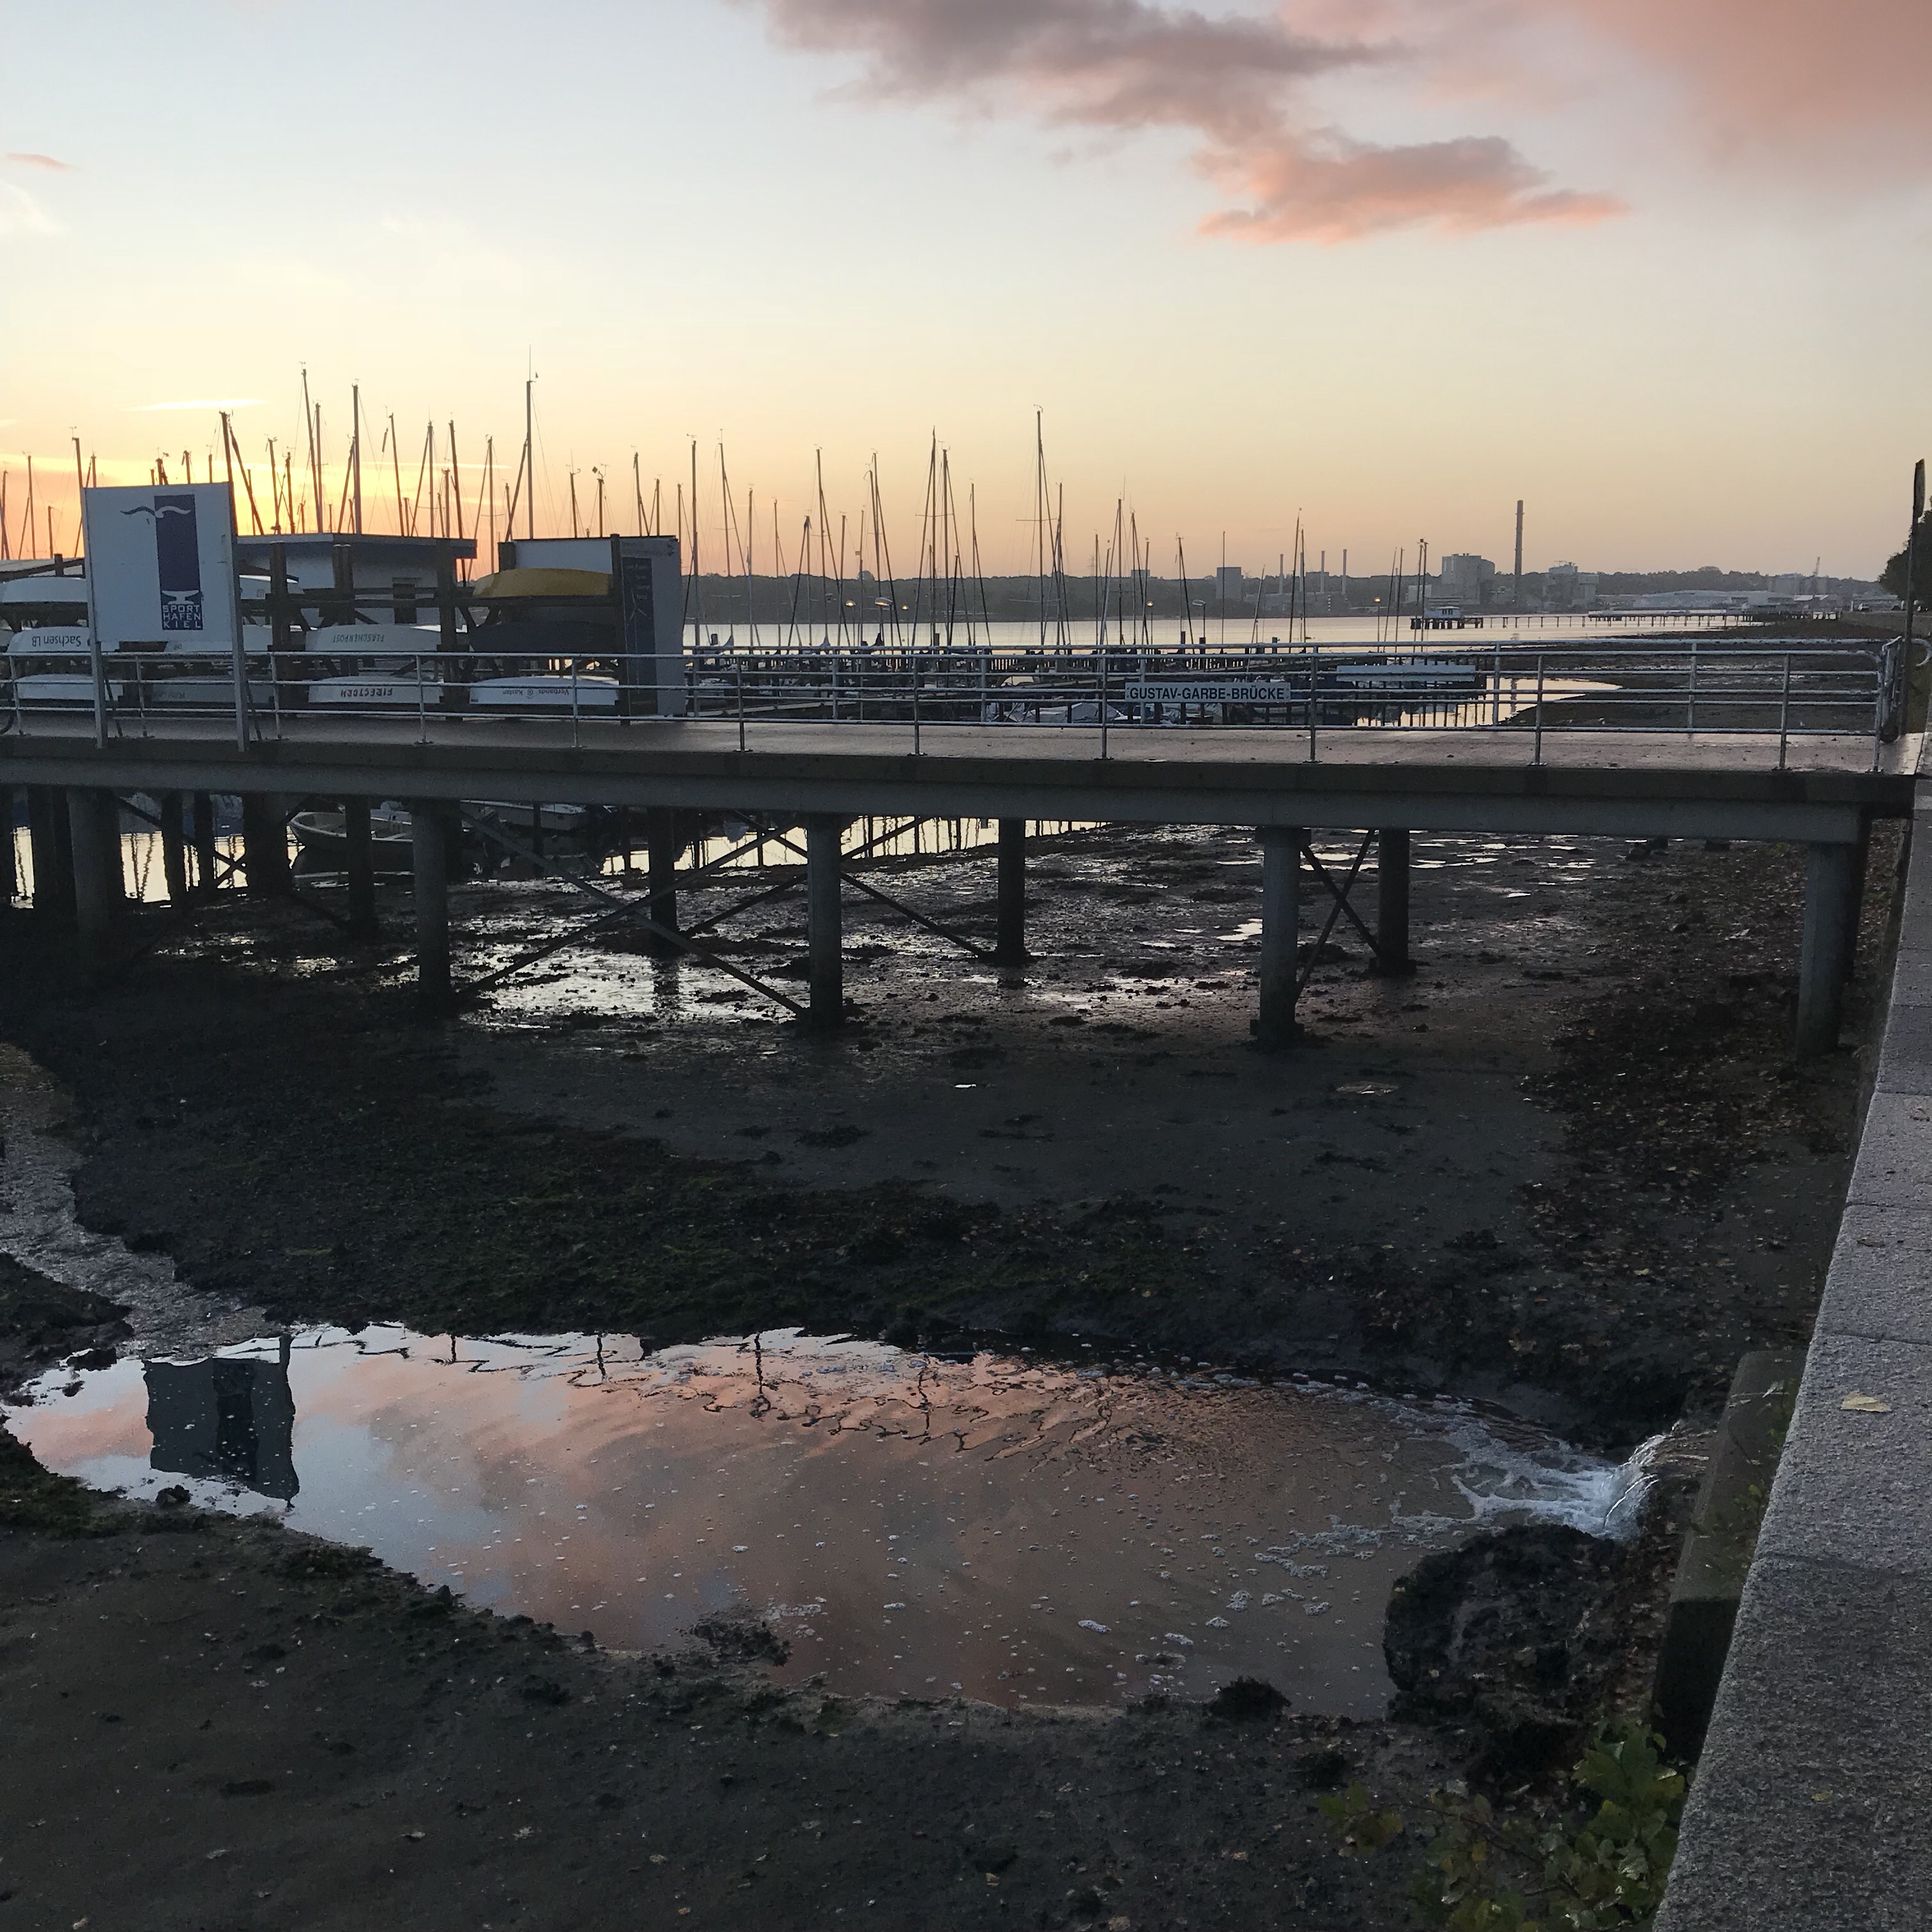
Even though there are no tides in the Baltic (well, hardly any), we do have some large changes in water levels sometimes. They are due to changes in wind or pressure; in this case there was a lot of wind last night that pushed a lot of water out of the Kiel fjord into the Baltic.

What typically happens now is that this water doesn’t stay away indefinitely, but once the winds stop, forms a “seiche”, a standing wave, with a period of a little more than a day.

Of course I am going to check if there is water back by tonight, and then gone again tomorrow morning! Assuming, of course, that the winds stay calm. Otherwise that would influence where the water goes, too.

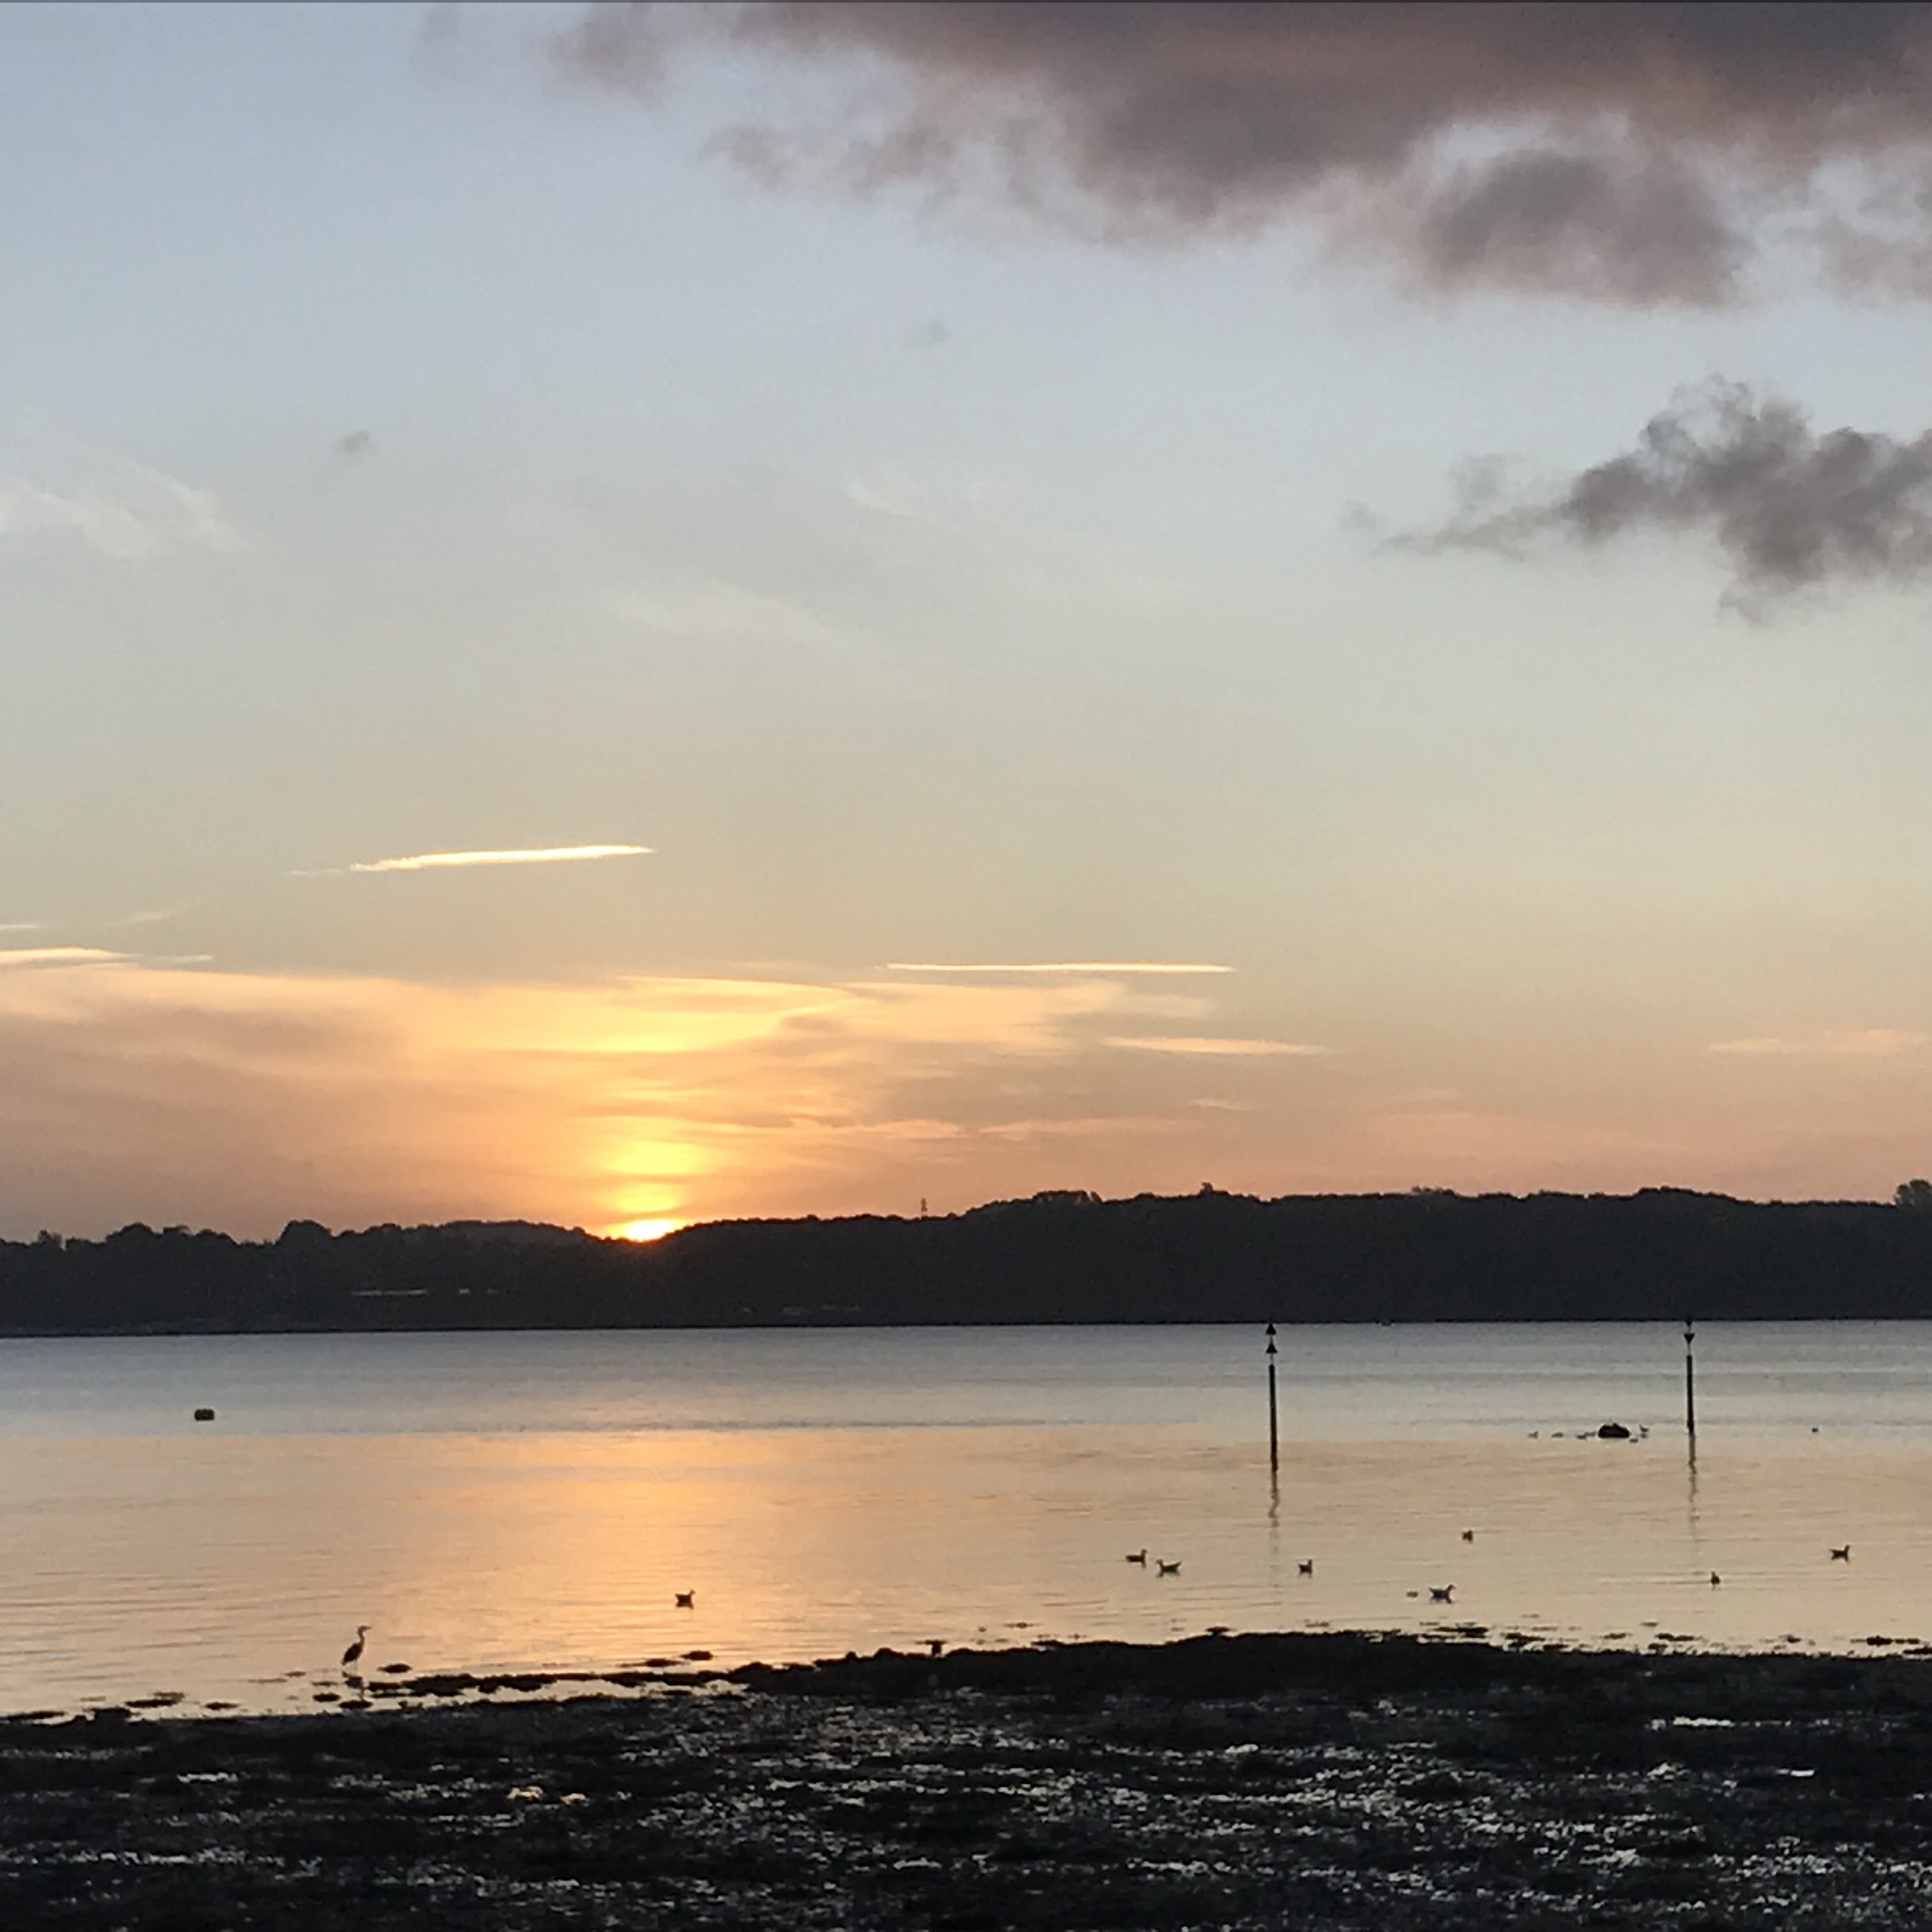
What I found really interesting, too, is that I saw a lot of herons now that I’ve hardly ever seen in this part of Kiel fjord before. It makes sense — usually there is too much water so they have nowhere to stand — but it was still weird to see five at once, and more as I walked along the fjord.

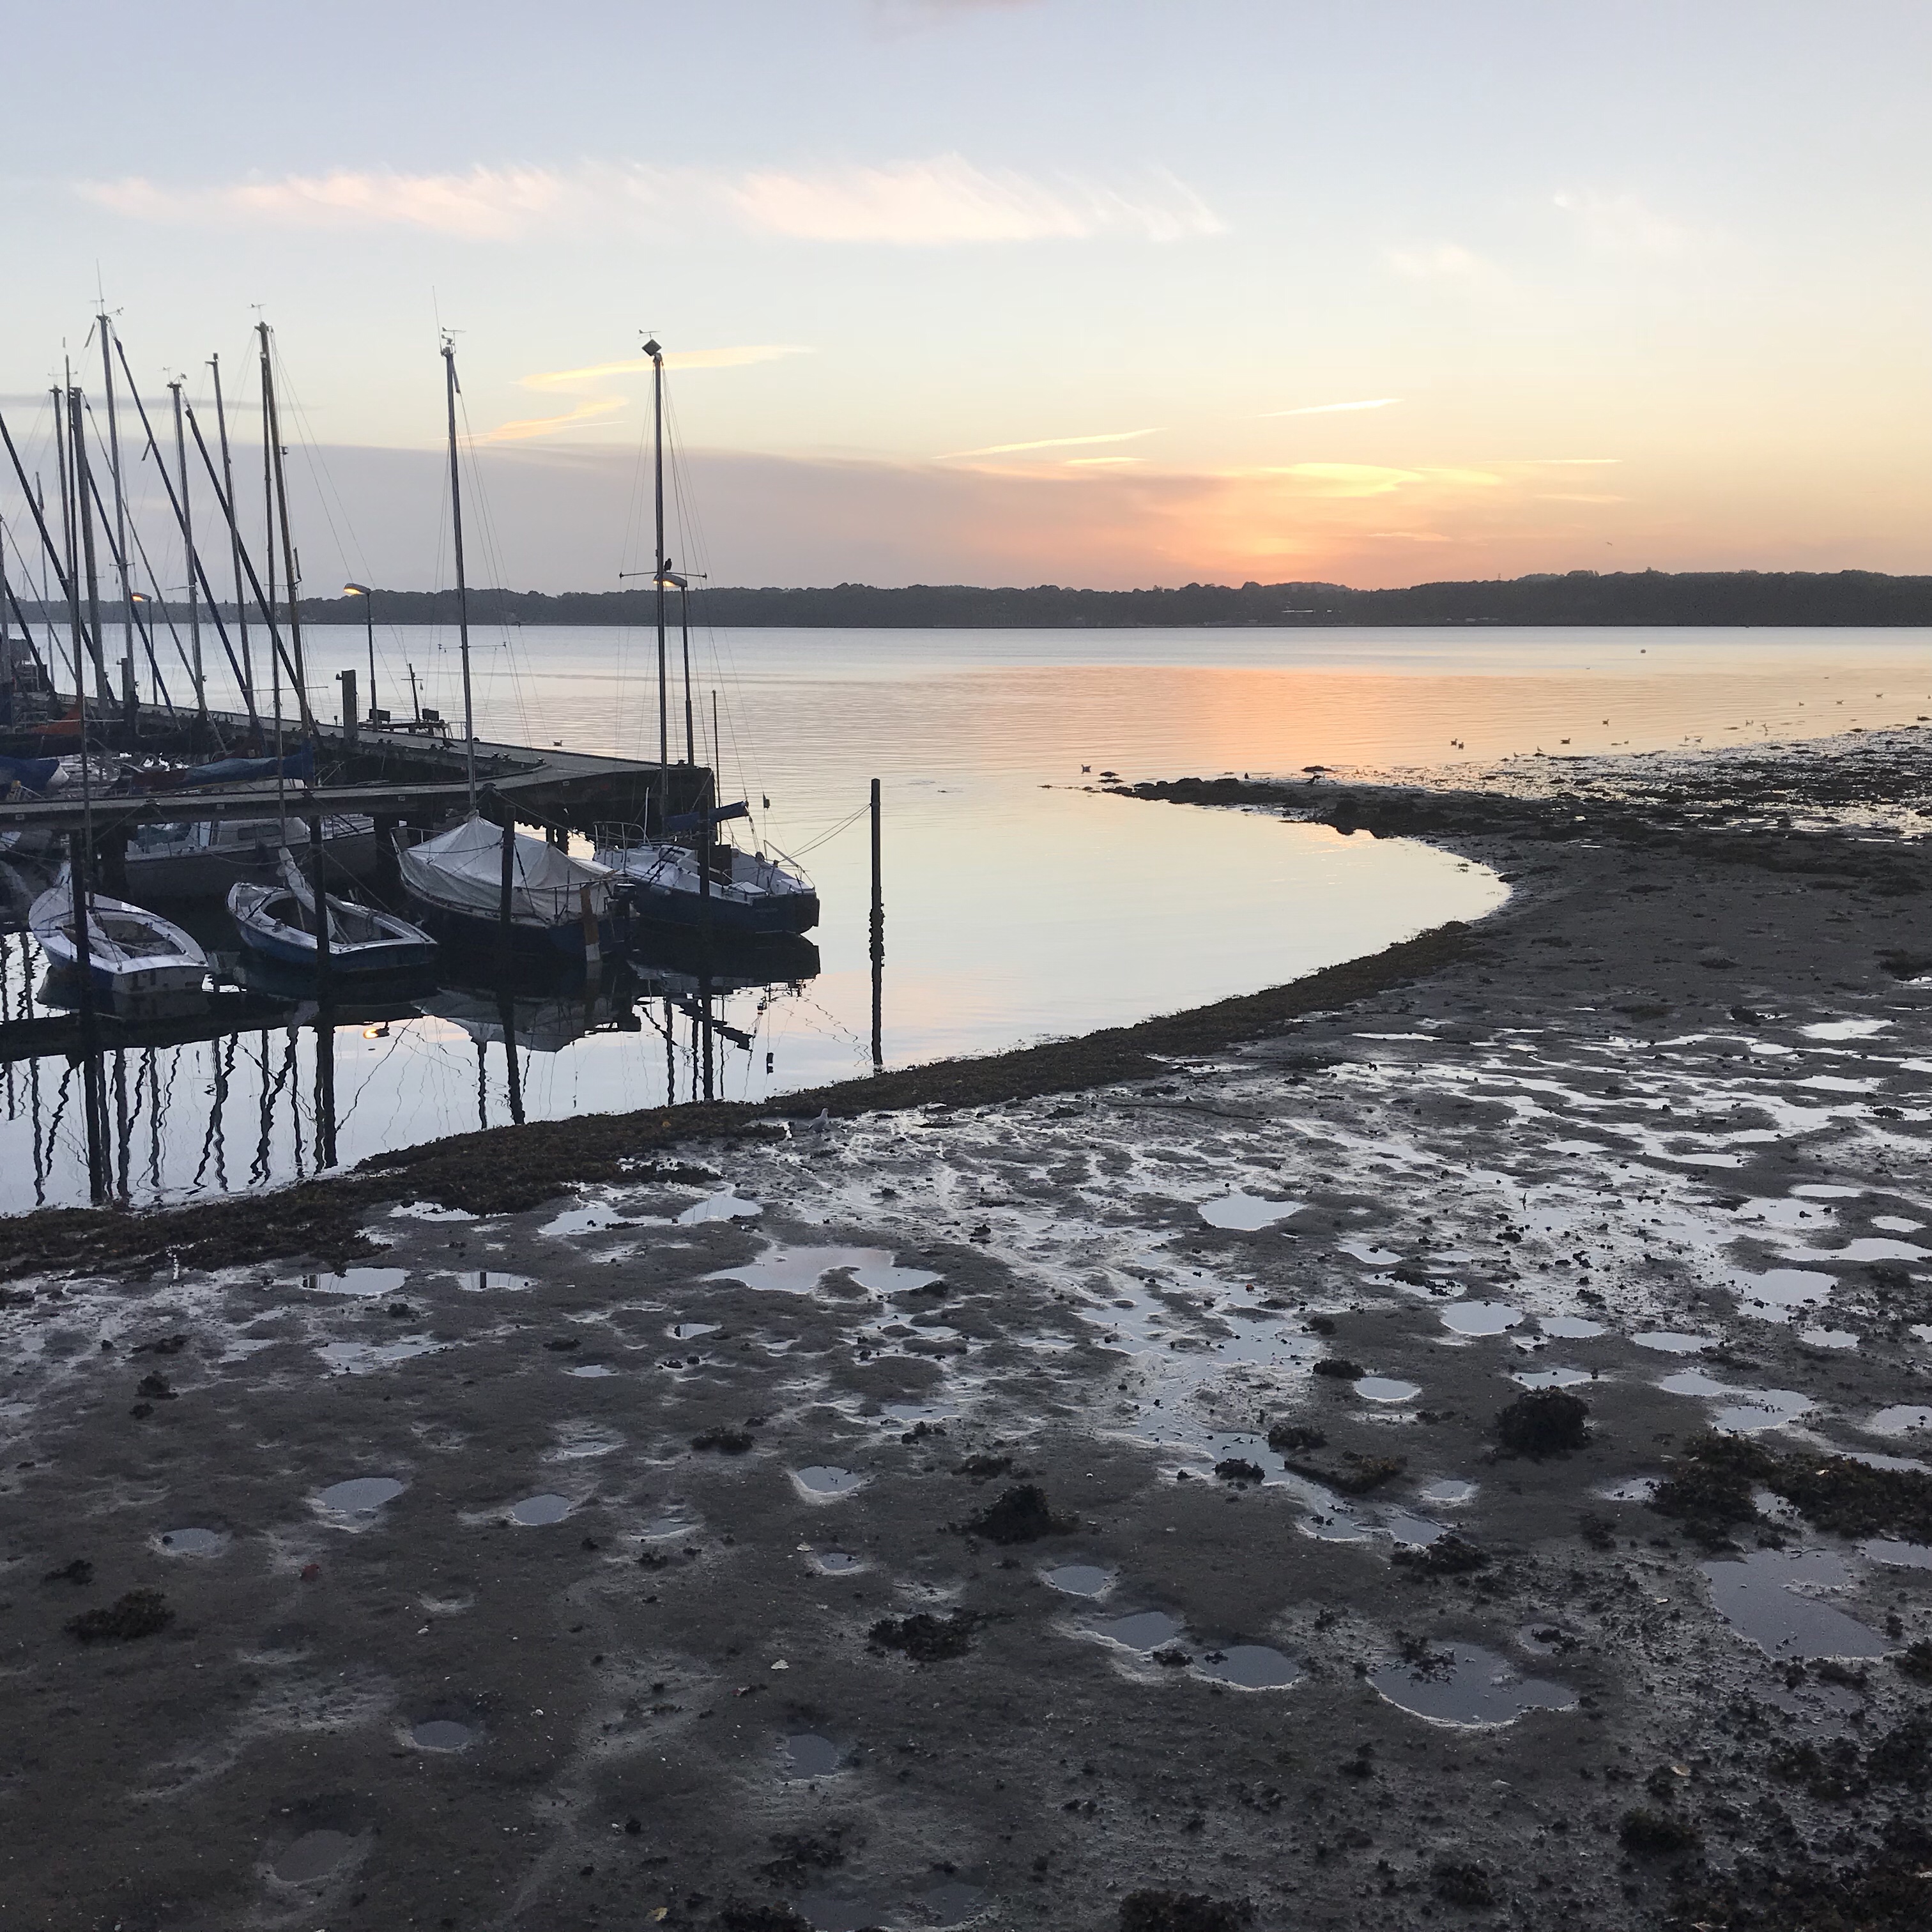
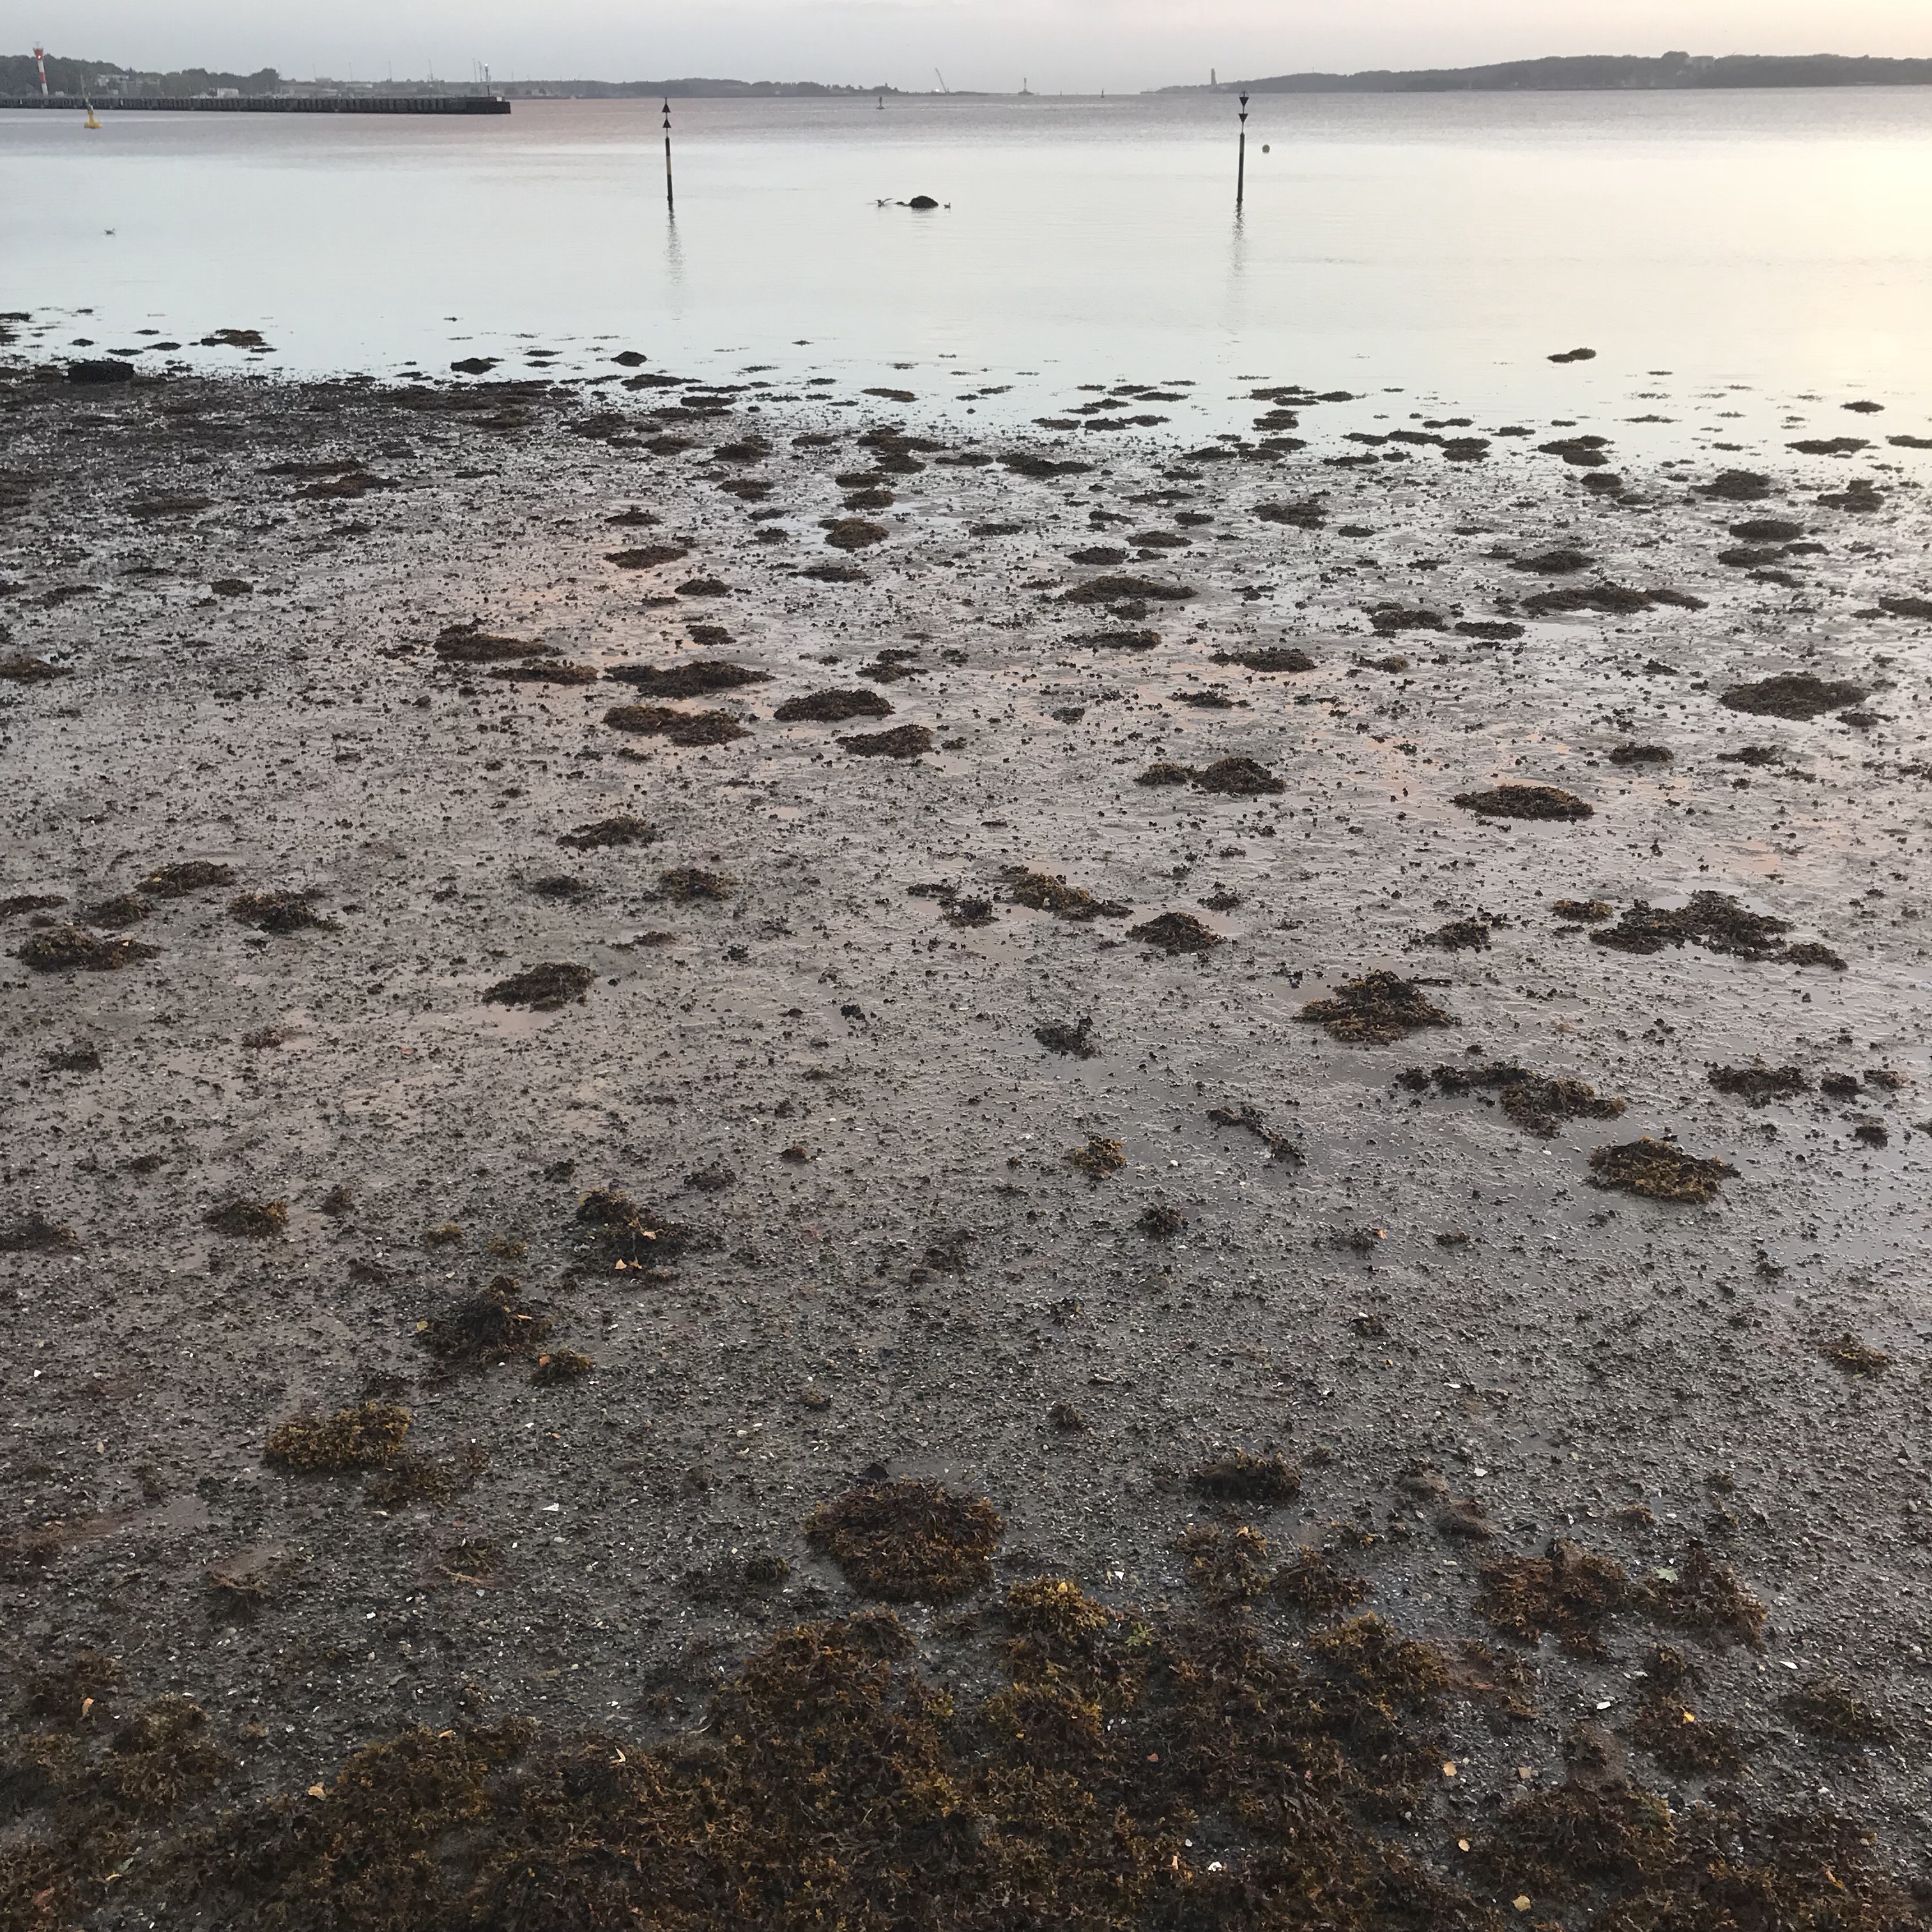
And — at last! — it was possible to see from land what those two sticks in the water are warning about: The stone in the middle! I had never actually seen that before. Now I know! And now the water can come back; wave watching is more fun when the waves have slightly shorter periods than the seiche’s 27 hours… ;-)

…Update in the afternoon…

After more rain throughout the day, we now actually see a clear plume of the rain water going through the green lake, with a little mixing on the sides as the green water is entrained!

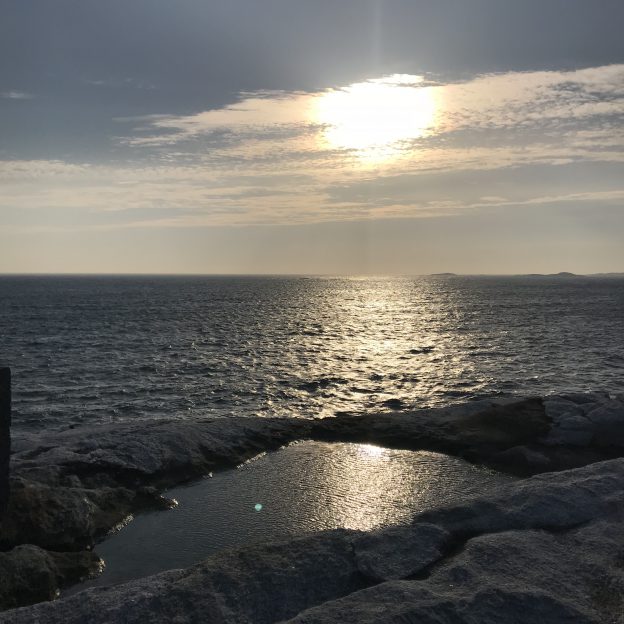
And some water is back in Kiel fjord. Phew. So there is wave watching to be done right away:

Below, we see a really nice example of waves changing their direction as they run into shallow water, since their phase velocity depends on water depth (more about that here).