Tag Archives: student cruise

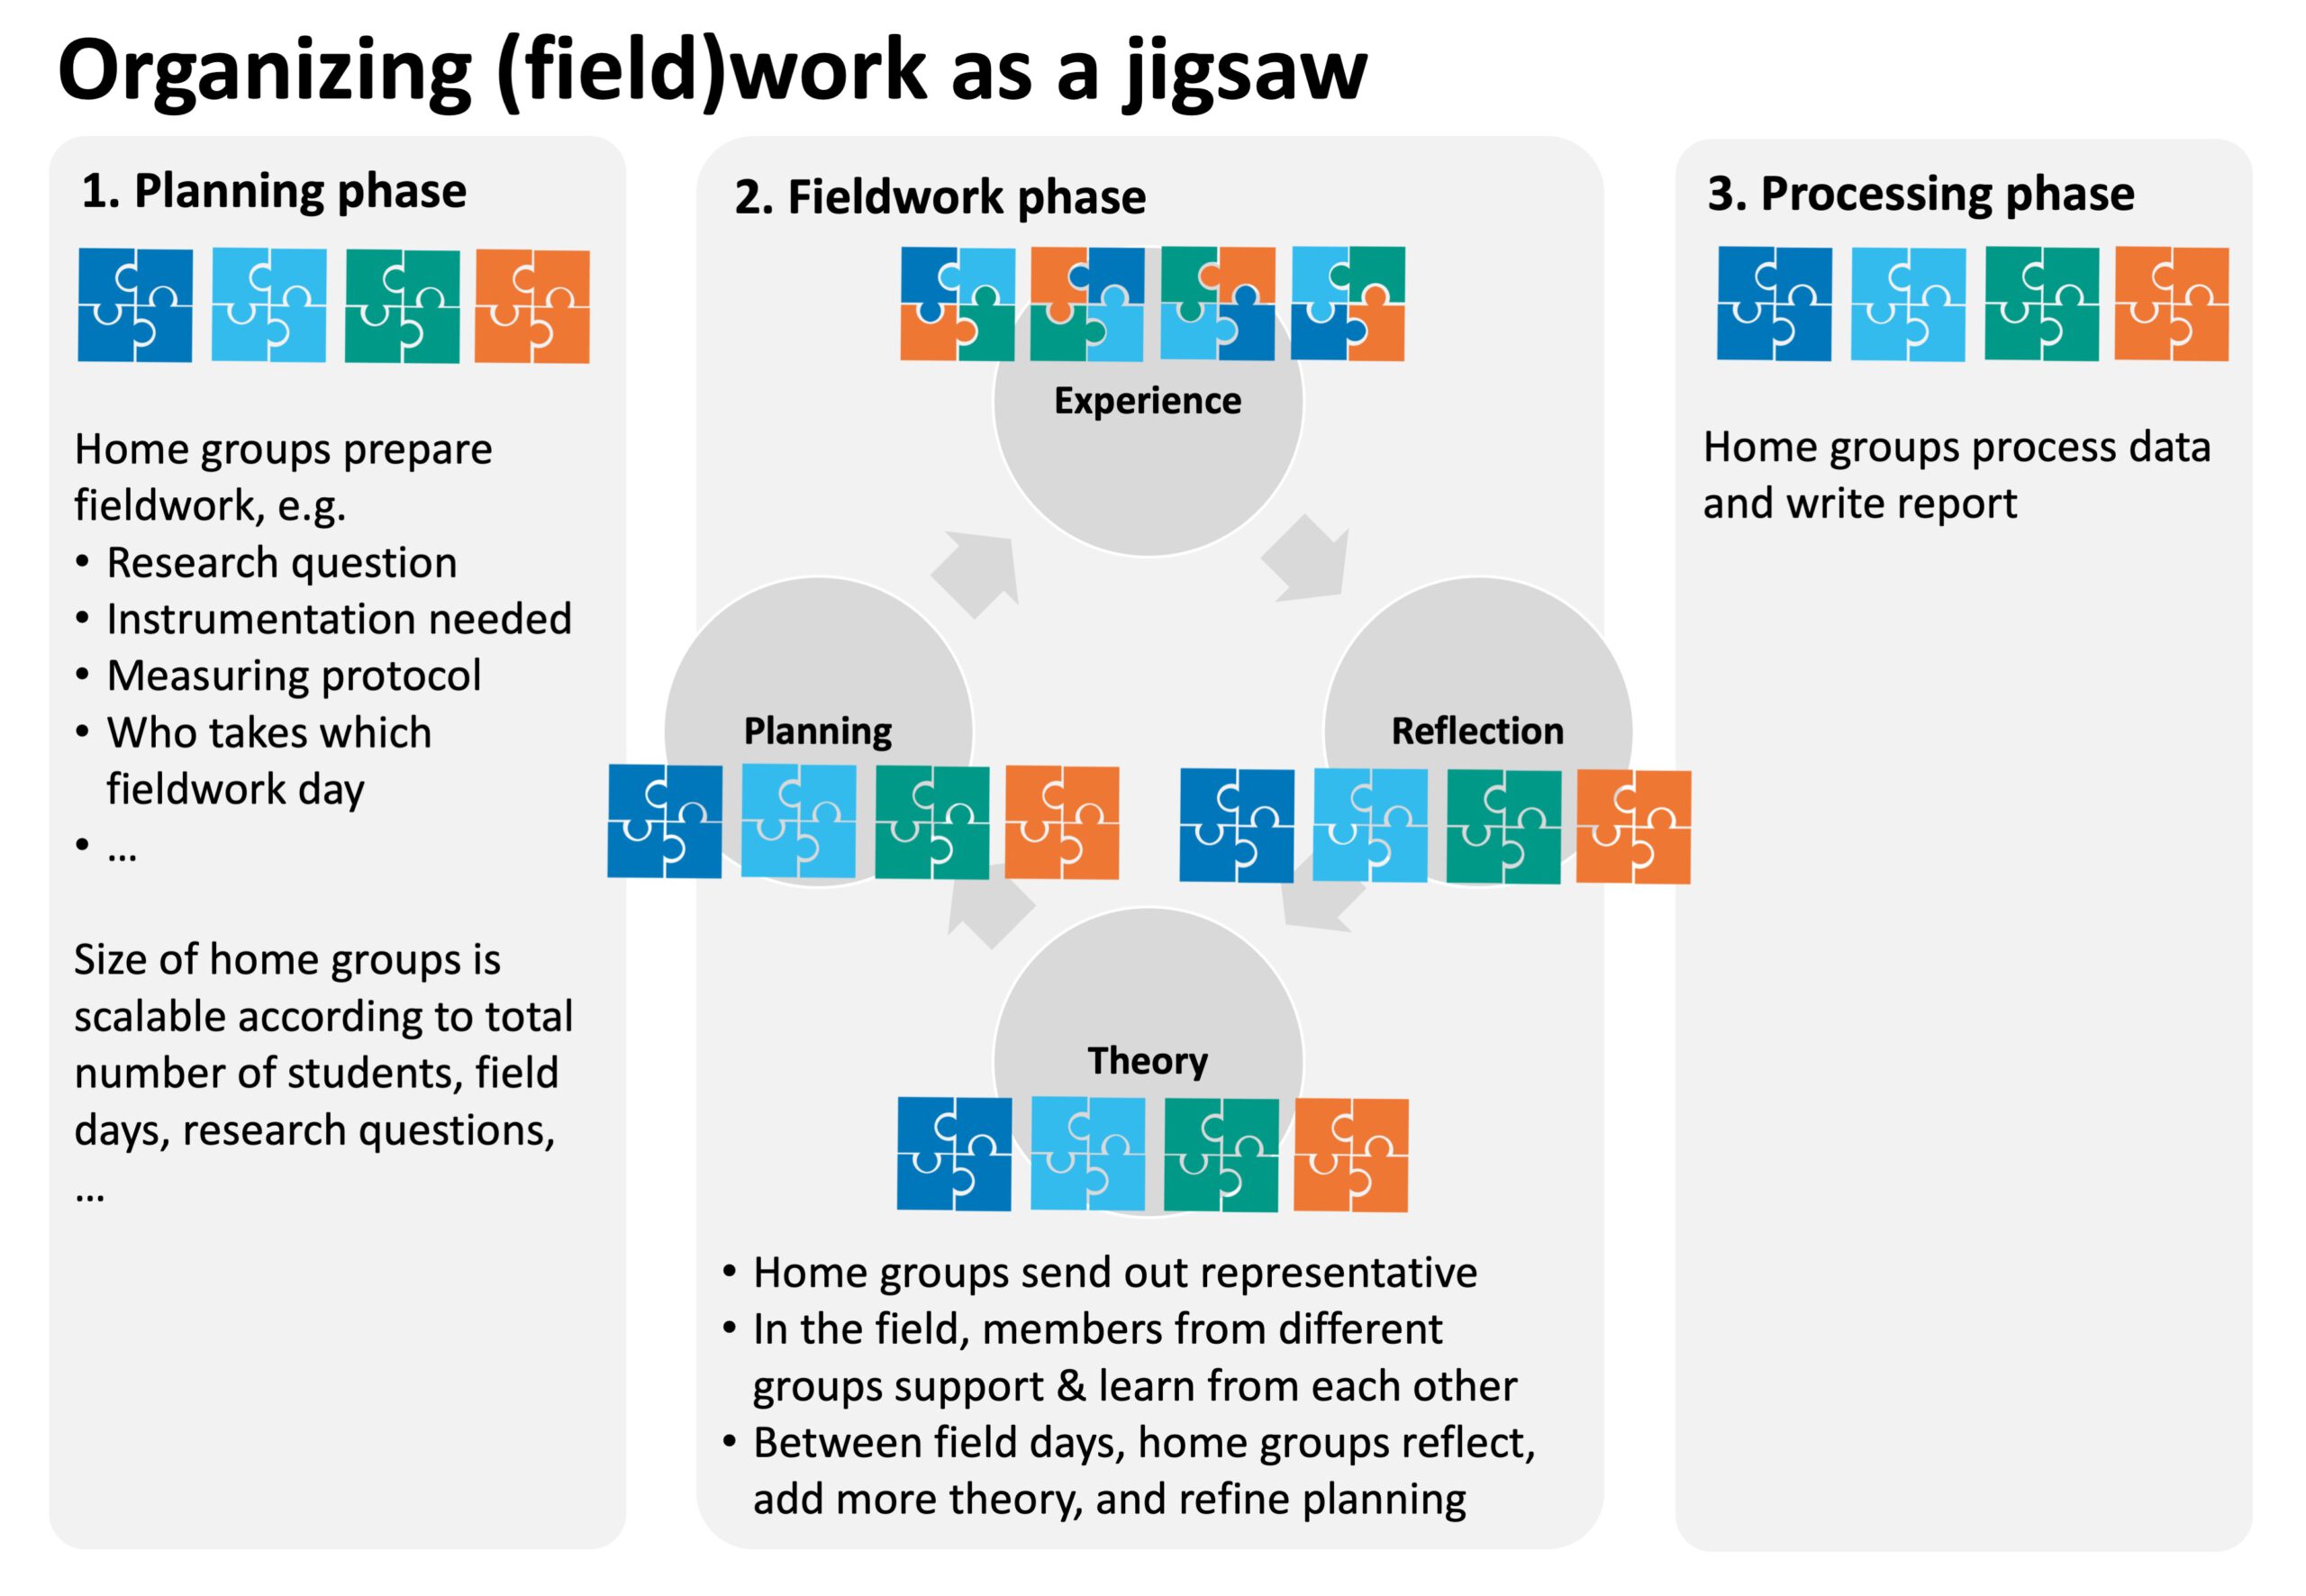
Structuring fieldwork as a jigsaw to increase student responsibility in, and ownership of, their projects

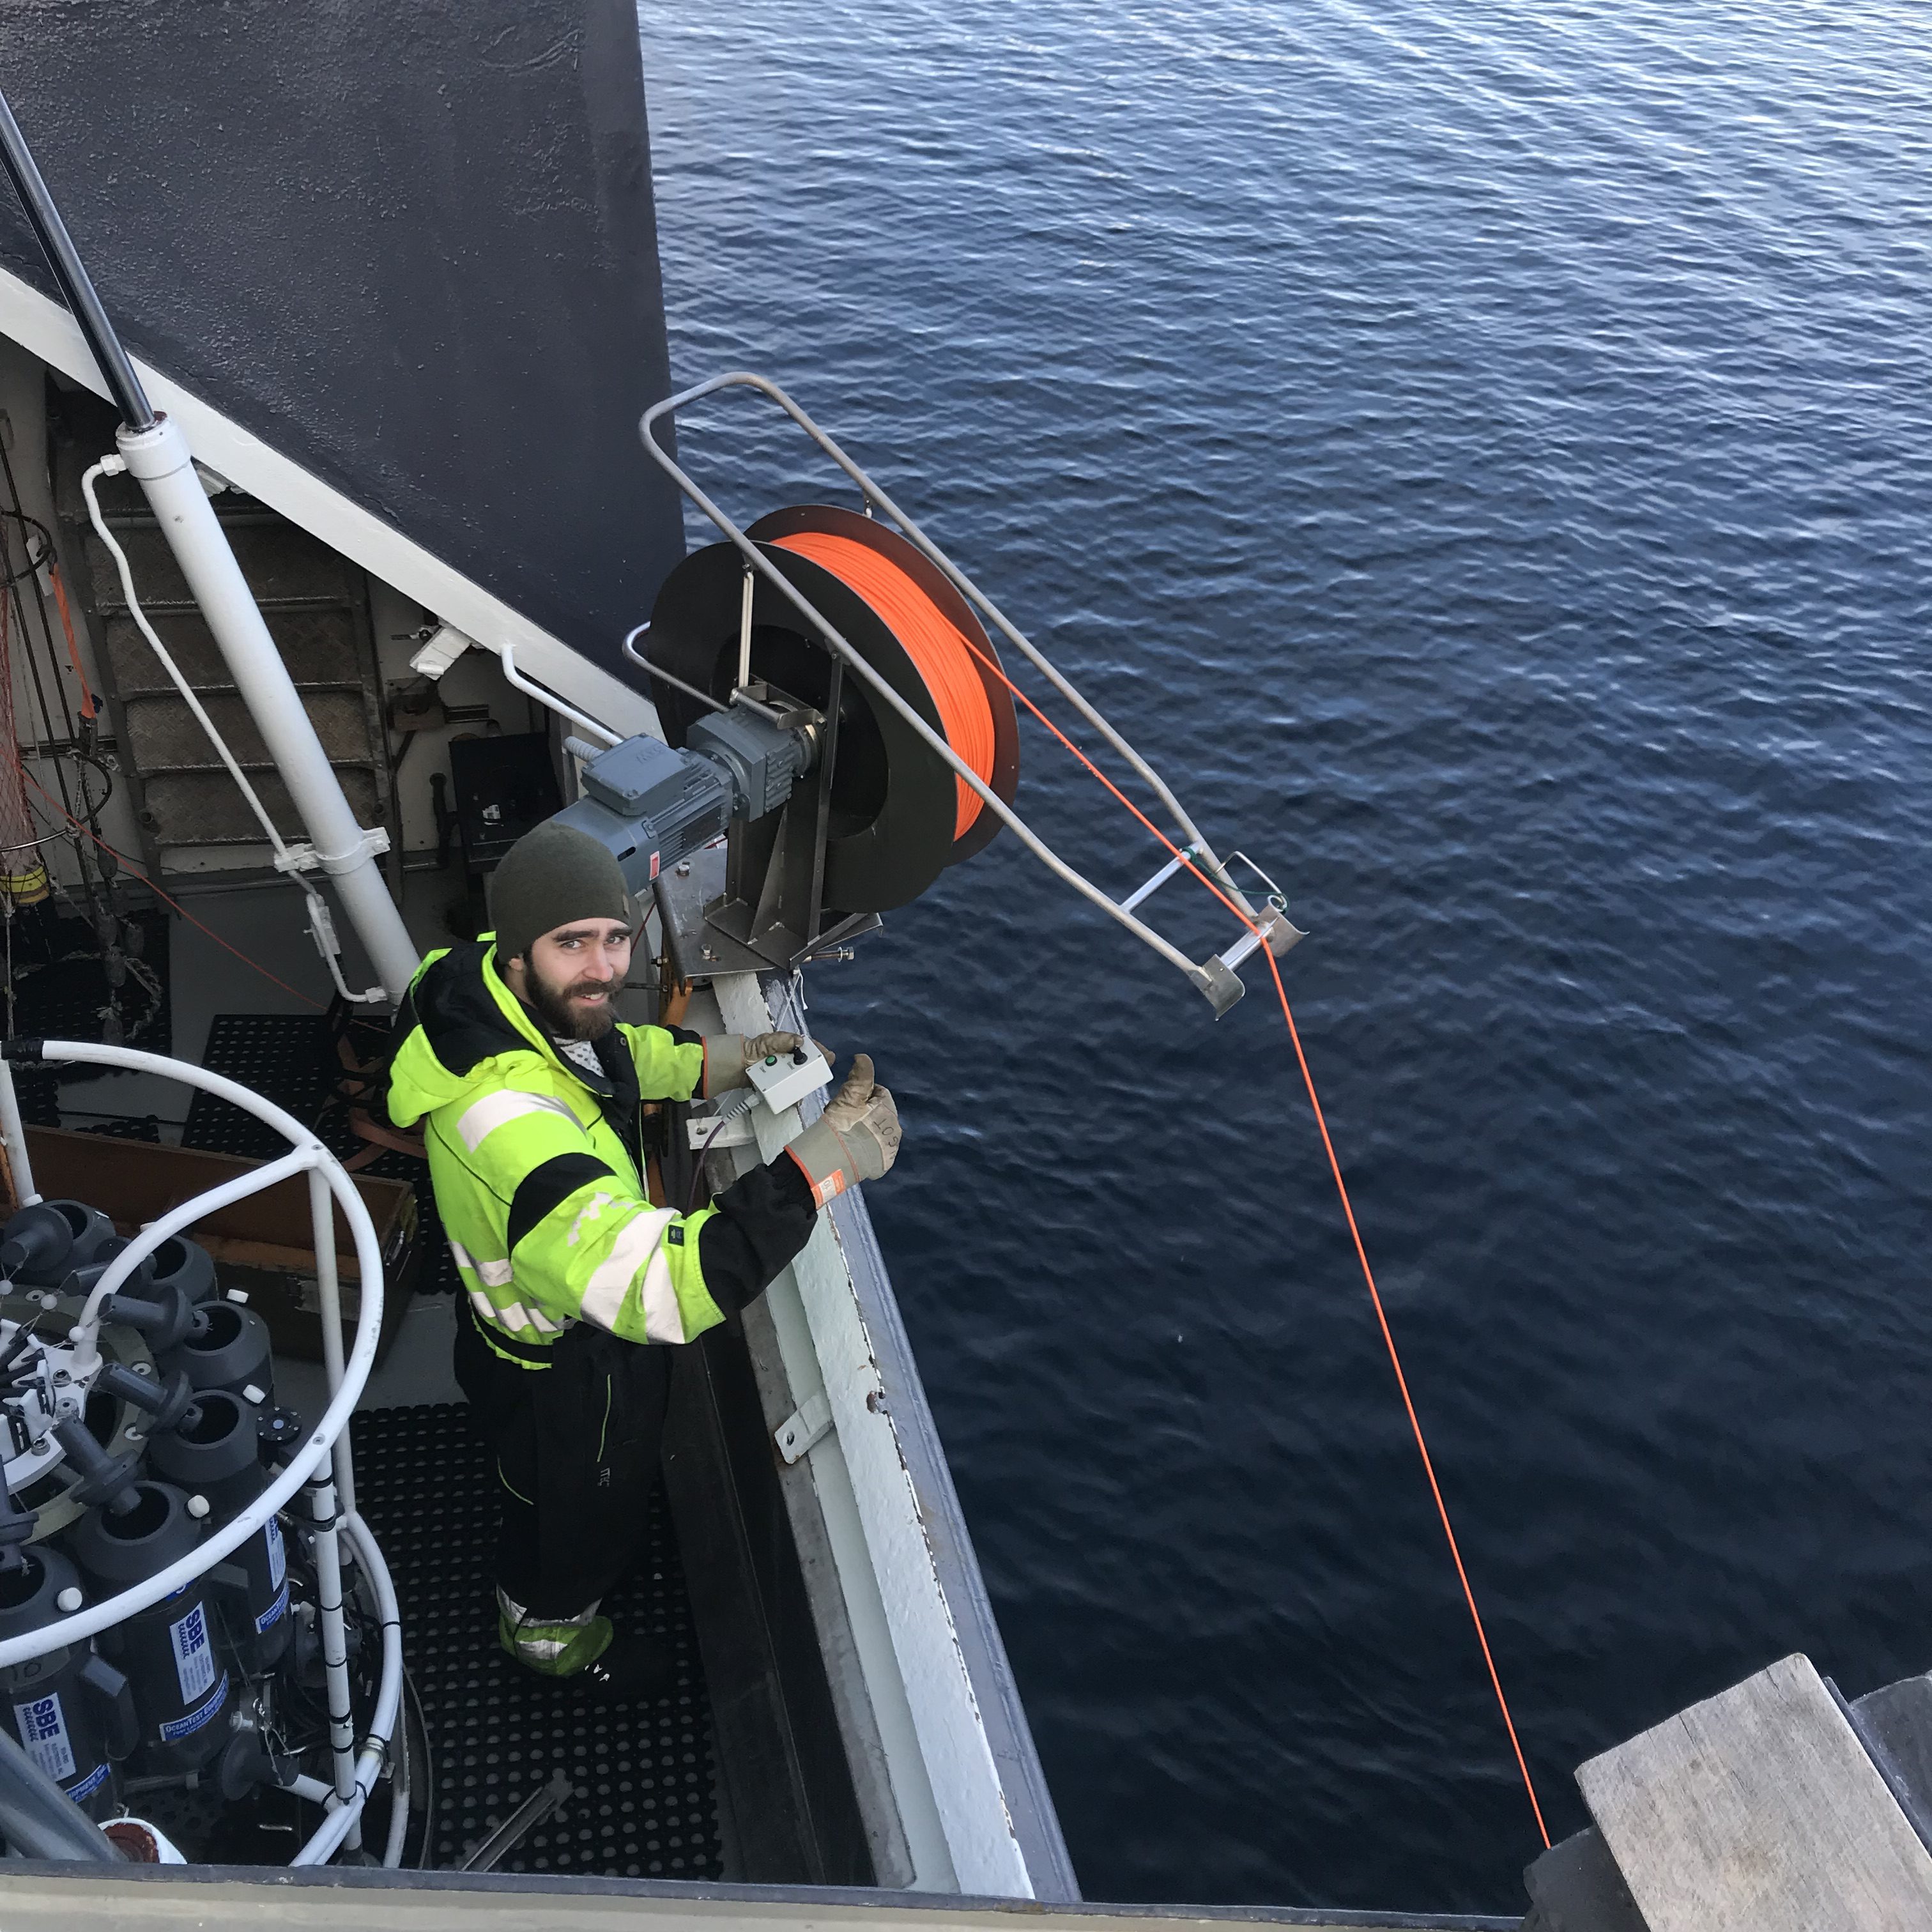
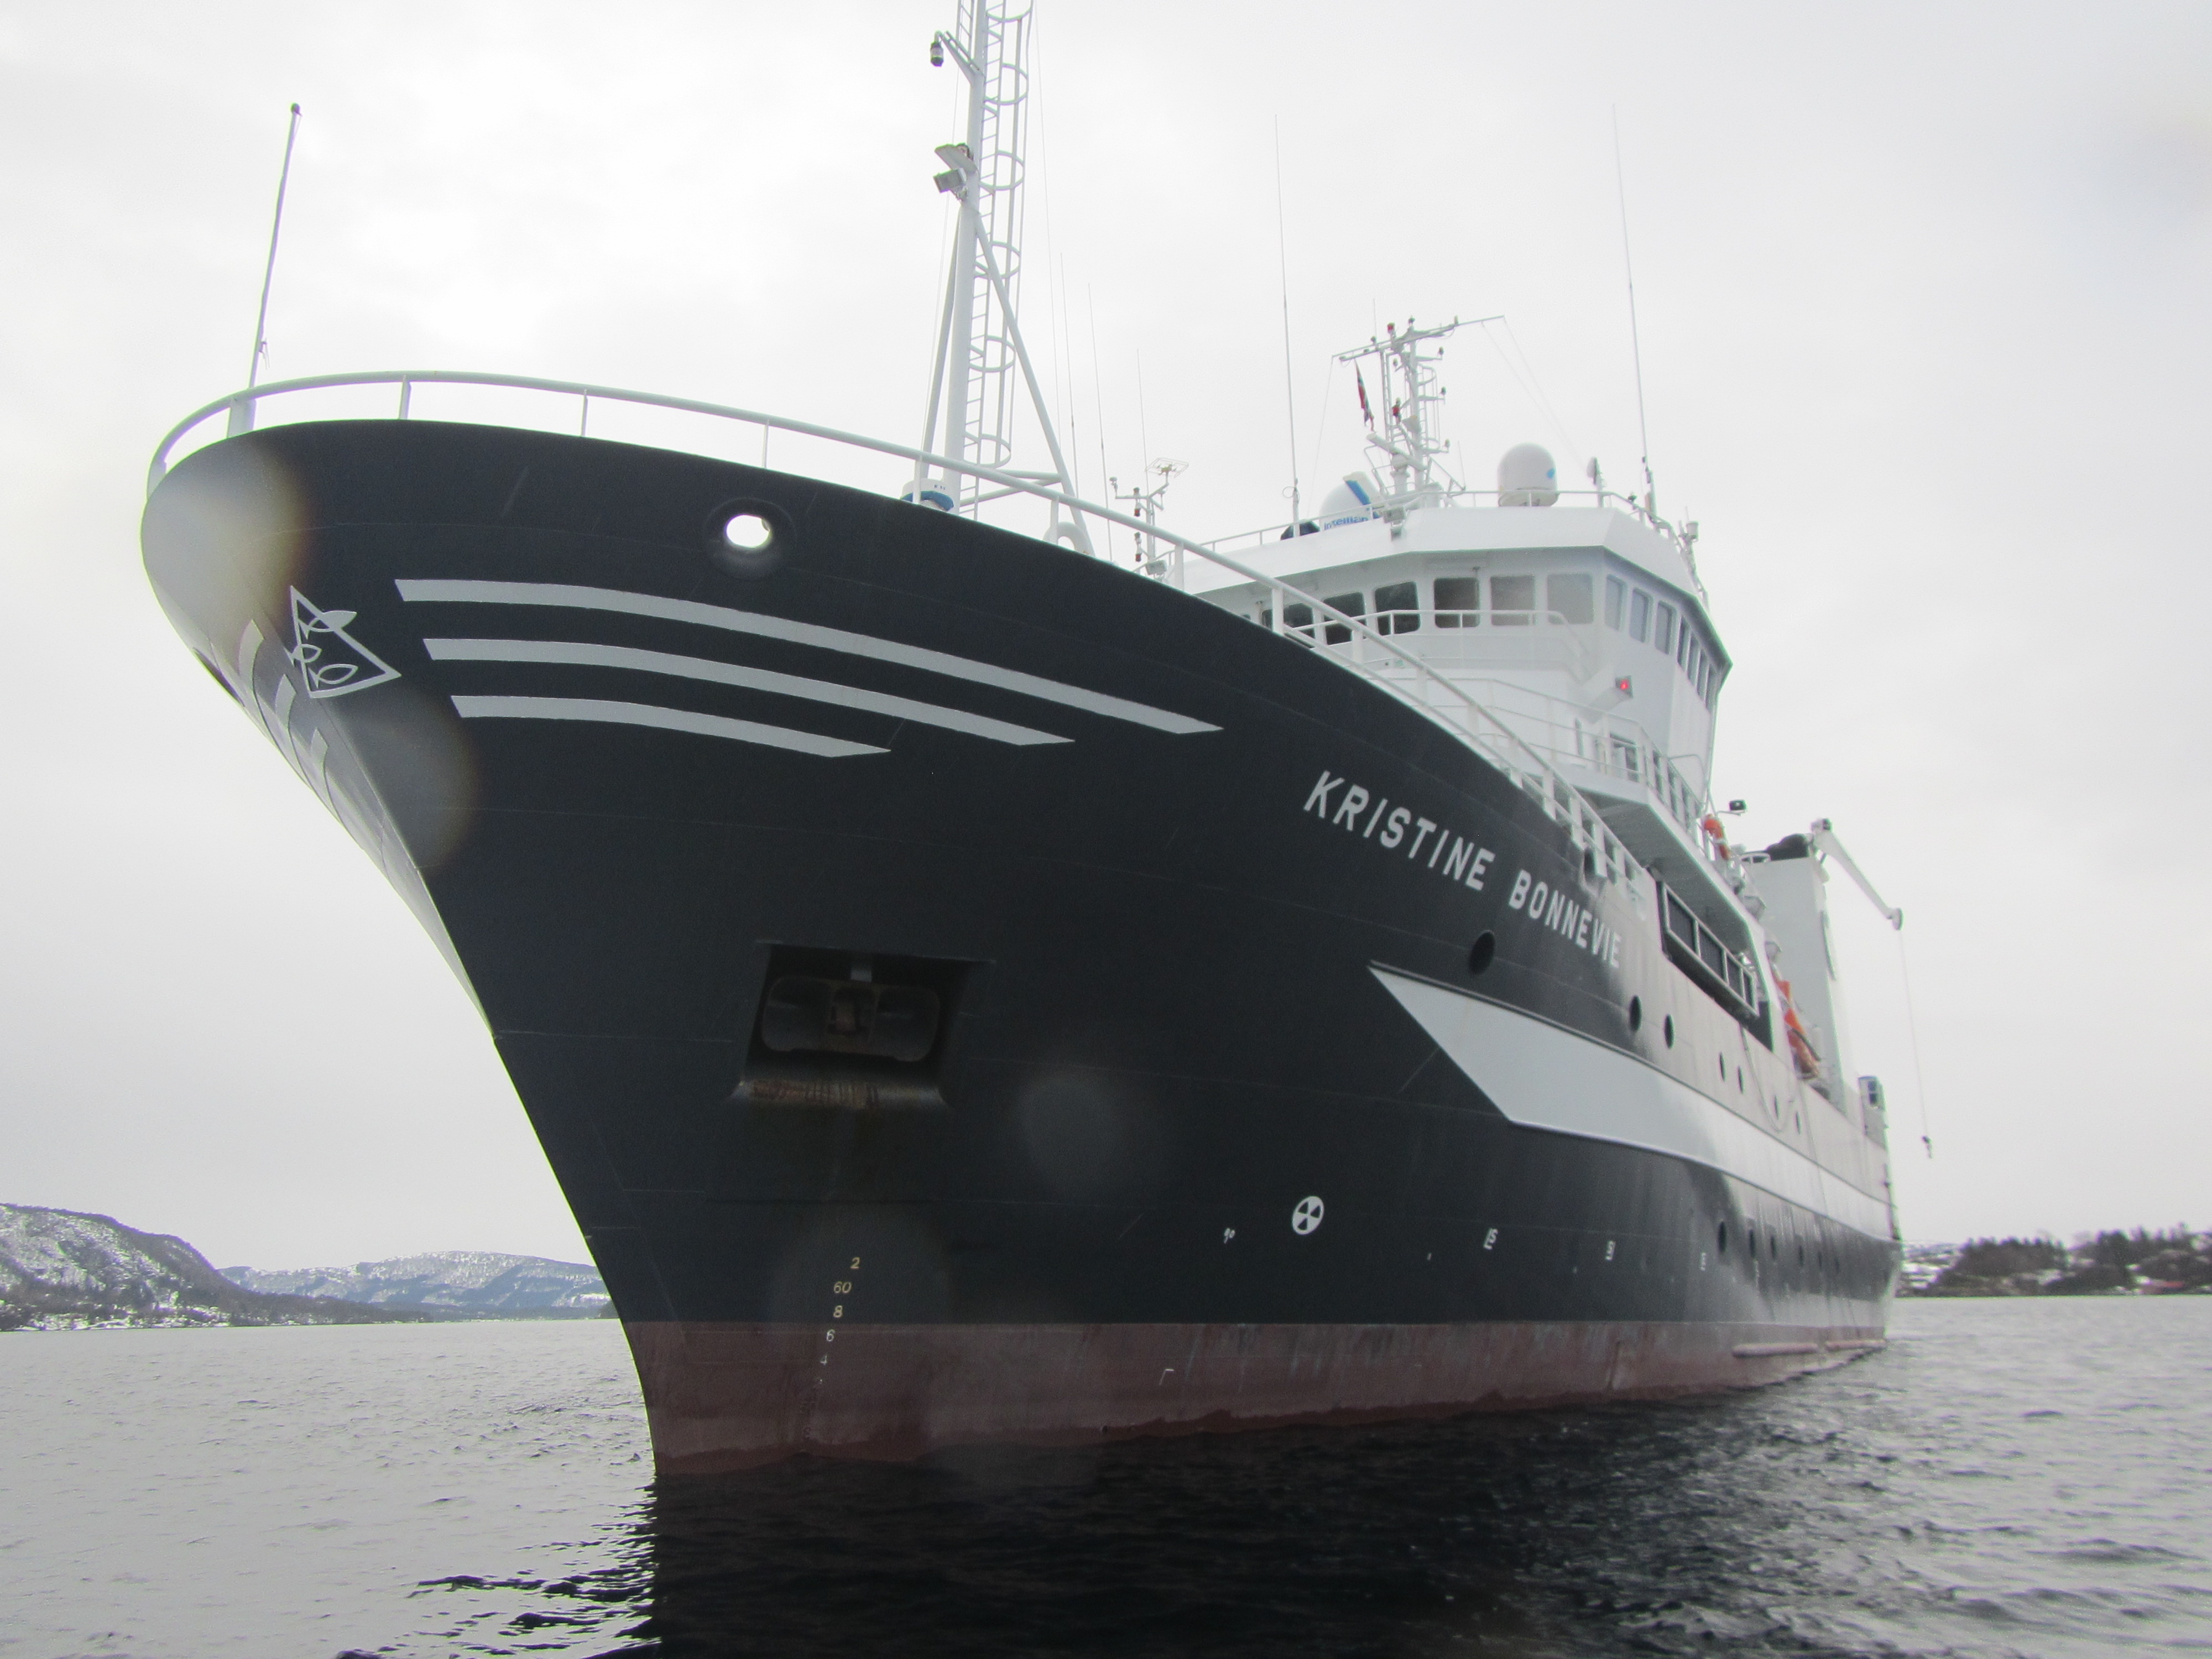
I am a huge fan of Kjersti‘s excellent teaching, it is always so inspiring! She, together with Hans-Christian, developed a jigsaw method to structure preparation for a student cruise, the cruise itself, and then writing of cruise reports. We wrote it up and submitted it for a forthcoming book on field teaching (which I will share links to as soon as they become available), but here comes an extended version for you already!

Continue reading

Published now: “Activity bingo: Nudging students to make the most out of fieldwork”

Kjersti and I, together with Linda and Francesco, just published an article in Oceanography on the fieldwork bingo we developed for the student cruises earlier this year (and that came quite a long way from our first version as a postcard!). I am currently very much on the bingo-as-a-tool-to-nudge-people-to-do-stuff trip (see also my “Universal Design for Learning” bingo), so I am happy to now have an article I can point people to! So go and read Glessmer, Latuta, Saltalamacchia, and Daae (2023): “Activity bingo: Nudging students to make the most out of fieldwork”!

Continue reading

Developing a “student cruise bingo” to make learning visible & fun

I am super excited to work with Kjersti again on an upcoming student cruise next month; she is such a great teacher and it is always inspiring to observe her interactions with students! Also: We always have lots of fun ideas, and usually act on them pretty spontaneously, too. Like this one: We want to bring a “cruise bingo” with us, so here is what my current planning looks like!

Continue reading

Using #WaveWatching and #KitchenOceanography to prepare students for a one-day research cruise

When students have only one day at sea, it’s important to prepare them well for what will happen there so they get the chance to make the most of the experience. For example, let’s consider a one day student cruises just outside of Bergen. Students are divided in teams that use different types of instrumentation and that investigate different questions. After the cruise, students use the data they acquired during the cruise to write a report on the data.

There are several different aspects that I would like to prepare the students for:

  1. Recognizing and understanding the relevant physical processes they are supposed to investigate
  2. Dealing with the data both onboard and once they get back home

Below, I’m expanding on my thoughts on how to do that.

Recognizing and understanding the relevant physical processes

Let’s look at two typical teams on those student cruises: the “drifter” team that deploys surface drifters and interprets the trajectories later on, and the “CTD” team that takes profiles of temperature, salinity and other properties of the water column and then interprets those afterwards.

Interpreting surface drifter data

In the area investigated during the student cruise, there are several processes that influence which way a passive surface drifter will take, e.g. tidal currents, wind-driven currents, the circulation induced by fresh land run-off, wave-induced drift. Also there might be effects of wind on the drifter (although when designing the drifters, care was taken to minimize the effect) or of other processes. The relative importance of those processes is not necessarily clear beforehand (or even when looking at the data), and it is most likely neither constant in time nor in space. So even though it seems like it should be simple enough, it’s not an easy task!

Additionally, even though students are theoretically familiar with some of the processes, their familiarity is mostly restricted to theoretical considerations of ideal cases, not with messy mixtures and real-life cases. So my suggestion would be to help them familiarize themselves with these processes, for example like this:

First: help them realize that there are many many many processes happening simultaneously

One way to do this is to provide a picture that shows many different things at once and ask students to annotate it with a certain number of processes they can spot. Knowing that there are at least four (or however many) processes to discover in the one picture they are given gives them confidence to name at least that many, or to keep looking until they’ve found that numer.

I usually use a different example, but since tomorrow is #CTDappreciationday and I’ve been looking at old CTD pics, I thought I’d give you a new one:

In this picture of a submerged CTD, we see any different processes, for example looking at waves: a wake-like wave where the CTD wire has been cutting through the water as the ship moves relative to the water, the splashes that happen when drops from the crane fall into the water and the little crowns they form, how the waves spread as rings from the points of impact, how different waves are supperposed and the interference pattern they form. Or ALL the optics of light going in and out of water: how shapes appear deformed, how colors change, … And many more!

Obviously it would be advisable to chose a picture that shows processes related to what the students are supposed to investigate.

Second: ask them to observe a given location and observe and describe as many different (or three, or five) situations as possible

This task is similar to the first one, but not having the reassurance that there are so-and-so many processes visible at the same time makes it a little more difficult. But it’s a great exercise to try and find as many different things going on in a system, because it will later help them to think of processes that might influence their observations.

For location ideas, check out the #BergenWaveWatching series over on Elin’s blog!

Third: ask them to go & discover a process “in real life”

Now that students have seen that life is messy and processes aren’t usually occuring in isolation, but are superimposed on or interacting with others, they are ready to go find a process in real life. To prepare students of the drifter group, useful tasks could be to find (and document) instances of

  • a tidal current (and how do you know it’s a tidal current and not just a regular gravity-driven current like in a river? You might have to come back at a different time, or relate the current to tide tables)
  • wave propagation and current direction not being aligned (since surface waves are a lot easier to observe than current direction, it’s easy to assume they are always in the same direction. They are not!)
  • land run-off forming a buoyant (and possibly differently colored) plume in saltwater (or any other water forming a plume in a larger body of water, e.g. a storm drain going into a lake)

Even if students might not find the exact process you were hoping for, that’s ok! They will probably have an explanation for why their replacement is a good one, and that means that they put some thought into it, too.

Four: ask them to observe (some of) the relevant processes in real life and collect data

I find it a very useful exercise to try and collect data on a phenomenon without any proper equipment. For example, a tidal current can be related to the position of buoys within it, or the tidal elevations can be estimated by repeatedly taking pictures of the same pylon of a bridge. And then, of course, plot the data and discuss it!

It might seem like busywork, but I would argue that it really helps practicing observational skills. And they are going to appreciate instrumentation so much more once they get to work with it later on! :-)

Five: relate it to what to expect at sea

This is the really difficult part. From their short cruise, students will come back with a data file full of numbers, i.e. the positions at the drifter at a given time. How does that relate to what they’ve been observing until now?

Well, the idea is for them to come back with so much more than just the one data file with drifter positions. Ideally, since they know how messy the system is they are about to interpret, they’ll come back with data on the wind field (either from what the atmosphere group measured, or from the regional weather forecast), with data on the tides (from tidal gauges in the area, or models), with observations of wave height to calculate Stokes drift, with observations of anything unusual (like once when one of our drifters got caught by a ship and displaced). Ideally, all the practices we did beforehand prepared them to realize that they will want to have all this data, even if only to exclude the influence of one or several of those factors.

Ok, so much for our drifter group. Now on to the CTD group!

Interpreting temperature & salinity profiles

Temperature and salinity profiles have arguably been the most important type of oceanic data in the history of oceanography. They are also not something that is easy to come by, because you typically need a ship and some instrumentation to measure them. But there are still ways to help students familiarize themselves with the idea of temperature and salinity profiles in a practical way before their cruise.

First: help them realize that there are many many many processes happening simultaneously

Temperature and salinity profiles are really difficult to interprete because there are SO MANY things influencing them! A really good way to realize that is by asking students to do a simple overturning experiment and draw profiles over time in fixed location.

In the very simple overurning experiment, T and S profiles could look something like what’s sketched in above. The red dye is heated (in order to make it buoyant enough to stay on top and mark the surface flow). I’m writing “S” in quotation marks, because I’m lumping both red and blue dye together as “something dissolved in water”, which I abbreviate as “salinity” for this purpose… And of course, all the overshoots in S don’t make sense, as I realized when I couldn’t be bothered any more to draw it again… But a good point to discuss, maybe? :-D

Here we see that it’s not just the cooling driving a circulation, we also see salt fingering occurring as the red dye cools and thus becomes denser than the clear water at the same temperature. So even in such a simple experiment there are different processes happening at the same time!

Second: ask them to observe a given location and observe and describe as many different (or three, or five) situations as possible

Same as I suggested for the “drifter” group, possibly with a focus on processes that influence temperature and salinity (river runoff, rain, evaporation, mixing by surface waves, parts of the body of water that are in the sun vs shade). The point is not necessarily to find the most relevant process, but to recognize which processes might potentially have an influence (even if minuscule) and thus make interpretation of observations more difficult later on.

Three to five

The temperature and salinity profiles are influenced by similar processes as I described for the drifter group, because they are shaped by advection of water with different properties and from different directions. So trying to observe the processes described above makes a lot of sense here, too! As do the other steps I described above.

But now how do we prepare students to cope with the data once they are back from their cruise?

Dealing with the data

Students are provided with finished programs that read in and plot the data, that they only need to modify if they want to show things in a different way. Yet it’s surprisingly difficult for them to manage that when they come back from the cruise.

There are several aspects to dealing with data that we can help students prepare for:

  • getting data into the program you want to work with, and making plots
  • interpreting plots
  • interpreting data

Of course, all of this could be done just by using last year’s data (and actually maybe it’s not such a bad idea to ask students to re-run someone else’s analysis, because then they KNOW it worked a year ago, so unless they changed something, it should be working again now). After reproducing last year’s figures, students could read last year’s interpretations of those figures and discuss whether they agree with them or what they would do differently (obviously this works best if last year’s interpretations are somewhat helpful).

BUT it could also be done using new data that the students generate themselves as part of their observations earlier. For example for the temperature and salinity profiles in the easy overturning experiment, they could use some depth axis and assign numbers to the profiles that qualitatively represent the shape they drew earlier (or, if you wanted to get fancy, you could probably use temperature probes in the tank and get actual numbers). The idea here is not to get data that is as complex as they would get on the cruise, but to get a data file that is similarly structured to the ones they are expecting to get, to read it in, to plot it, and maybe practice to modify axes etc..

What do you think? Any suggestions, comments, feedback?

Wave watching in a bucket

On the GEOF105 student cruise that I was lucky enough to join like I did last year, I happened to observe what you see in the picture above: Standing waves in a bucket! And this isn’t a staged photo, this is me taking a picture of a student at work.

We are looking at the bucket the students use to take surface water samples which they measure on deck. The bucket happens to stand just above the engine room. Which leads to vibrations. Which, in turn, leads to waves. Many different kinds of waves! In addition to what you see above, we find, for example, plain circular waves. They might look like they do in the picture below:

And here is a short movie of the waves, first in real time, then in slow motion.

Sometimes the circular waves also have other wave lengths.

The next pattern that develops from a monopole (like the one you see above) is my favourite: A monopole with higher order stuff developing at the edge of the bucket.

Watch the movie below to see it in motion (first at real speed, then in slow motion).

The next step, then, is water that almost looks as if it was boiling. Like so:

Here is a movie of the bucket with the “boiling” wave pattern, again in real time first and then in slow motion.

The movie below shows a close-up of some of the waves in the “boiling” state, when there was enough energy in the system to throw drops up in the air. The movie goes from real time to slow motion. Careful when you play it, I left the sound in in order to show how the frequency of the waves is the same as the frequency of the engine. (And because of the annoying sound, it doesn’t start up automatically, so you have to click to play)

Here is a movie that shows the bucket in different positions, shot continuously to show how quickly the wave pattern develop and also how close together the different spots with the different pattern are located. Thanks for playing along, Kjersti!

So clearly the location has an influence on what wave pattern develops. But what are other important factors? We tested material, shape and size of the container.

A small plastic bucket which is almost cylindrical, for example. Guess what happens?

We can get the same wave pattern as in the large bucket! The movie below shows three different wave pattern. When the frequency suddenly changes that’s because the movie is in parts played in slow motion.

As to material: It seems to be important that it’s flexible. Iron cast pans don’t work (yes, there is water in it!), neither do metal lunch boxes…

And round shapes make nicer waves. But the rectangular vanes of the surface drifters (aka paint roller trays) also make pretty pattern! But now the waves are, unsurprisingly, only parallel to the edges of the tray.

Yep, this is the kind of stuff that makes me really happy! :-)

Measuring turbulence with a microstructure sonde

One of the instruments that was used on our recent student cruise was the so-called MSS (“MicroStructure Sonde”, sometimes also called VMP, “Vertical Microstructure Profiler”) — an instrument that is used to measure how much mixing is going on in the ocean. Those measurements can help us figure out e.g. renewal rates of bottom water in fjords, which are interesting because of the very low oxygen concentrations found there, and their impact on biogeochemistry. And of course it’s also interesting from a purely physical oceanographic curiosity :-)

In the picture below, you see the MSS being deployed: It’s a slim instrument, maybe 1.5m in length, that is attached to an orange cable that runs on a small winch.

And a big THANK YOU to cruise leader Elin (observing from the upper deck) for bringing me along on this cruise! :-)

At the end of the instrument that sticks over the railing in the picture above, you can make out little pins, protected by a metal cage. Those are the sensors for both temperature and velocity shear, both measuring at very high frequency, many many times per second. They are also very sensitve, so in the picture below you see the wooden crate that is used for storing the instrument in between stations.

Once the instrument is deployed into the water, it is not just lowered down in the way a CTD is, but it has to be free-falling through the water. In order to achive that, the person running the winch has to constantly watch the cable going into the water to make sure there is some slack on the cable.

Algot is running the MSS winch

A second way to make sure the instrument is free-falling is to constantly monitor the incoming data on a PC onboard the ship.

Elina is working the MSS “inside job” (Picture by Sonja Wahl)

While the data is being monitored, also the depth the instrument is at is being monitored, or rather its pressure. Since the instrument is free falling, it is not a simple feat to make sure it gets fairly close (approximately 10m) to the bottom, but does not hit the bottom and destroy the sondes. One way we’ve done that on the student cruise is by stopping the outgoing cable when the instrument was at 75% of the water depth and let it fall, and then once the instrument is within 20ish meters of the bottom to start hauling the cable back in (“panic” in the list below ;-))

Snapshot of the piece of paper used to keep track of what’s going on at the current station

Looking at the picture of Algot below, you know that the instrument must be on its way up. Why? Because there is clearly no slack on the cable!

Algot is bringing the MSS back to the surface

In the picture below, do you see the green fringe on the instrument, as well as the rope slung around the metal protection cage thingy for the sondes? Those are there to make sure that no eddies (and especially no trains of eddies) develop while the instrument is falling, because if the instrument was vibrating or moving in some way other than just falling freely, that would influence the data we measure.

The instrument is then brought back on board, and we are ready for the next station!

Algot and Arnt Petter bring the MSS back on board

And which spots did we measure turbulence in? In many, but especially on either side of the fjord’s sill, because that’s where we expect mixing due to tides going in and out (which we also saw in the fjord circulation tank experiment!).

What’s the etiquette on a research ship? “Soft skill” learning outcomes on a student cruise

While student cruises usually have a lot of desired learning outcomes related to being able to use oceanographic instrumentation and knowledge of regional oceanography, ultimately one of their purposes is to equip students to function well as sea-going oceanographers, should they choose to take that direction. So in my opinion, it is very important that they don’t just learn about the science-y side of things, but that they also learn how to work with the research ship’s crew in a constructive way.

Etiquette on a research ship: A sailor’s perspective

I asked my favourite sailor what he thinks we should teach our students about how to behave on a research ship. Here are his top 3:

  1. Always be yourself. If you pretend to be someone you are not, people will find out soon enough anyway.
  2. Just ask. There are no stupid questions and sometimes having asked about something you are not sure about on a ship might end up being crucial for your safety.
  3. Be friendly. ’nuff said.

He says that’s all people need to know about how to behave at sea. While I kind of agree, those three rules are kind of … vague. So here are a couple of things that I have either noticed at sea myself, or heard my favourite sailor & his colleagues complain about during our recent student cruise, so this is stuff that I would explicitly address at some point during the course leading up to the next student cruise, so students go onboard feeling more confident that they know what to expect and how to behave.

Etiquette on a research ship: My compilation

Meal times

While meal times are often given as a one-hour time slot and you might think that means you can drop in at any time during that one-hour window, that’s not how things work on a ship. Usually, this one-hour window is meant as two 30min windows for people working on different watches. In between those two windows, the first group of people has to get out of the mess (not the mess mess, the room where food is served on a ship is called the mess), the tables have to be cleared completely, and food refilled. So to be polite towards the people making sure you get fed, it’s good advice to arrive on time for your feeding window and don’t linger too long after you are done eating, so they can get the room ready for the next group or finish off that meal to move on to other tasks. If people start wiping the tables, it’s a clear signal that you should find some other spot to lounge in. If, however, you have to be late for a meal due to work reasons, everybody will be happily accommodate you and make sure you leave happy and satisfied. Just don’t push it without a good reason.

Thank the cook & galley personnel

This should go without saying, but if someone puts a nice meal on the table in front of you, say thank you. If the food was delicious, let the cook know. “Takk for maten” is something that comes pretty much automatic out of every Norwegian’s mouth, but whatever your background, I think everyone should adopt it on a ship (and maybe also at home ;-)).

“No work clothes” means “no work clothes”

On ships, there are usually areas that you are supposed to not walk through, or hang out in, wearing work clothes. That’s because the ship is the crew’s home for long periods at a time (and also yours while you are at sea), and keeping a home nice and tidy is a big part of making it feel like home. And also it’s just mean to make the cleaning crews do extra work just because you couldn’t be bothered to change out of your fishy boots.

When you leave your cabin, leave the door open

Leaving the door to your cabin open when you are not in it makes it a lot easier for the crew to get their work done. They won’t knock on your door when it’s closed because they are respecting your privacy and your sleep, but they want to empty your trash, put new towels in your cabin, clean, etc.. The larger you make the time window for them to do that by just leaving your cabin door open, the less they have to organize their work day around catering towards you.

Be quiet on corridors, people are sleeping

You are not the only one going on watches (and even worse — just because you don’t go on watch doesn’t mean that other people are not), so be considerate of other people’s sleep. While it sucks to be tired as a scientist on a ship, other people have safety-relevant work to do (and also just live on the ship for many weeks at a time) so they should definitely be able to get the sleep they need.

Also consider whether you really have to go to your own comfy cabin and your own comfy toilet during your watch if you know people are sleeping in the cabins next to yours. Cabin doors are loud, vacuum toilets are really loud, but walls between cabins are more like paper than like actual walls. If you can avoid making unnecessary noises that might wake up other people by just going to a common restroom, you should probably consider doing that.

Respect people’s privacy

There is not a lot of spaces where you can hide on a ship to get your alone time when you need it. So do not enter other people’s cabins unless invited, and don’t go knocking on their doors unless there is a good reason. People will leave their doors open if they are open to communications, if the doors are closed it means you should leave people alone unless you really have a good reason.

Also the cabins are the only private spaces people get. If you wouldn’t go into someone’s bedroom in their house without explicit permission, why would you do it on a ship?

No matter how funny it is: don’t invade people’s privacy by entering their private space without being invited unless you know them very well and know that they are fine with it!

Access to all areas?

Usually, you are free to go pretty much wherever you like on a research ship (except, as I said above, into other people’s private spaces). If areas are off limit (like for example the engine room or spaces where food is stored and prepared), you will be told that. But it’s still good practice to ask whether it’s ok to hang out. For example, in heavy weather or very tight straights, people on the bridge might prefer to not having you hanging around and possibly obstructing their work. And while they will tell you that, just asking whether it’s ok to be there makes it less awkward for everybody involved. Same if you visit other scientists in their labs, or the crew in the trawl mess — sometimes it might not be immediately obvious to you that people are concentrating on their work, even though they might look like they are just chilling, and that you are getting in the way of that. Or even just getting in the way of people chilling when they need to do that.

Be on time for handover between watches

Even if you are told that your watch runs from midnight to six in the morning and from noon to six in the evening, that doesn’t mean you show up at midnight and noon sharp. It means that the other watch wants to be able to leave at midnight and noon sharp, so handover should have happened before that time. It’s good practice to show up at least 5 minutes before watch changes.

Be on time for stations

People not being ready to start working when the ship is on station is a pet peeve of mine. Ship time is very expensive, so spending it on waiting for someone who wanted to get a hot chocolate right when the ship is ready to take measurements (instead of looking at the screen that shows you the navigation data of the ship, including ETAs of stations etc and getting it while there still is plenty of time) is a very bad use of taxpayers’ money.

Also be aware that there are a lot of people waiting for you once the ship is in position to start measuring: The officers on the bridge, the deck crew possibly standing outside in cold, windy, rainy weather, your other scientist colleagues. Not very good for the general mood if they unnecessarily have to wait for you.

It’s cold and in the middle of the night for the crew, too

Just because they might not let you see it doesn’t mean you are the only one that is tired and cold and feels cranky. I guess this goes back to rule no 3: Always be friendly and considerate of the people around you…

Radio communication is safety relevant

Having fun with a radio is fun, but there are a lot of people working on the bridge or the deck that have to listen to everything you say on the radio. So if you try to be overly funny, you might end up annoying people, and worse, making it more difficult for them to do their job and keep you safe.

Don’t discuss safety issues

If the crew tells you to wear a life vest on top of your floatation suite (that is certified as being sufficient in itself) when going on a small boat trip, or a helmet when taking water samples, just wear it. In the end they are the ones that know better, and they are the ones responsible for your safety so even if they are, in your opinion, unnecessarily cautious, they are just doing your job making sure you are safe. So even if it seems unnecessary to you, if they tell you to do something, just do it.

If plans change, let people know early on (and maybe explain why)

Changing your plans might require a lot of work on the crew‘s part — putting together different instrumentation, rearranging equipment on deck, changing out winches, all kinds of stuff that you might not be aware of. So if you happen to change your plans, let them know as soon as possible so it creates the least amount of stress for them.

Also offer to explain the scientific reasons why you now think the new plan is better than the old one. In my experience, in general the crew is really curious about what they are helping you achieve (and what you really could not achieve on your own if they weren’t there to help!), and really appreciate if you let them in on what you are doing for what purpose. And also what the outcomes are!

Don’t make a cruise longer than it has to be

Even though it might be fun for you to extend your cruise for a couple of extra hours just because it’s so nice to be at sea and you feel like you payed for that day of ship time anyway, don’t change arrival times back in port on a short notice without a really good reason. The crew might have made plans with their family and friends whom they don’t see very often, that they will have to cancel. This is going to make a lot of people not very happy!

And this goes without saying: Don’t extend a cruise just to get the extra pay you get for every day you spend at sea. While I find it hard to imagine people actually do that, I have heard from so many different crew that they think a lot of scientists do that, that it’s hard to ignore the possibility that it actually happens, and quite often at that.

Etiquette on a research ship: Your take?

What do you think? Do you agree with the “rules” I put up above? Are there any more things students should be told about? What do you wish you had known about life onboard a research ship before you first went to sea?

Edit to include Twitter wisdom on etiquette at sea (08.02.2019):

Edited to include a comment by Jenny Ullgren on March 15, 2019:

“The only thing I might have wanted to add is that: after offering to help, sometimes you have to accept that the most helpful thing you can do in a certain situation is to stay out of the way. This ties in with what you already wrote in the “access to all areas” section. An example: as much as we all agree that documentation is important, if your ‘only’ role in a sitation is to take photos, then there might be times when you have to step back for the people who have an even more direct, hands-on job to do right there and then.
Intuitive for most people, but maybe not always.”

How to use home-made surface drifters to teach oceanography

Very early knowledge about oceanography stems from beach finds that had to have been transported to that beach from far away because the finds themselves (pieces of trees, or coconuts, or whatever) were not native to their finding places so the ocean must have provided a connection between their place of origin and the beach they ended up on. And in early oceanographic research, messages in bottles or even wood pieces marked with identifying numbers were deployed at known times and regions and then recovered wherever they made landfall to get a better idea of ocean currents. And as oceanography got more and more sophisticated as a discipline, such lagrangian (i.e. current-following) data has become an important part of oceanographic research, especially over the last two decades with profiling ARGO floats.

Position of 3930 ARGO floats that were active in the 30 days before January 18th, 2019. Source: http://www.argo.ucsd.edu

ARGO data is available to anyone and, via its Google Earth interface, easily accessible in teaching. But of course this is only a passive resource, you cannot deploy drifters wherever you would like for teaching purposes. Now imagine if you had cheap drifters* available for use in teaching, how cool would that be?

Last year I was involved in discussing the design of home-made surface drifters and later got the chance to join the student cruise (as part of Lars Henrik and Harald‘s GEOF105 class at the University of Bergen, Norway) where the drifters were tested, both in their functions as drifters and as a teaching tool. They are an amazing addition to the student cruise and a great learning opportunity! But there are also a lot of challenges that arise when with working with drifters — or opportunities to think about interesting problems! What more could an instructor (or a student!) want? :-)

Building home-made surface drifters

While in our case the drifters were developed and built before the class started, discussing design criteria with students would be a really interesting task in an applied oceanography course. The design we ended up working with with is described here.

Building those relatively cheap drifters provided us with the opportunity to have students handle them to learn to use oceanographic instrumentation without them, or us, being too concerned about the welfare of the instrumentation. It also provided us with a fleet of four drifters that we could deploy and recover on four day-long student cruises and have them right in the vicinity of where we were taking Eulerian measurements at the same time, so we would end up with a complementing data set and could discuss the benefits of each of the two kinds of measurements and how, when they come together, they tell a much more interesting story than any of them could on their own.

Where to deploy the drifters

If you have a limited number of drifters available (four in our case), you have to think long and hard about where to deploy them. Of course you can just dump them into the water anywhere and see where they end up. But in order to figure out the best spot, it is really helpful to have a clear idea of what influences the currents in the regions you are interested in, and what path the drifters might take, depending on the location of their deployment.

On the three first days of the student cruise, we saw the drifters move against the predicted tidal current (“predicted” tidal currents, because we didn’t look at direct observations of the tidal current, so we don’t actually know if it is behaving the way the prediction predicted) and, at times, also against the main wind field. Nevertheless, we expect the wind to have a large influence on the flow in the surface layer, hence the day at sea starts with a briefing on the weather forecast.

Students presenting the weather forecast for the cruise day in the ship's messe

Students presenting the weather forecast for the cruise day in the ship’s messe

In addition to thinking about a deployment strategy for specific weather conditions, it is helpful to think about how trajectories from different days will be compared to each other. Therefore we chose to deploy on two sections over four days, thus repeating each section twice.

How to track your drifters

There are many ways to track drifters. In the early days, acoustic signals were used to know where drifters moved within an array of sound sources. These days, most tracking is done using GPS. In our case, we used readily available GPS tracking units that were then mounted on the drifters (see below).

GPS units being fixed to the drifters onboard RV Hans Brattstrøm

GPS units being fixed to the drifters onboard RV Hans Brattstrøm

Looking at the features of the GPS units we used, they were apparently mainly designed to tracking cars when you’ve lend them to your kids. In any case you can set alarms if velocities are too high, if they leave a pre-defined area, etc.. Interesting to see what kind of products are on the market!

Looking at how to track the drifter, i.e. the specifications of the GPS sender, might also be a very interesting exercises to do with students. How often should it “call home”, what battery lives are needed, how will the data be transferred, where and how can it be accessed, stored, processed?

How to deploy your drifters

Even when you know where to deploy the drifters, that doesn’t tell you how to deploy them. And even from a small research ship like the Hans Brattstrøm it is not immediately obvious how to do it.

Deploying a drifter

Very good reality check on how difficult it is to get instrumentation in place to measure oceanographic data!

How to interpret your data

Speaking of oceanographic data — how do you actually interpret it? Below you see a snapshot of our four drifters in action. This is actually on of the more interesting times when it comes to velocities: We do have two drifters moving with 4km/h and then one with less than 3km/h (which shows up as not moving because of some algorithm in the website). But what does this actually tell us?

Position and approximate velocities of our four drifters at the end of day 4

Interpreting drifter data becomes very difficult very quickly when you are in a flow field that changes over time. We did have the tidal forecast and the wind forecast, but both only in a coarse resolution in space and time and so it gets really difficult to imagine how they might have influenced the currents and thus the trajectories of the drifters!

How to protect your drifters from damage

Even in a fjord that is sheltered from the wind and big waves of the open ocean, the sea is still a harsh environment and large forces will act on the drifters. If we want to be able to recover the drifters in one piece, we have to make sure that they are actually sturdy enough to stay in one piece.

One of our drifters capsized for unknown reasons. Luckily Algot was still able to recover it!

Another point to consider is how much buoyancy a drifter will need to stay afloat, yet to be submerged enough into the water to actually follow the surface current rather than being pushed through the water by winds, or pushed over by the winds as the one above.

How to find your drifters again

As we think about how to protect the drifter from damage, we also need to think about how we can make sure the drifter stays upright so the GPS antenna stays above the water level. Even with fairly good visibility and low waves, and despite the brightly colored flags and radar reflectors on the drifters, they were pretty difficult to spot!

Even though we can see the drifter’s position through an app on my phone, it is really difficult to spot it out on the water!

How to recover your drifters

Even on a small vessel like the one we used for the student cruise, the water is actually pretty far away from where you can stand on the deck, so recovering a bulky and heavy item out of the sea is not as straight forward as one might think!

Technician Algot and a student recovering one of the surface drifters

Making sense of your drifters’ trajectories

This is not something I can cover in this post, of course — it’s what Inga will do for her Master’s thesis. Below, you see her plotting trajectories from the four days together with the predicted wind fields of the respective days.

, and think about how we can make sure the drifter stays upright so the GPS antenna stays above the water level.

Inga looking at analyses of the drifters’ trajectories which she will explain in her Master’s thesis

But there are several aspects I find especially interesting for discussions with students:

  • At which depth range did we place the anchor of the drifter, i.e. what “surface current” are we actually tracking, the real surface, or an average over the top 0.5 meters, or the top 1 meter? And what would “average” even mean? Or something else?
  • When we have Eulerian data from, say, tidal gauges, weather stations, etc, how do we bring those together with the Lagrangian data provided by the drifters?
  • Knowing what we know now, what could we learn for future deployment strategies?

There are so many super interesting questions to be discussed using this fairly inexpensive instrumentation that it is a great opportunity that should not be missed!

*of course, ARGO uses profiling floats that actively measure data and send them home, whereas we use surface drifters that only send their position and nothing else. But maybe we can mount data loggers on them next time? :-)

Why are they so much slower than I thought? Observing the group velocity vs phase velocity of waves

Have you ever seen a speedboat drive past, looked at its wake moving torwards you, then gotten distracted, and when you look back a little while later been surprised that the wake hasn’t moved as far towards you as you thought it would have during the time you looked away?

Well, I definitely have had that happen many times, and the other day I was sitting on the beach with a friend and we talked about why you initially perceive the waves moving a lot faster than they turn out to be moving in the end. While I didn’t film it then, I’ve been putting my time on the GEOF105 student cruise to good use to check out waves in addition to the cool research going on on the cruise, so now I have a movie showing a similar situation!

But let’s talk a little theory first.

Phase velocity

The phase velocity of a wave is the speed with which you see a wave crest moving.

Waves can be classified into long vs short waves, or deep- vs shallow water waves. But neither deep and shallow, nor long and short are absolute values: They refer to how long a wave is relative to the depth of the water in which it is moving. For short or deep water waves, the wavelength is short relative to the water depth (but can still be tens or even hundreds of meters long if the water is sufficiently deep!). For long or shallow water waves, the wave length is long compared to the water depth (for example Tsunamis are shallow water waves, even though the ocean is on average about 4 km deep).

For those long waves, or shallow water waves, the phase velocity is a function of the water depth, meaning that all shallow water waves all move at the same velocity.

However, what you typically see are deep water waves, and here things are a little more complicated. Since phase velocity depends on wave length, it is different for different waves. That means that there is interference between waves, even when they are travelling in the same direction. So what you end up seeing is the result of many different waves all mixed together.

If you watch the gif below (and if it isn’t moving just give it a little moment to fully load, it should then start), do you see how waves seem to be moving quite fast past the RV Harald Brattstrøm, but once you focus on individual wave crests, they seem to get lost, and the whole field moves more slowly than you initially thought?

That’s the effect caused by the interference of all those waves with slightly different wave lengths, and it’s called the group velocity.

Group velocity

The group velocity is the slower velocity with which you see a wave field propagate. It’s 1/2 of the phase velocity, and it is the velocity with which the signal of a wave field actually propagates. So even though you initially observed wave crests moving across the gif above fairly quickly, the signal of “wave field coming through!” only propagates with half the phase velocity.

Usually you learn about phase and group velocities in a theoretical way and are maybe shown some animations, but I thought it was pretty cool to be able to observe it “in situ!” :-)

At the end of the rainbow you’ll find … home-made surface drifters

For Lars Henrik and Harald‘s GEOF105 class we are deploying home-made surface drifters on the student cruise. Today I had the opportunity to join the cruise again, and since the weather today made for beautiful pictures, I just have to share them here.

First, at the end of every rainbow, as we all know, you’ll find … home-made surface drifters!

Inga and Algot getting the drifters ready for deployment

Inga and Algot getting the drifters ready for deployment

The research ship we are on is the Hans Brattstrøm — cosy ship with a super nice and helpful crew!

We are sailing on RV Hans Brattstrøm

We are sailing on RV Hans Brattstrøm

The drifters themselves are equipped with a sea anchor made from a plastic bucket and four paint roller trays underneath a buoy, and then on top all kinds of equipment to make sure nobody runs over it: A safety flag, a lamp, a radar reflector. And, of course, the GPS sender!

Isn't it cool how those wave rings radiate from our drifter?

Isn’t it cool how those wave rings radiate from our drifter?

What we are using those surface drifters for? To determine the circulation in the fjord right outside Bergen. There are several things that might have an influence: Tides, wind, freshwater runoff from the land… And a tilted sea surface (although it is probably not as tilted as in the picture below…)

Drifter in front of RV Hans Brattstrøm in front of mountains covered in clouds

Drifter in front of RV Hans Brattstrøm in front of mountains covered in clouds

Another amazing day “at sea”, thanks for having me along, Lars Henrik!

Drifter in front of RV Hans Brattstrøm

Drifter in front of RV Hans Brattstrøm