How to use home-made surface drifters to teach oceanography
Very early knowledge about oceanography stems from beach finds that had to have been transported to that beach from far away because the finds themselves (pieces of trees, or coconuts, or whatever) were not native to their finding places so the ocean must have provided a connection between their place of origin and the beach they ended up on. And in early oceanographic research, messages in bottles or even wood pieces marked with identifying numbers were deployed at known times and regions and then recovered wherever they made landfall to get a better idea of ocean currents. And as oceanography got more and more sophisticated as a discipline, such lagrangian (i.e. current-following) data has become an important part of oceanographic research, especially over the last two decades with profiling ARGO floats.
Position of 3930 ARGO floats that were active in the 30 days before January 18th, 2019. Source: http://www.argo.ucsd.edu
ARGO data is available to anyone and, via its Google Earth interface, easily accessible in teaching. But of course this is only a passive resource, you cannot deploy drifters wherever you would like for teaching purposes. Now imagine if you had cheap drifters* available for use in teaching, how cool would that be?
Last year I was involved in discussing the design of home-made surface drifters and later got the chance to join the student cruise (as part of Lars Henrik and Harald‘s GEOF105 class at the University of Bergen, Norway) where the drifters were tested, both in their functions as drifters and as a teaching tool. They are an amazing addition to the student cruise and a great learning opportunity! But there are also a lot of challenges that arise when with working with drifters — or opportunities to think about interesting problems! What more could an instructor (or a student!) want? :-)
Building home-made surface drifters
While in our case the drifters were developed and built before the class started, discussing design criteria with students would be a really interesting task in an applied oceanography course. The design we ended up working with with is described here.
Building those relatively cheap drifters provided us with the opportunity to have students handle them to learn to use oceanographic instrumentation without them, or us, being too concerned about the welfare of the instrumentation. It also provided us with a fleet of four drifters that we could deploy and recover on four day-long student cruises and have them right in the vicinity of where we were taking Eulerian measurements at the same time, so we would end up with a complementing data set and could discuss the benefits of each of the two kinds of measurements and how, when they come together, they tell a much more interesting story than any of them could on their own.
Where to deploy the drifters
If you have a limited number of drifters available (four in our case), you have to think long and hard about where to deploy them. Of course you can just dump them into the water anywhere and see where they end up. But in order to figure out the best spot, it is really helpful to have a clear idea of what influences the currents in the regions you are interested in, and what path the drifters might take, depending on the location of their deployment.
On the three first days of the student cruise, we saw the drifters move against the predicted tidal current (“predicted” tidal currents, because we didn’t look at direct observations of the tidal current, so we don’t actually know if it is behaving the way the prediction predicted) and, at times, also against the main wind field. Nevertheless, we expect the wind to have a large influence on the flow in the surface layer, hence the day at sea starts with a briefing on the weather forecast.
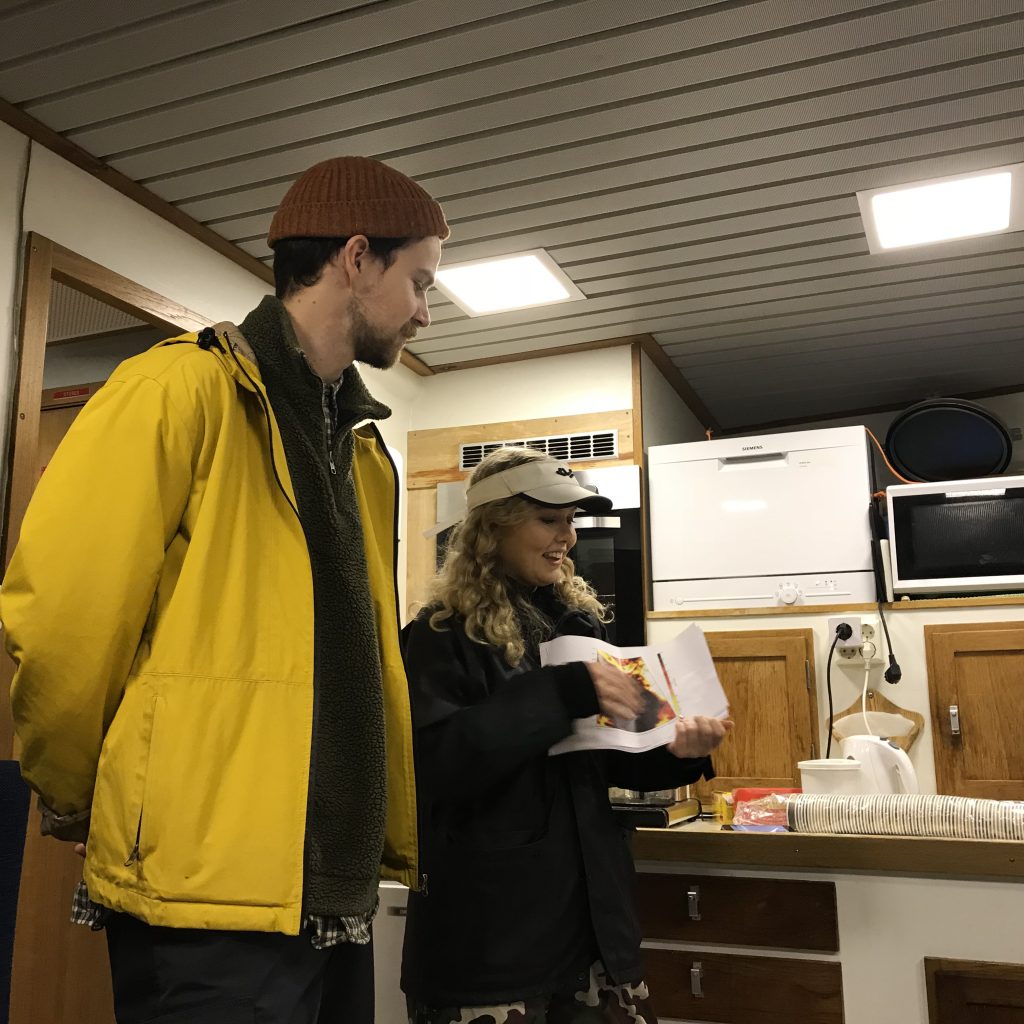
Students presenting the weather forecast for the cruise day in the ship’s messe
In addition to thinking about a deployment strategy for specific weather conditions, it is helpful to think about how trajectories from different days will be compared to each other. Therefore we chose to deploy on two sections over four days, thus repeating each section twice.
How to track your drifters
There are many ways to track drifters. In the early days, acoustic signals were used to know where drifters moved within an array of sound sources. These days, most tracking is done using GPS. In our case, we used readily available GPS tracking units that were then mounted on the drifters (see below).
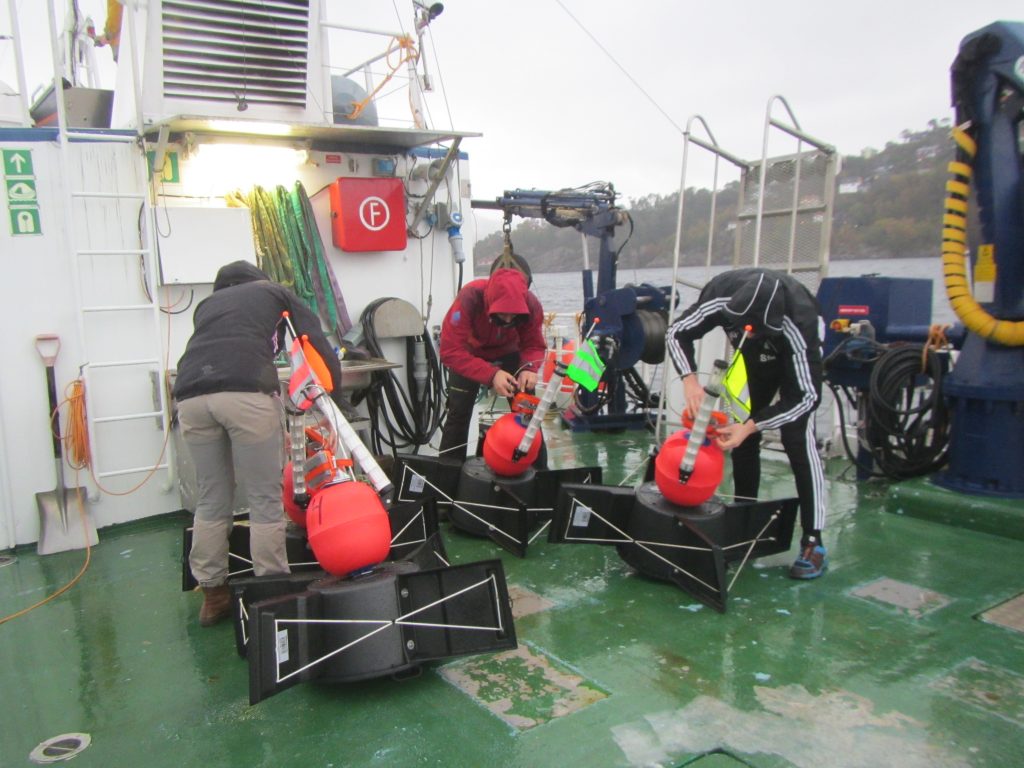
GPS units being fixed to the drifters onboard RV Hans Brattstrøm
Looking at the features of the GPS units we used, they were apparently mainly designed to tracking cars when you’ve lend them to your kids. In any case you can set alarms if velocities are too high, if they leave a pre-defined area, etc.. Interesting to see what kind of products are on the market!
Looking at how to track the drifter, i.e. the specifications of the GPS sender, might also be a very interesting exercises to do with students. How often should it “call home”, what battery lives are needed, how will the data be transferred, where and how can it be accessed, stored, processed?
How to deploy your drifters
Even when you know where to deploy the drifters, that doesn’t tell you how to deploy them. And even from a small research ship like the Hans Brattstrøm it is not immediately obvious how to do it.
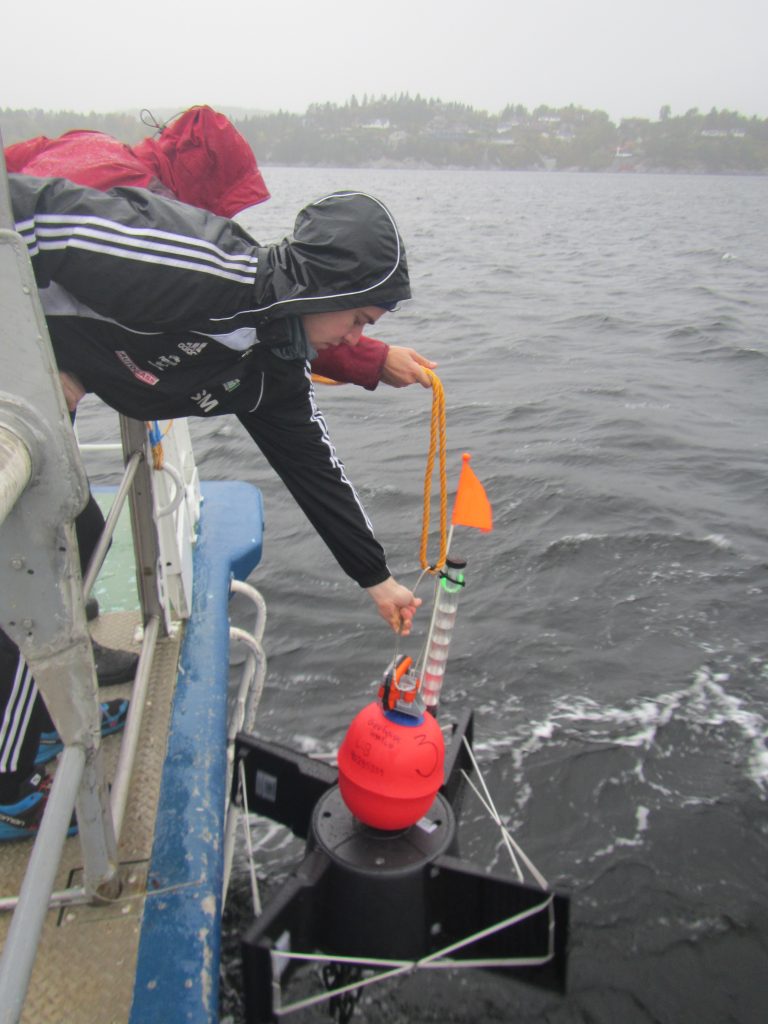
Deploying a drifter
Very good reality check on how difficult it is to get instrumentation in place to measure oceanographic data!
How to interpret your data
Speaking of oceanographic data — how do you actually interpret it? Below you see a snapshot of our four drifters in action. This is actually on of the more interesting times when it comes to velocities: We do have two drifters moving with 4km/h and then one with less than 3km/h (which shows up as not moving because of some algorithm in the website). But what does this actually tell us?

Position and approximate velocities of our four drifters at the end of day 4
Interpreting drifter data becomes very difficult very quickly when you are in a flow field that changes over time. We did have the tidal forecast and the wind forecast, but both only in a coarse resolution in space and time and so it gets really difficult to imagine how they might have influenced the currents and thus the trajectories of the drifters!
How to protect your drifters from damage
Even in a fjord that is sheltered from the wind and big waves of the open ocean, the sea is still a harsh environment and large forces will act on the drifters. If we want to be able to recover the drifters in one piece, we have to make sure that they are actually sturdy enough to stay in one piece.
One of our drifters capsized for unknown reasons. Luckily Algot was still able to recover it!
Another point to consider is how much buoyancy a drifter will need to stay afloat, yet to be submerged enough into the water to actually follow the surface current rather than being pushed through the water by winds, or pushed over by the winds as the one above.
How to find your drifters again
As we think about how to protect the drifter from damage, we also need to think about how we can make sure the drifter stays upright so the GPS antenna stays above the water level. Even with fairly good visibility and low waves, and despite the brightly colored flags and radar reflectors on the drifters, they were pretty difficult to spot!

Even though we can see the drifter’s position through an app on my phone, it is really difficult to spot it out on the water!
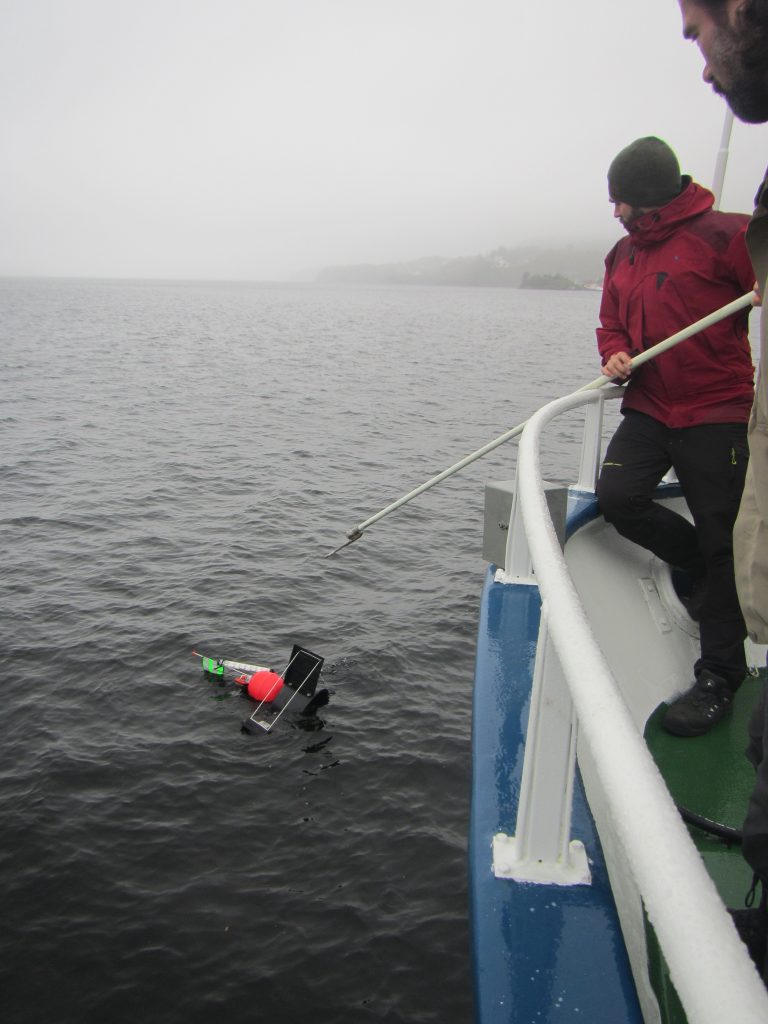
How to recover your drifters
Even on a small vessel like the one we used for the student cruise, the water is actually pretty far away from where you can stand on the deck, so recovering a bulky and heavy item out of the sea is not as straight forward as one might think!

Technician Algot and a student recovering one of the surface drifters
Making sense of your drifters’ trajectories
This is not something I can cover in this post, of course — it’s what Inga will do for her Master’s thesis. Below, you see her plotting trajectories from the four days together with the predicted wind fields of the respective days.

Inga looking at analyses of the drifters’ trajectories which she will explain in her Master’s thesis
But there are several aspects I find especially interesting for discussions with students:
- At which depth range did we place the anchor of the drifter, i.e. what “surface current” are we actually tracking, the real surface, or an average over the top 0.5 meters, or the top 1 meter? And what would “average” even mean? Or something else?
- When we have Eulerian data from, say, tidal gauges, weather stations, etc, how do we bring those together with the Lagrangian data provided by the drifters?
- Knowing what we know now, what could we learn for future deployment strategies?
There are so many super interesting questions to be discussed using this fairly inexpensive instrumentation that it is a great opportunity that should not be missed!
—
*of course, ARGO uses profiling floats that actively measure data and send them home, whereas we use surface drifters that only send their position and nothing else. But maybe we can mount data loggers on them next time? :-)
Creating a "time for telling" (Schwartz & Bransford, 1998) - Adventures in Oceanography and Teaching says:
[…] “weird” data. For example on student cruises in byfjorden in Bergen, we’ve been deploying homemade surface drifters for years, and by now have quite a nice dataset of how they move in a day. Interestingly enough, […]
Using #WaveWatching and #KitchenOceanography to prepare students for a one-day research cruise - Adventures in Oceanography and Teaching says:
[…] look at two typical teams on those student cruises: the “drifter” team that deploys surface drifters and interprets the trajectories later on, and the “CTD” team that takes profiles of […]