Using #WaveWatching and #KitchenOceanography to prepare students for a one-day research cruise
When students have only one day at sea, it’s important to prepare them well for what will happen there so they get the chance to make the most of the experience. For example, let’s consider a one day student cruises just outside of Bergen. Students are divided in teams that use different types of instrumentation and that investigate different questions. After the cruise, students use the data they acquired during the cruise to write a report on the data.
There are several different aspects that I would like to prepare the students for:
- Recognizing and understanding the relevant physical processes they are supposed to investigate
- Dealing with the data both onboard and once they get back home
Below, I’m expanding on my thoughts on how to do that.
Recognizing and understanding the relevant physical processes
Let’s look at two typical teams on those student cruises: the “drifter” team that deploys surface drifters and interprets the trajectories later on, and the “CTD” team that takes profiles of temperature, salinity and other properties of the water column and then interprets those afterwards.
Interpreting surface drifter data
In the area investigated during the student cruise, there are several processes that influence which way a passive surface drifter will take, e.g. tidal currents, wind-driven currents, the circulation induced by fresh land run-off, wave-induced drift. Also there might be effects of wind on the drifter (although when designing the drifters, care was taken to minimize the effect) or of other processes. The relative importance of those processes is not necessarily clear beforehand (or even when looking at the data), and it is most likely neither constant in time nor in space. So even though it seems like it should be simple enough, it’s not an easy task!
Additionally, even though students are theoretically familiar with some of the processes, their familiarity is mostly restricted to theoretical considerations of ideal cases, not with messy mixtures and real-life cases. So my suggestion would be to help them familiarize themselves with these processes, for example like this:
First: help them realize that there are many many many processes happening simultaneously
One way to do this is to provide a picture that shows many different things at once and ask students to annotate it with a certain number of processes they can spot. Knowing that there are at least four (or however many) processes to discover in the one picture they are given gives them confidence to name at least that many, or to keep looking until they’ve found that numer.
I usually use a different example, but since tomorrow is #CTDappreciationday and I’ve been looking at old CTD pics, I thought I’d give you a new one:
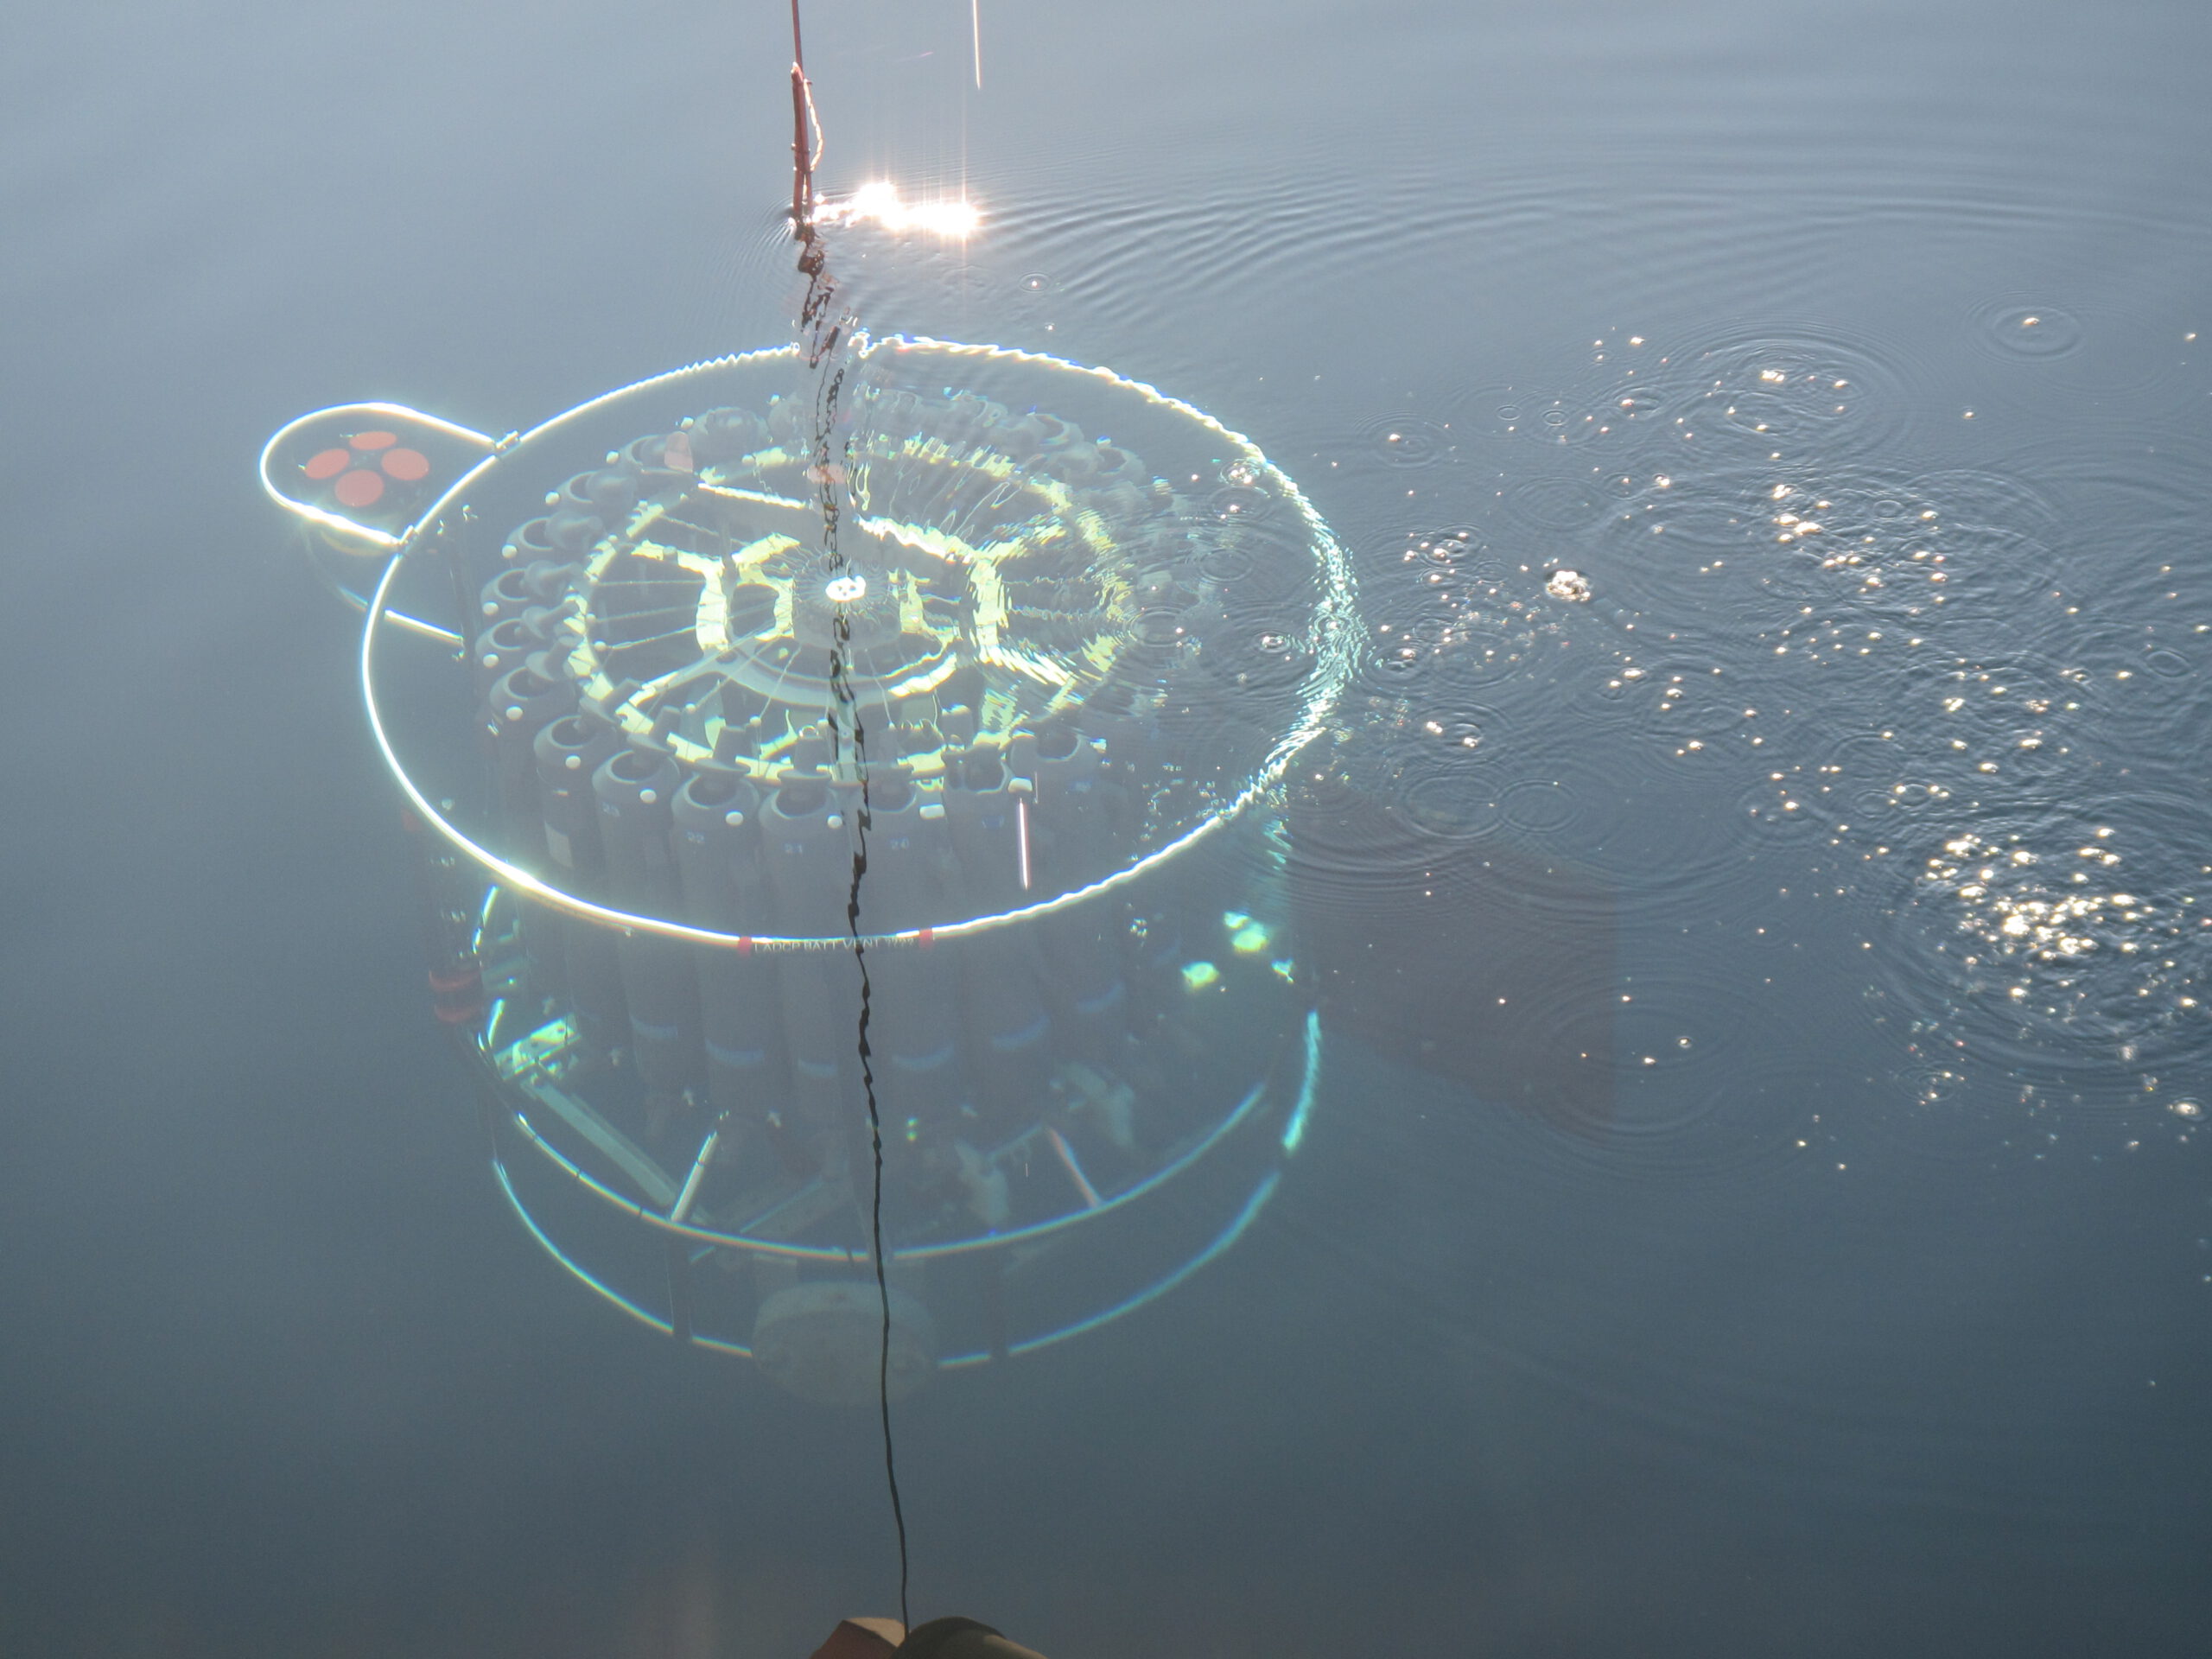
In this picture of a submerged CTD, we see any different processes, for example looking at waves: a wake-like wave where the CTD wire has been cutting through the water as the ship moves relative to the water, the splashes that happen when drops from the crane fall into the water and the little crowns they form, how the waves spread as rings from the points of impact, how different waves are supperposed and the interference pattern they form. Or ALL the optics of light going in and out of water: how shapes appear deformed, how colors change, … And many more!
Obviously it would be advisable to chose a picture that shows processes related to what the students are supposed to investigate.
Second: ask them to observe a given location and observe and describe as many different (or three, or five) situations as possible
This task is similar to the first one, but not having the reassurance that there are so-and-so many processes visible at the same time makes it a little more difficult. But it’s a great exercise to try and find as many different things going on in a system, because it will later help them to think of processes that might influence their observations.
For location ideas, check out the #BergenWaveWatching series over on Elin’s blog!
Third: ask them to go & discover a process “in real life”
Now that students have seen that life is messy and processes aren’t usually occuring in isolation, but are superimposed on or interacting with others, they are ready to go find a process in real life. To prepare students of the drifter group, useful tasks could be to find (and document) instances of
- a tidal current (and how do you know it’s a tidal current and not just a regular gravity-driven current like in a river? You might have to come back at a different time, or relate the current to tide tables)
- wave propagation and current direction not being aligned (since surface waves are a lot easier to observe than current direction, it’s easy to assume they are always in the same direction. They are not!)
- land run-off forming a buoyant (and possibly differently colored) plume in saltwater (or any other water forming a plume in a larger body of water, e.g. a storm drain going into a lake)
Even if students might not find the exact process you were hoping for, that’s ok! They will probably have an explanation for why their replacement is a good one, and that means that they put some thought into it, too.
Four: ask them to observe (some of) the relevant processes in real life and collect data
I find it a very useful exercise to try and collect data on a phenomenon without any proper equipment. For example, a tidal current can be related to the position of buoys within it, or the tidal elevations can be estimated by repeatedly taking pictures of the same pylon of a bridge. And then, of course, plot the data and discuss it!
It might seem like busywork, but I would argue that it really helps practicing observational skills. And they are going to appreciate instrumentation so much more once they get to work with it later on! :-)
Five: relate it to what to expect at sea
This is the really difficult part. From their short cruise, students will come back with a data file full of numbers, i.e. the positions at the drifter at a given time. How does that relate to what they’ve been observing until now?
Well, the idea is for them to come back with so much more than just the one data file with drifter positions. Ideally, since they know how messy the system is they are about to interpret, they’ll come back with data on the wind field (either from what the atmosphere group measured, or from the regional weather forecast), with data on the tides (from tidal gauges in the area, or models), with observations of wave height to calculate Stokes drift, with observations of anything unusual (like once when one of our drifters got caught by a ship and displaced). Ideally, all the practices we did beforehand prepared them to realize that they will want to have all this data, even if only to exclude the influence of one or several of those factors.
Ok, so much for our drifter group. Now on to the CTD group!
Interpreting temperature & salinity profiles
Temperature and salinity profiles have arguably been the most important type of oceanic data in the history of oceanography. They are also not something that is easy to come by, because you typically need a ship and some instrumentation to measure them. But there are still ways to help students familiarize themselves with the idea of temperature and salinity profiles in a practical way before their cruise.
First: help them realize that there are many many many processes happening simultaneously
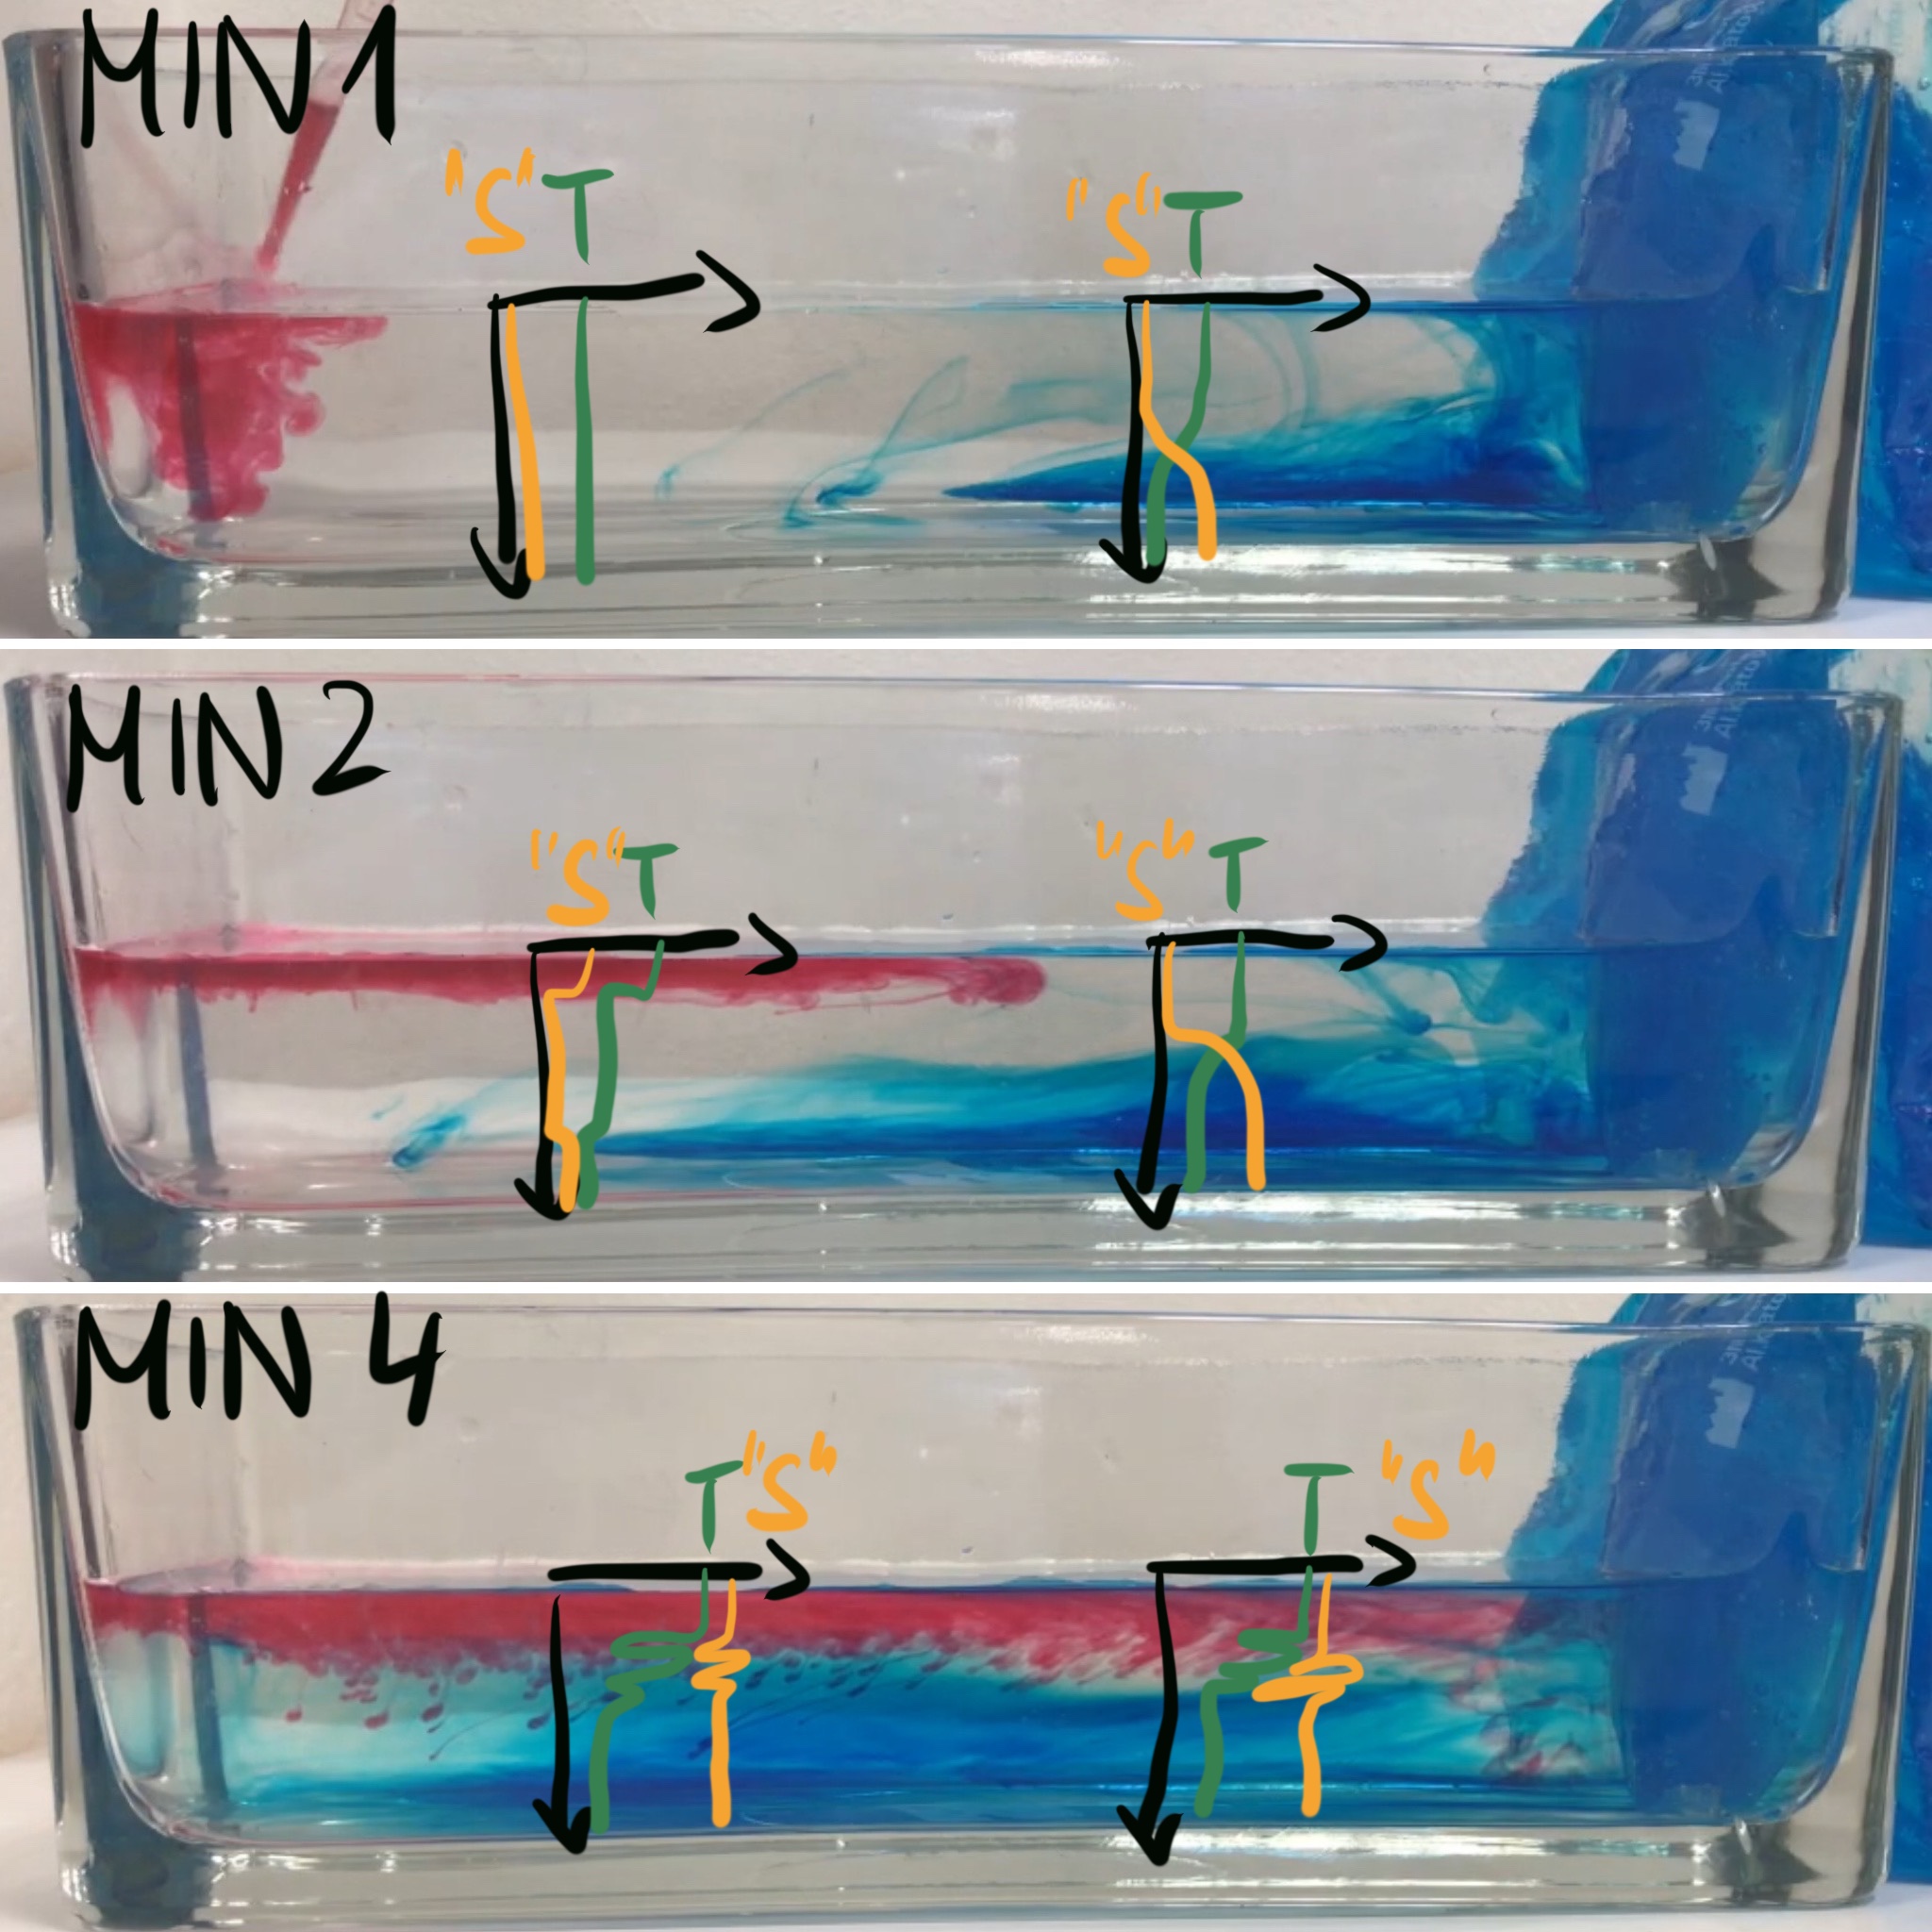
Temperature and salinity profiles are really difficult to interprete because there are SO MANY things influencing them! A really good way to realize that is by asking students to do a simple overturning experiment and draw profiles over time in fixed location.
In the very simple overurning experiment, T and S profiles could look something like what’s sketched in above. The red dye is heated (in order to make it buoyant enough to stay on top and mark the surface flow). I’m writing “S” in quotation marks, because I’m lumping both red and blue dye together as “something dissolved in water”, which I abbreviate as “salinity” for this purpose… And of course, all the overshoots in S don’t make sense, as I realized when I couldn’t be bothered any more to draw it again… But a good point to discuss, maybe? :-D
Here we see that it’s not just the cooling driving a circulation, we also see salt fingering occurring as the red dye cools and thus becomes denser than the clear water at the same temperature. So even in such a simple experiment there are different processes happening at the same time!
Second: ask them to observe a given location and observe and describe as many different (or three, or five) situations as possible
Same as I suggested for the “drifter” group, possibly with a focus on processes that influence temperature and salinity (river runoff, rain, evaporation, mixing by surface waves, parts of the body of water that are in the sun vs shade). The point is not necessarily to find the most relevant process, but to recognize which processes might potentially have an influence (even if minuscule) and thus make interpretation of observations more difficult later on.
Three to five
The temperature and salinity profiles are influenced by similar processes as I described for the drifter group, because they are shaped by advection of water with different properties and from different directions. So trying to observe the processes described above makes a lot of sense here, too! As do the other steps I described above.
But now how do we prepare students to cope with the data once they are back from their cruise?
Dealing with the data
Students are provided with finished programs that read in and plot the data, that they only need to modify if they want to show things in a different way. Yet it’s surprisingly difficult for them to manage that when they come back from the cruise.
There are several aspects to dealing with data that we can help students prepare for:
- getting data into the program you want to work with, and making plots
- interpreting plots
- interpreting data
Of course, all of this could be done just by using last year’s data (and actually maybe it’s not such a bad idea to ask students to re-run someone else’s analysis, because then they KNOW it worked a year ago, so unless they changed something, it should be working again now). After reproducing last year’s figures, students could read last year’s interpretations of those figures and discuss whether they agree with them or what they would do differently (obviously this works best if last year’s interpretations are somewhat helpful).
BUT it could also be done using new data that the students generate themselves as part of their observations earlier. For example for the temperature and salinity profiles in the easy overturning experiment, they could use some depth axis and assign numbers to the profiles that qualitatively represent the shape they drew earlier (or, if you wanted to get fancy, you could probably use temperature probes in the tank and get actual numbers). The idea here is not to get data that is as complex as they would get on the cruise, but to get a data file that is similarly structured to the ones they are expecting to get, to read it in, to plot it, and maybe practice to modify axes etc..
What do you think? Any suggestions, comments, feedback?
Pembuatan Akun Binance says:
Thanks for sharing. I read many of your blog posts, cool, your blog is very good.