Tag Archives: Bergen

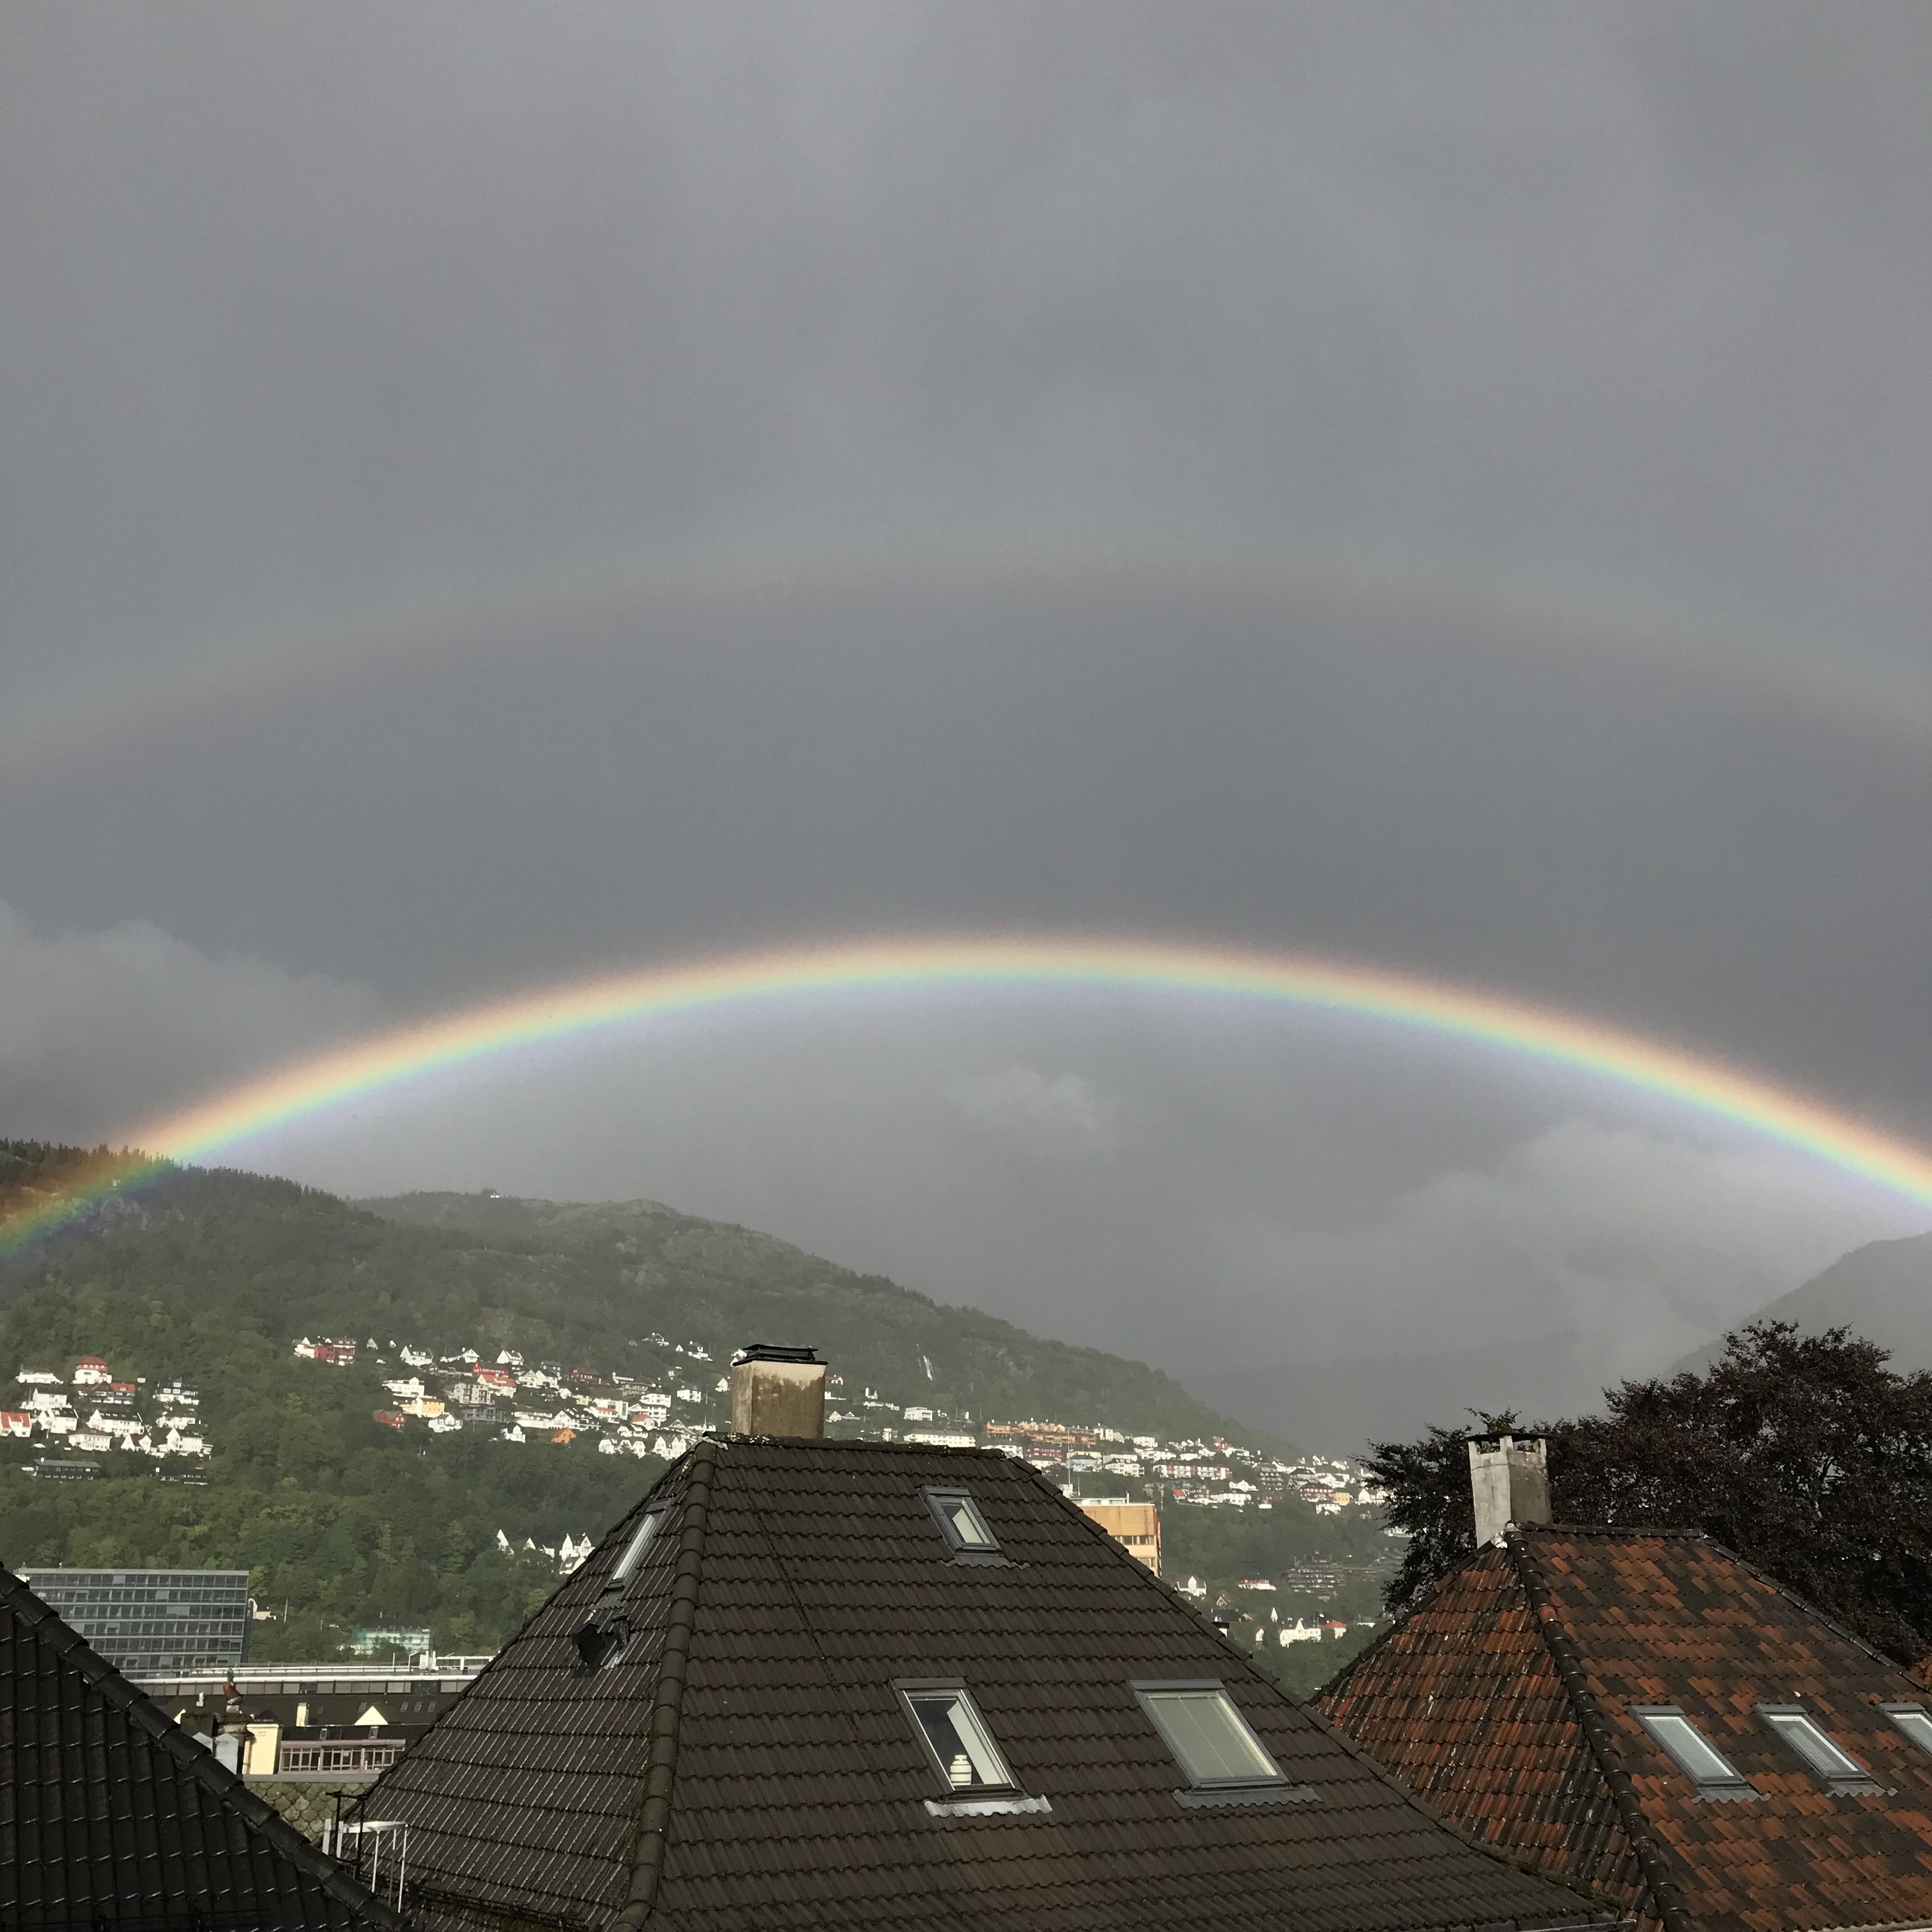
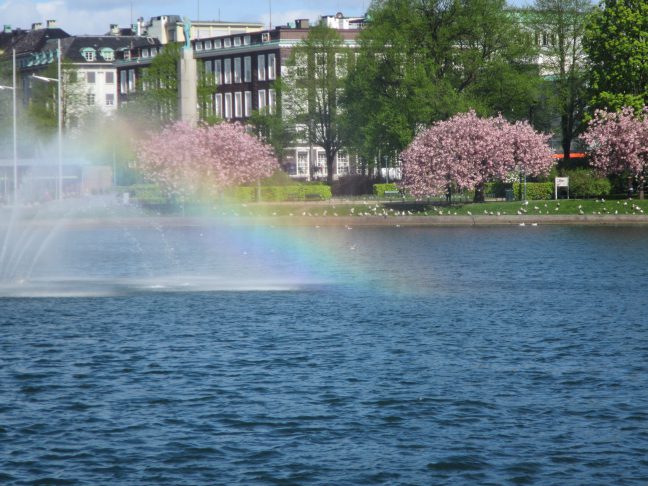
#BergenWaveWatching: Rainbows!

Reposting from Elin’s blog here!

Kjersti, Steffi, Elin and myself (Mirjam) recently discussed ways to better integrate the GEOF105 student cruise into the course. My suggestion was to ask the students to observe things throughout the whole duration of the course, and then have them relate their time series with what they observe when “at sea”. In this mini series tagged #BergenWaveWatching, I write up a couple of suggestions I have for observations that are easy and fun to make. I am anticipating that my suggestions will be strongly biased towards #wavewatching, so if you have any other suggestions, I am all ears! :-)

Neither wave watching nor particularly Bergen-specific, but still super cool! And probably as close as I will ever come to suggesting any kind of meteorological observation. Clouds are pretty amazing, too, but I really don’t know enough about those…

Where to go

Nowhere specific, just keep an eye out for situations in which there are water droplets in the air and the sun is low enough in the sky for rainbows to appear. Be aware of where rainbows would appear if they were visible (the shadow of your head would be in the center of the rainbow) and check out if they are there.

It doesn’t actually have to rain for rainbows to appear…

When to go

Since the sun needs to be sufficiently low in the sky for rainbows to be above the ground, rainbows are more likely to appear in the morning and afternoon.

What to look out for

Duh. Rainbows?

What to do with the data

I think it could be fun to try and relate the appearance of rainbows to the kind of weather. Obviously, you need both sun and rain. But for double rainbows, you need several rain fronts behind each other. And for a secondary rainbow as in the picture on the very top (blog post on that here), you need strong sunshine.

The observations suggested here are also well suited for a description of the phenomenon and an explanation of the physics behind it.

How this is relevant for the student cruise

Not directly, but I think getting into the habit of observing something fairly specific and, over time, becoming an expert on spotting and explaining rainbows, is pretty awesome!

Do you have suggestions for us? What other spots or topics would you recommend in and around Bergen to be added to the #BergenWaveWatching list? Please leave a comment! We are always looking to expand this list!

Lille Lungegårdsvannet

The geometric shape of Lille Lungegårdsvannet makes for perfect wave watching conditions. Not only when wanting to look at waves from all sides, but also when you are just fascinated by reflections and geometric wave pattern.

And also by rainbows. Am I the only one who, when the sun is out and at a good angle, walks around Lille Lungegårdsvannet to see the rainbow that you know must be there?

Fløyen in the clouds

Yesterday, I went for a quick walk up Fløyen and really enjoyed it, despite the view being slightly different from what is usually shown on the postcards.

Nice, some wake watching!

I like walking through a forest and then occasionally getting glimpses of the city and the fjord!

Although the glimpses became less and less clear the higher up I went.

Up top there wasn’t much of a view left.

But I like the almost mystical mood in the fog and clouds!

And I like how in Bergen, there is wave watching at all kinds of different heights. Like here on the fire water pond as well as the wake of that incoming ferry in Vågen.

Or in my favourite puddle!

Bergen harbour wave watching

Oh look, someone built a perfect rectangular wave watching basin into Bergen harbour!

As you see above, waves are propagating towards this little wave tank and into it. They then get reflected at the edge at the bottom of the picture. Then, the original incoming wave and reflection propagate together further into the basin. They are now forming V-shaped wave.

This leads to this really cool interference pattern in the basin: Lots of seemingly disconnected little hills and valleys in a checkerboard pattern.

It looks even cooler when moving! Because it’s so difficult to track individual wave crests and the hills and valleys seem to just be appearing and disappearing randomly:

Some Bergen pics because this city is so pretty

Since it’s raining today (finally! I can’t be distracted by good weather all the time!) it’s time to post some Bergen pics! And yes, Kristin, they are all water-related. Sorry not sorry!

I don’t know how many of these I’ve taken over the years, but I still like this view!

And apparently I am really into reflections in puddles right now.

Next day with more sun shine! It really looks like fall already, doesn’t it?

Gotta love the low clouds (at least if cloud cover isn’t more than in this picture ;-))

And gotta love the port.

Somehow the water on these chairs was really fascinating to me.

Ha. When I vacated my seat here, some tourists were very happy to take it over from me.

Clearly they hadn’t seen what I saw, or they didn’t realize how quickly that rain front would move in… :-D

Roll waves in Bergen

They might not look like much, but when I spotted these in the street this morning, I was super excited: Roll waves!

I marked some of them below (just to make sure you see what I saw and not just a wet street) — lots of little groups of waves that fan out and propagate down the street in a fairly regular pattern, which is controlled by the amount of water going down, the slope of the street, and friction.

In the movie below we first look upstream and see a very regular pattern, and then downstream when it is raining a little more than shortly before, and there we see that sometimes one of the wave groups is a little larger and a little faster and eats up the one before.

How cool is that?

And here is an analogy of what happens: Everything is moving the way it should, until suddenly something moves faster and brings with it everything in front of it.

(Also, isn’t it funny what continued wave watching does to your brain? I cannot go anywhere without seeing waves these days…)

Visiting my friend’s office for some #wavewatching

Since we seem to be on the topic of wake watching these days, here are some pictures I took when visiting my friend Liz at the European Cruise Service’s offices in Bergen the other day. She had already told me about the awesome wave watching to be done from their meeting room, but see for yourself!

Above, you see a very nice example of the turbulent wake of that cruise ship substantially modifying the wave field even after the ship is gone (or, in this case, after the ship has turned to leave in the other direction. Doesn’t this whole picture look very Titanic? Or is that just me?). What is going on there is that the turbulence introduced in the water by the ship and its propellers moving a lot of water around sticks around for quite some time. While the water is still moving due to the turbulence, “normal” surface waves can’t propagate in the turbulent area. The water’s surface thus looks very smooth there, a lot less rough than in areas where there are wind waves. And the smooth areas reflect light similarly to a mirror, whereas the rough areas’ light reflections seem to resemble maybe a disco ball?

Below, you see both parts of a wake quite well: The turbulent wake right behind that ferry (which will show up all smooth from a distance), and then the feathery V wake (with the ferry at its tip) that spreads on either side of the turbulent wake.

And you see some more old turbulent wakes in the picture above, for example one that the ferry in the foreground is following closely (see how it stretches out before the ferry?) and one that turns left to go towards the invisible Askøy bridge (you can still make out the ferry where the wake begins).

Do you see the potential of this wave watching spot? I definitely have to come back!

Even if you are not into wave watching, it’s a super interesting place to visit because it gives quite an interesting look on the city, even with Ulriken being disguised by the low clouds that day…

Would you be interested in a wave watching tour when you visit Bergen (or Kiel, or any other place)? If so give me a shout, we might be able to arrange something ;-)

Long-distance wave watching during sunset

Have you ever noticed how much you can observe when you look at water from a distance? For example in these pictures, you see the tracks of ships that are long out of sight! Do you see the circle that one obviously drove before leaving our field of view?

For the ships far out in the fjord, you can’t actually see the waves so much as the turbulence they created that left the surface smoother, thus better reflecting the light from the low sun (and appearing yellow-ish). And how cool how you see how newer tracks run over older ones! Only for the ferry in the bottom left you can actually see the waves themselves.

In the picture below we actually see the waves that both ferries made.

Zooming in: How cool does it look to have these waves almost all the way across the water? And do you see how they are bound by the ship’s V-shaped, feathery wake? I find it really fascinating that there are such large surface elevations, but only inside of the ship’s wake.

I just love wave watching, even when I am not even that close to the water :-)

Fascinating how the same body of water can show up in so many different colors at once!

Stupid as it sounds, one of my favourite wave watching spots in Bergen is a busy bridge with a view onto another busy bridge. But the bridge goes across a very narrow opening which connects Storelungegårdsvannet, which you see in the pictures, with a fjord and ultimately the open ocean. As the opening is a lot narrower than both the fjord and the lake at the fjord’s head, there are pretty much always strong tidal currents going one way or the other, sometimes leading to a substantial difference in sea surface height on either side of the bridge. I found that quite scary the first couple of times I had to paddle through!

But what I found most fascinating today is how many different colors you see on the water, and how they are all explained by different physical processes.

If we look at the bottom end of the picture above, we see that we can look fairly well into the water and see the sandy/rocky bottom with some algae growing on it. You can look into the water so well because several things came together at the time when I took the picture:

  • There weren’t a lot of waves to disrupt the view
  • I’m looking into the water at quite a steep angle, so even though the light going in and out of the water is refracted at the interface, the angle is too steep for total reflection to happen
  • This lower area of the image is reflecting the dark underside of the bridge rather than the bright sky, making it easier to see the muted colors in the water because there isn’t too much interference with bright colors from elsewhere

Moving on a little up in the picture above: Here we see the reflection of the sky (see the clouds reaching down the slopes of the mountain? (If you don’t see what I mean, check out the image at the top of this post where you can see it both reflected and “for real”)

We see the reflection here because the angle is a lot shallower and we don’t have the bridge’s shade making it possible to look inside.

Notice how the bridge’s reflection doesn’t have a sharp edge but shows up all the turbulence in the water? You can also notice more turbulence on the right side slightly above the middle of the image.

And then there is this grey stripe going all across the reflection of the mountain and houses. That’s where a little breeze is going over the surface, creating ripples. Since the surface is rougher now, we get a lot of bright sky reflected towards us.

Below another image, where you see both sides of the bridge’s reflection. Isn’t it fascinating how turbulence is distorting the reflection? And there is a lot more turbulence on the left than on the right at the bottom end of the bridge’s reflection, where you can still make out the railing of the bridge in the reflection…

In the uppermost image, you also see that it becomes more and more difficult to see the bottom as water depth increases – the water seems to be getting greener and greener, darker and darker.

What else did you spot that I didn’t mention? And do you think you’ll look at Storelungeren the same way as before next time you cross that bridge? ;-)

How to use home-made surface drifters to teach oceanography

Very early knowledge about oceanography stems from beach finds that had to have been transported to that beach from far away because the finds themselves (pieces of trees, or coconuts, or whatever) were not native to their finding places so the ocean must have provided a connection between their place of origin and the beach they ended up on. And in early oceanographic research, messages in bottles or even wood pieces marked with identifying numbers were deployed at known times and regions and then recovered wherever they made landfall to get a better idea of ocean currents. And as oceanography got more and more sophisticated as a discipline, such lagrangian (i.e. current-following) data has become an important part of oceanographic research, especially over the last two decades with profiling ARGO floats.

Position of 3930 ARGO floats that were active in the 30 days before January 18th, 2019. Source: http://www.argo.ucsd.edu

ARGO data is available to anyone and, via its Google Earth interface, easily accessible in teaching. But of course this is only a passive resource, you cannot deploy drifters wherever you would like for teaching purposes. Now imagine if you had cheap drifters* available for use in teaching, how cool would that be?

Last year I was involved in discussing the design of home-made surface drifters and later got the chance to join the student cruise (as part of Lars Henrik and Harald‘s GEOF105 class at the University of Bergen, Norway) where the drifters were tested, both in their functions as drifters and as a teaching tool. They are an amazing addition to the student cruise and a great learning opportunity! But there are also a lot of challenges that arise when with working with drifters — or opportunities to think about interesting problems! What more could an instructor (or a student!) want? :-)

Building home-made surface drifters

While in our case the drifters were developed and built before the class started, discussing design criteria with students would be a really interesting task in an applied oceanography course. The design we ended up working with with is described here.

Building those relatively cheap drifters provided us with the opportunity to have students handle them to learn to use oceanographic instrumentation without them, or us, being too concerned about the welfare of the instrumentation. It also provided us with a fleet of four drifters that we could deploy and recover on four day-long student cruises and have them right in the vicinity of where we were taking Eulerian measurements at the same time, so we would end up with a complementing data set and could discuss the benefits of each of the two kinds of measurements and how, when they come together, they tell a much more interesting story than any of them could on their own.

Where to deploy the drifters

If you have a limited number of drifters available (four in our case), you have to think long and hard about where to deploy them. Of course you can just dump them into the water anywhere and see where they end up. But in order to figure out the best spot, it is really helpful to have a clear idea of what influences the currents in the regions you are interested in, and what path the drifters might take, depending on the location of their deployment.

On the three first days of the student cruise, we saw the drifters move against the predicted tidal current (“predicted” tidal currents, because we didn’t look at direct observations of the tidal current, so we don’t actually know if it is behaving the way the prediction predicted) and, at times, also against the main wind field. Nevertheless, we expect the wind to have a large influence on the flow in the surface layer, hence the day at sea starts with a briefing on the weather forecast.

Students presenting the weather forecast for the cruise day in the ship's messe

Students presenting the weather forecast for the cruise day in the ship’s messe

In addition to thinking about a deployment strategy for specific weather conditions, it is helpful to think about how trajectories from different days will be compared to each other. Therefore we chose to deploy on two sections over four days, thus repeating each section twice.

How to track your drifters

There are many ways to track drifters. In the early days, acoustic signals were used to know where drifters moved within an array of sound sources. These days, most tracking is done using GPS. In our case, we used readily available GPS tracking units that were then mounted on the drifters (see below).

GPS units being fixed to the drifters onboard RV Hans Brattstrøm

GPS units being fixed to the drifters onboard RV Hans Brattstrøm

Looking at the features of the GPS units we used, they were apparently mainly designed to tracking cars when you’ve lend them to your kids. In any case you can set alarms if velocities are too high, if they leave a pre-defined area, etc.. Interesting to see what kind of products are on the market!

Looking at how to track the drifter, i.e. the specifications of the GPS sender, might also be a very interesting exercises to do with students. How often should it “call home”, what battery lives are needed, how will the data be transferred, where and how can it be accessed, stored, processed?

How to deploy your drifters

Even when you know where to deploy the drifters, that doesn’t tell you how to deploy them. And even from a small research ship like the Hans Brattstrøm it is not immediately obvious how to do it.

Deploying a drifter

Very good reality check on how difficult it is to get instrumentation in place to measure oceanographic data!

How to interpret your data

Speaking of oceanographic data — how do you actually interpret it? Below you see a snapshot of our four drifters in action. This is actually on of the more interesting times when it comes to velocities: We do have two drifters moving with 4km/h and then one with less than 3km/h (which shows up as not moving because of some algorithm in the website). But what does this actually tell us?

Position and approximate velocities of our four drifters at the end of day 4

Interpreting drifter data becomes very difficult very quickly when you are in a flow field that changes over time. We did have the tidal forecast and the wind forecast, but both only in a coarse resolution in space and time and so it gets really difficult to imagine how they might have influenced the currents and thus the trajectories of the drifters!

How to protect your drifters from damage

Even in a fjord that is sheltered from the wind and big waves of the open ocean, the sea is still a harsh environment and large forces will act on the drifters. If we want to be able to recover the drifters in one piece, we have to make sure that they are actually sturdy enough to stay in one piece.

One of our drifters capsized for unknown reasons. Luckily Algot was still able to recover it!

Another point to consider is how much buoyancy a drifter will need to stay afloat, yet to be submerged enough into the water to actually follow the surface current rather than being pushed through the water by winds, or pushed over by the winds as the one above.

How to find your drifters again

As we think about how to protect the drifter from damage, we also need to think about how we can make sure the drifter stays upright so the GPS antenna stays above the water level. Even with fairly good visibility and low waves, and despite the brightly colored flags and radar reflectors on the drifters, they were pretty difficult to spot!

Even though we can see the drifter’s position through an app on my phone, it is really difficult to spot it out on the water!

How to recover your drifters

Even on a small vessel like the one we used for the student cruise, the water is actually pretty far away from where you can stand on the deck, so recovering a bulky and heavy item out of the sea is not as straight forward as one might think!

Technician Algot and a student recovering one of the surface drifters

Making sense of your drifters’ trajectories

This is not something I can cover in this post, of course — it’s what Inga will do for her Master’s thesis. Below, you see her plotting trajectories from the four days together with the predicted wind fields of the respective days.

, and think about how we can make sure the drifter stays upright so the GPS antenna stays above the water level.

Inga looking at analyses of the drifters’ trajectories which she will explain in her Master’s thesis

But there are several aspects I find especially interesting for discussions with students:

  • At which depth range did we place the anchor of the drifter, i.e. what “surface current” are we actually tracking, the real surface, or an average over the top 0.5 meters, or the top 1 meter? And what would “average” even mean? Or something else?
  • When we have Eulerian data from, say, tidal gauges, weather stations, etc, how do we bring those together with the Lagrangian data provided by the drifters?
  • Knowing what we know now, what could we learn for future deployment strategies?

There are so many super interesting questions to be discussed using this fairly inexpensive instrumentation that it is a great opportunity that should not be missed!

*of course, ARGO uses profiling floats that actively measure data and send them home, whereas we use surface drifters that only send their position and nothing else. But maybe we can mount data loggers on them next time? :-)