Tag Archives: CTD

Meeting Ran, the Autonomous Underwater Vehicle

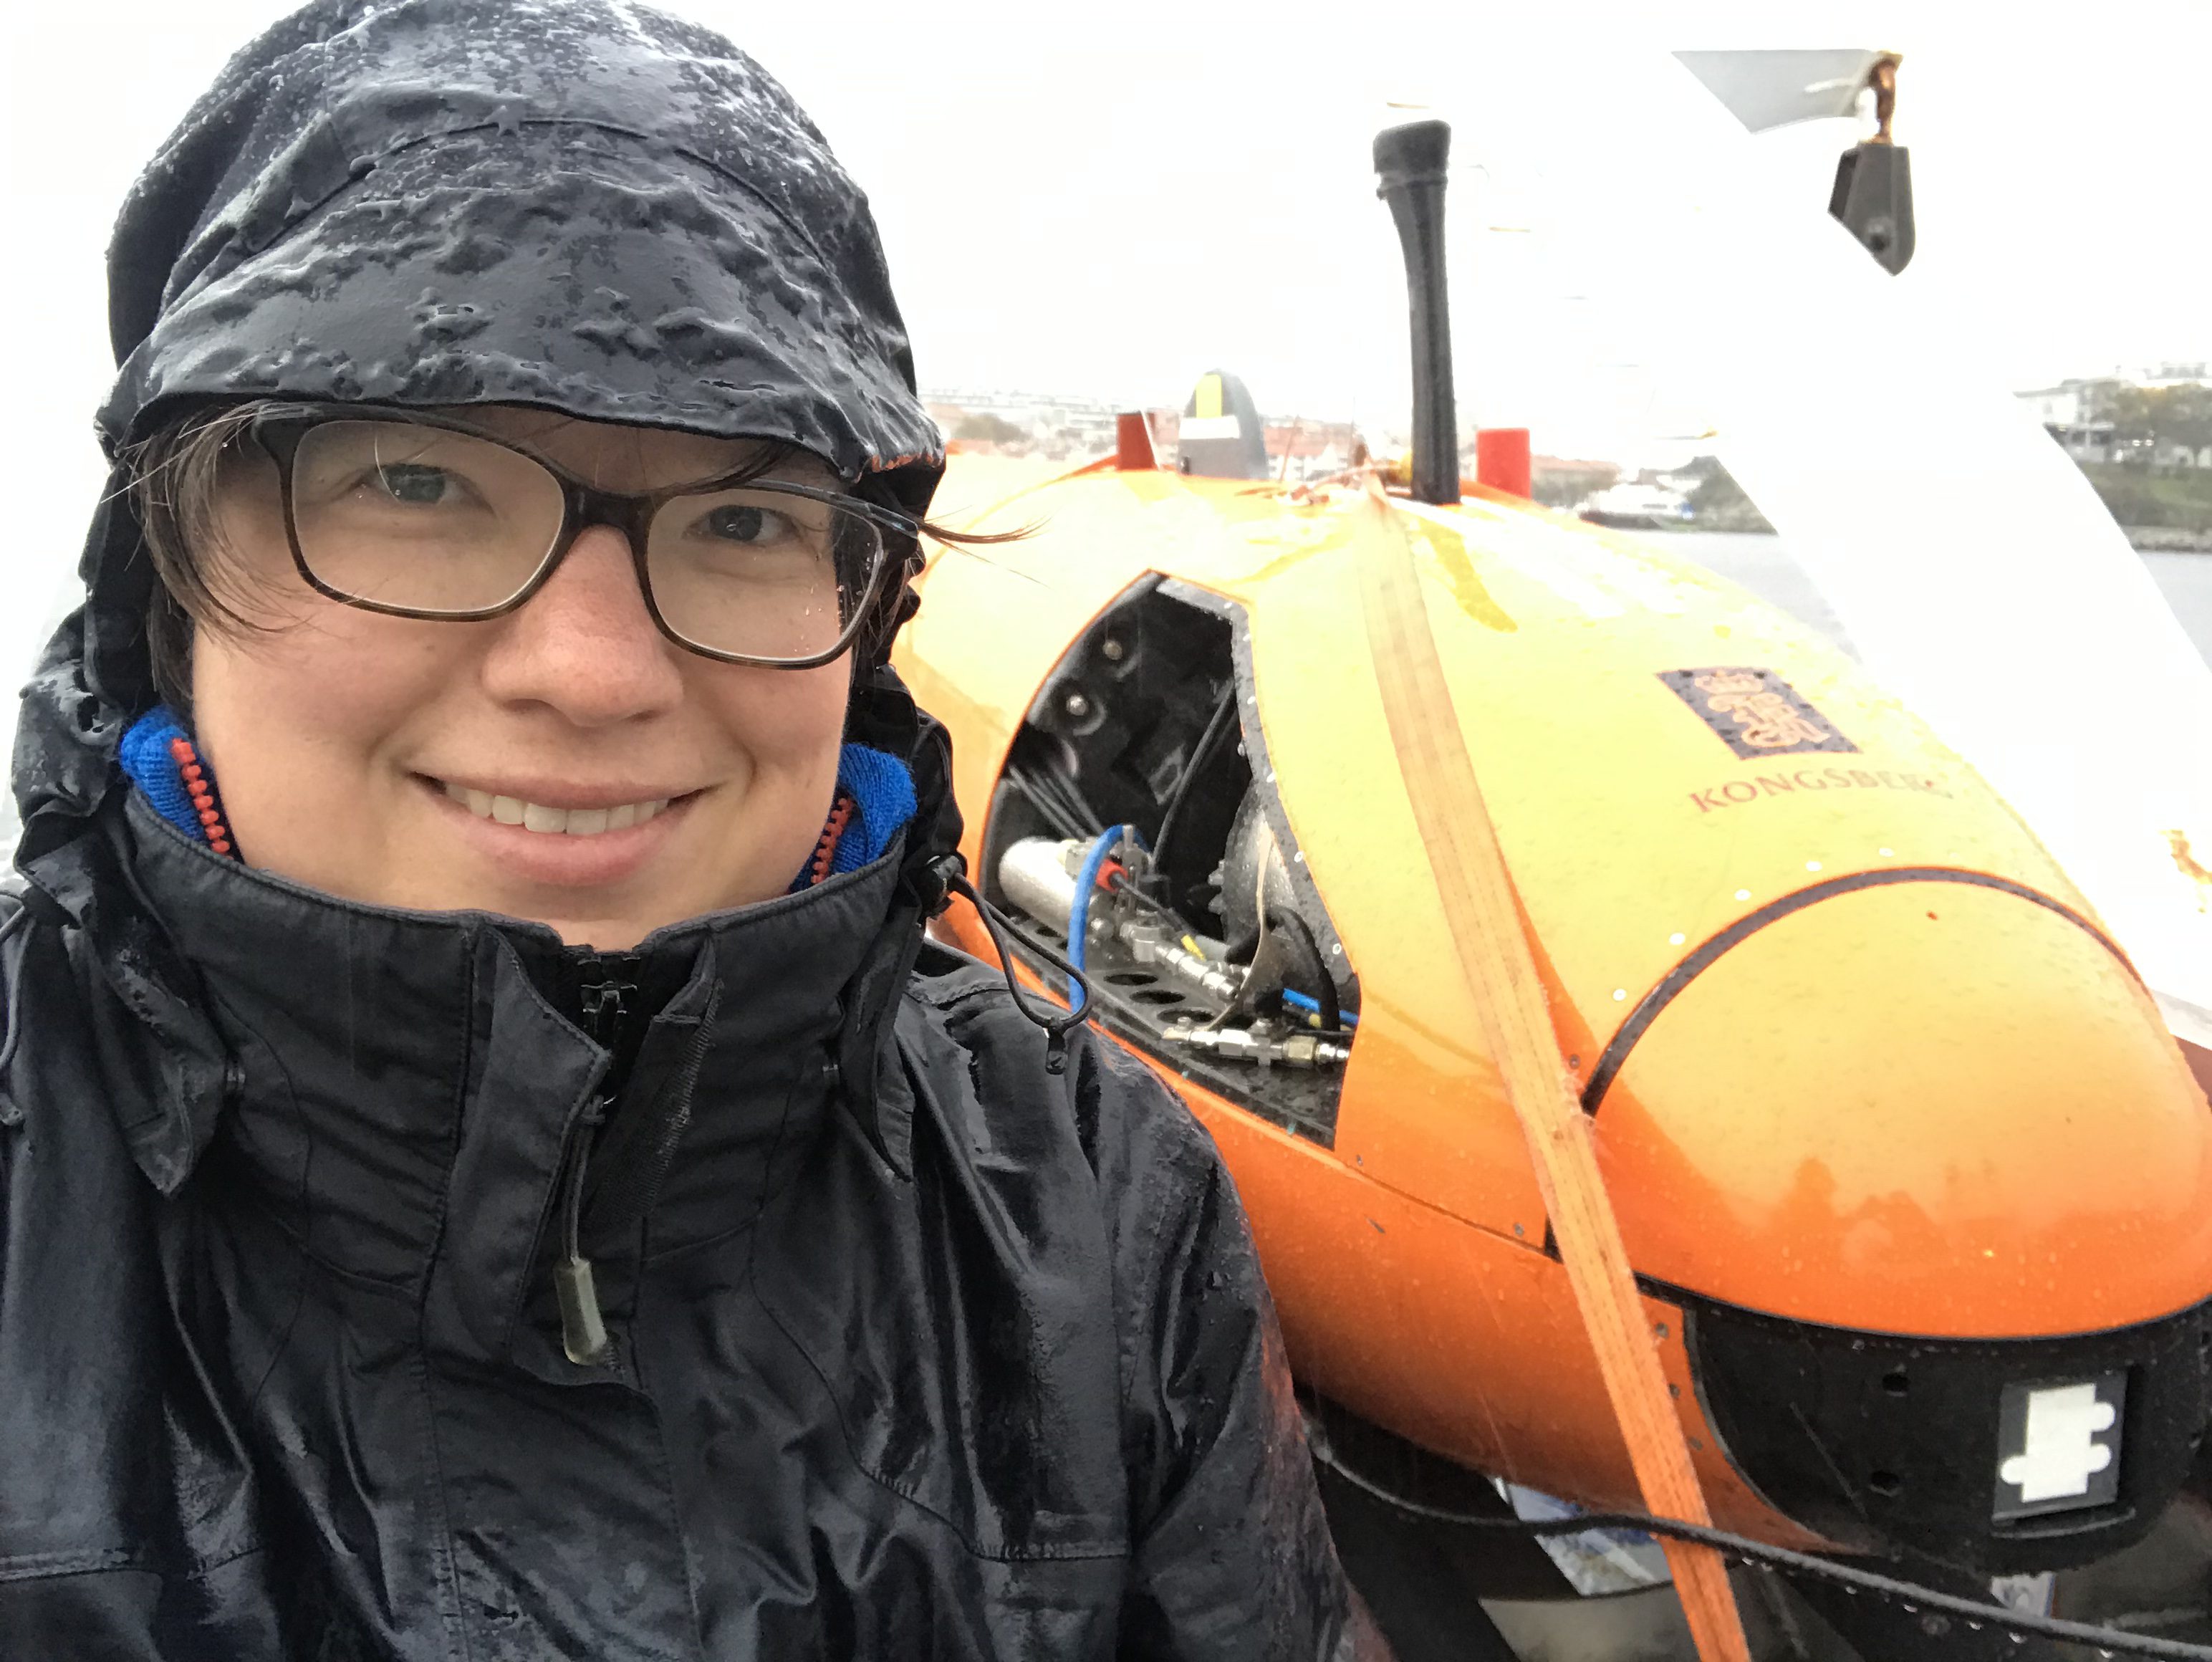
Two weeks ago in Gothenburg, I was lucky enough to meet Ran, Anna Wåhlin’s Autonomous Underwater Vehicle.

I posted a lot about that on Twitter, but have been wanting to combine the pics and short clips into a movie. But I just couldn’t be bothered to do something about the sound, so I put it off, but eventually I figured that I really wanted my mom to watch it so here we go. Please excuse the bad sound quality. I am currently looking into small microphones to work with my phone… Any advice?

(See pictures below the movie if you are interested)

And here we go! Selfie with Ran!

Anna and Johan doing pre-dive checks and mission planning

Another selfie with Ran. Can you tell that I am excited to meet her?

But wow, it takes a while until she’s ready to go into the water! ;-)

But there she is, finally ready to dive. Can you spot her?

When Ran is diving, there isn’t really a lot to do. Except, of course, wave watching! I always love looking at how the waves are claiming back the area that a ship just vacated (which you see from the turbulent wake).

And there she is again, ready to be recovered!

Science is such a team effort. We wouldn’t be able to do any oceanography without the amazing captains & crews on the research ships. And it’s no different on RV Skagerak. They are just lovely!

And Ran is on the hook to be pulled back on board!

This is a lot more difficult that I imagined!

Oh, and then there were a couple of CTD stations to get some data to calibrate the sensors on Ran with. I love CTDs :-)

Next recovery…

And more wave watching!

On RV Skagerak, communications are very direct. Just open the porthole and you are ready to drive the CTD! :-)

No rest for the wicked… Recovering Ran at night.

Exciting times!

Thanks again for having me, Anna! I really enjoyed it so much! :-)

Taking water samples

A big part of any oceanographic research cruise: Taking water samples.

Here is a group of students practicing how to arm Niskin bottles that will go into the ocean open on both ends, and that will then, when the whole rosette is on its way up again, be closed one after another at depths that promise to be interesting in terms of water properties.

Arming those Niskin bottles is actually not as easy as it looks, there is a strong spring going through the bottle, connecting the lids. And it is actually pretty painful if you accidentally close the bottles while some part of your body is between the bottle and the lid. Ask me how I know…

When the bottles are all open, the rosette can be lifted off the deck and into the sea.

Usually, rosettes are equipped with instrumentation in addition to the Niskin bottles, usually a CTD, measuring conductivity (to calculate the salinity from), temperature, and depth (actually measuring pressure, which converts easily into depth). I contributed to a very nice movie about how CTDs work a couple of years ago, check it out!

And now the rosette is finally in the water.

Water samples in physical oceanography are mainly used to calibrate the sensors on the CTD, which give (pretty much) continuous measurements throughout the whole depth of the water column. And that’s also what we want to use our water samples for — we have a hand-held conductivity probe that is right now producing values that cannot be correct. How we are going to deal with that? We (and you!) will find out tomorrow! :-)

Student cruises (part 4 of many – weird profiles)

When a CTD profile suddenly looks really weird.

As mentioned before, student cruises seem to bring out the weird experiences with CTDs. My theory is that it’s the world testing us. It would be bad enough to deal with this stuff if we were on CTD watch in the middle of the night on our own, but dealing with it in front of a group of eager students, all asking questions when you just want to think, is the ultimate test of whether you know your stuff and have the nerves to deal with anything.

So, of course, this year’s GEOF130 student cruise couldn’t be an exception. After dealing with an unfortunate encounter of the CTD and the bottom about which we shall not say any more than this, the next profile looked like this:

Not seeing it yet? Let me zoom in for you:

A really weird offset between downcast and upcast occurred in density and salinity, persisted for about 100m, ended with a huge spike and then disappeared.

So what happened? I have actually no idea. I’ve seen jellyfish being sucked into the pump, resulting in fresh spikes. And that salinity and density react very similarly even for anomalies is not that surprising, seeing that one is calculated from the other. But why would the shape of the profile stay the same, only shifted towards fresher values and lower densities? Ideas, anyone?

Student cruise (part 3 of many, or – when the CTD didn’t start up)

When a CTD just doesn’t start pumping.

In this post, I talked about how student cruises always happen to be on the perfect days, and then in this post I talked about how to read CTD profiles. So now knowing all of this, here is a confession: I have never seen so much weird stuff happen to the CTD as on student cruises!

Last year, I took my students of the GEOF130 course out. We had two groups on a one-day cruise each, on FS G. O. Sars, the new-ish and fancy Bergen-based research ship.

Of course, as any real cruise, we started with a safety briefing with the officers.

But listening to the rules wasn’t enough, students had to also try on the survival suits.

But then at some point, we started doing science.

Since I already talked about what the CTD operator typically sees on the screen, I’m only showing you the ones you haven’t seen yet. Did I mention that the G.O. Sars is a pretty fancy ship? And this doesn’t even show the met data or fish finder, which were on yet another cluster of screens.

Finally, we were on station and ready to deploy the CTD.

But then, when the CTD was finally in the water, we waited. And waited. And waited. And nothing happened! We waited some more, but the pump on the CTD just didn’t switch on. We lowered the CTD. And lowered it some more. And waited. And then, when we were almost ready to bring it back up on deck, we brought it even deeper and it started up! When we got the first readings, we realized what had been the problem. The CTD pumps are set to switch off when salinities fall below a certain value. This is done to make sure the pump switches off when the CTD isn’t in the water any more to avoid having the pump run dry. And since we were in a fjord (where we typically have a fresh layer on top, see this experiment) on a calm day after a very calm week, clearly, the salt stratification had become so strong that we couldn’t even measure the top layer because our CTD didn’t recognize it was in the sea! I’ve never seen this happen before.

But then finally we brought the CTD back up on deck and students could start to practice sampling.

We were incredibly lucky with the weather, and since we had Sindre Skrede visit us, we can even document it with beautiful pictures!

The end! :-)

Student cruise (part 2 of many, or – reading CTD profiles)

Reading CTD profiles.

In this post, I talked about student cruises and why they are important for motivation. Here I want to go into a bit more detail on one of the actual learning outcomes: Using the CTD to make measurements, and reading the profiles.

I already talked about how a CTD works a while back, but today I want to go into a bit more detail of what you can actually see in a CTD profile when you are sitting in the lab at sea, staring at the monitor, while the CTD is going up or down.

There are a couple of important things to note here. First, let’s go through the command windows on the right. The lowest one is general cruise information that goes into the header of the data file: Station number, cruise name, chief scientist, this kind of things.

The next window up is the position and time of that station. Important information for the header of the data file, not so crucial for the CTD operator to know.

But then the next window up is where it gets interesting. The yellow field shows the distance from the instrument to the sea floor, calculated from an echosounder-like instrument mounted on the CTD. The distance from the bottom is really important to know, since you will want to make sure that the CTD does not ever hit the bottom, and the depths in sea charts are not very reliable if you are in remote areas.

And then lastly, the most interesting window on the left. This is where data is displayed in real time as it is measured while the CTD is being lowered and hoisted up again. On the horizontal axis, the properties (temperature, salinity, density and oxygen) are displayed against depth on the vertical axis. You see water being warmer and fresher towards the surface than at depth, with higher oxygen concentrations near the surface. So far, so good.

In the blow-up in the figure above you see several interesting features. But I want to focus on one in particular: The blue oxygen curve.

In the depth range displayed here, the downcast (measured when the CTD went down) and the upcast (measured when the CTD went up again) don’t agree very well. And while one of them is nice and smooth, the other one shows many wiggles. Why is that?

When sitting in front of the monitor on CTD watch, it is easy to forget that the vertical axis displays pressure. As you watch the graph build up, it seems like it might as well be time. The longer you watch, the further down the CTD sinks, until at some point it turns around and comes back up. When you’ve done a couple of CTD stations, you know very well how long any given station will take and you have optimized what point you need to get ready to step outside and help bringing the CTD back in in order to be there on time but not any earlier than necessary.

However, what is displayed on the vertical axis is depth. Or, if you want to be even more precise, pressure. Usually, pressure can be converted to depth fairly easily. For every 10 meter you go down in water, the pressure increases by 1 bar. This is, however, assuming that the water surface stays in the same place. In the station shown above, this was clearly not the case. All the wiggles you see in the profile? Yeah, waves. And if you look closely at the plot, you can estimate their amplitude. Yes, about 5 meters.

So this is why you want to always keep an eye on that number in the yellow field – the distance from the bottom. In case of this station we were lucky: We had a wave train coming through as the CTD was about half way down, but while we were close to the bottom the sea was relatively calm. But that was dumb luck. We have also been on station when the waves were highest while we were closest to the bottom. And that is when CTD operators get very nervous, especially on cruises where one of the main objectives is to measure as close to the bottom as possible. But as always: better safe than sorry; better lose some data close to the bottom than the whole CTD.

Student cruising

Why student cruises always end up being on the most beautiful days of the year, or: why student cruises are an important part of the education.

Remember the picture I showed in the last post, that was worthy of being on an Advent calendar or postcard? The one below?

IMG_5874

FS Håkon Mosby arriving back in Bergen in November 2013.

That was taken on this year’s GEOF130 student cruise.

And remember the ice-on-Hardangerfjorden picture I shared a while back? This one?

Oh, taken on this year’s GEOF332 student cruise.

And the student cruise before, GEOF130 in 2012, looked like this:

See a pattern here?

So how come we always end up being out on the perfect day? Well, firstly, clearly I am that good. Or that lucky. But then, the perfect day only becomes the perfect day when you give it the chance.

What I mean is that on student cruises, it is easy for a day to become perfect. Because it is exciting to be on a research ship for the first time, to figure out how to measure oceanographic data, to develop a feeling for how much the ship is actually supposed to be rolling before you have any reason to become concerned, to see how your oceanography classes apply to the real world, to put on an orange one-fits-all survival suit, to gauge how you can influence the quality of the data by paying attention (or not), to get a break from your everyday life, to eat all the awesome food all the time, to visit the captain on the bridge, to see the familiar city from the water, to see a whole new world opening up to you, to experience what it could be like to be an oceanographer.

Especially in the “introduction to oceanography” lecture GEOF130, the student cruise is so much more than just knowledge transfer – it is an incredibly important part of building a professional identity that helps students to find motivation to sit through boring lectures and to fight through difficult exams because in the end they will then get to do this again: to go an another cruise and have more perfect days at sea.


How a CTD works

Movie on how the most important instrument in oceanography works.

On our cruise on the WHOI research vessel Knorr in 2011, Sindre Skrede (find him on twitter or vimeo for many more exciting pictures and movies!) and I made a movie for his blog, describing the most important oceanographic instrument. We recently translated the movie from Norwegian to English and here it is. Enjoy!