Category Archives: tank experiment

Thermal forcing vs rotation

The first experiment we ever ran with our DIYnamics rotating tank was using a cold beer bottle in the center of a rotating tank full or lukewarm water. This experiment is really interesting because, depending on the rotation of the tank, it will display different regimes. For small rotations we get a low latitude, laminar, tropical Hadley circulation case. Spinning faster, we get a baroclinic instability, eddying, extra-tropical case. Both are really interesting, and in the movie below I am showing four experimentsm ranging from “thermal forcing, no rotation”, over two experiments which include both thermal forcing and rotation at different rates to show both the “Hadley cell” and “baroclinic instability” case, to “no thermal forcing, just rotation”. Enjoy!

Ekman layers in my kitchen

Several of my friends were planning on teaching with DIYnamics rotating tables right now. Unfortunately, that’s currently impossible. Fortunately, though, I have one at home and enjoy playing with it enough that I’m

  1. Playing with it
  2. Making videos of me playing with it
  3. Putting the videos on the internet
  4. Going to do video calls with my friends’ classes, so that the students can at least “remote control” the hands-on experiments they were supposed to be doing themselves.

Here is me introducing the setup:

Today, I want to share a video I filmed on Ekman layers. To be clear: This is not a polished, stand-alone teaching video. It’s me rambling while playing. It’s supposed to give students an initial idea of an experiment we’ll be doing together during a video call, and that they’ll be discussing in much more depth in class. It’s also meant to prepare them for more “polished” videos, which are sometimes so polished that it’s hard to actually see what’s going on. If everything looks too perfect it almost looks unreal, know what I mean? Anyway, this is as authentic as it gets, me playing in my kitchen. Welcome! :-)

In the video, I am stopping a tank that was spun up into solid body rotation, to watch a bottom Ekman layer develop. Follow along for the whole journey:

Now. What are you curious about? What would you like to try? What would you do differently? Any questions for me? :-)

Rossby-#WaveWatchingWednesday

Several of my friends were planning on teaching with DIYnamics rotating tables right now. Unfortunately, that’s currently impossible. Fortunately, though, I have one at home and enjoy playing with it enough that I’m

  1. Playing with it
  2. Making videos of me playing with it
  3. Putting the videos on the internet
  4. Going to do video calls with my friends’ classes, so that the students can at least “remote control” the hands-on experiments they were supposed to be doing themselves.

Here is me introducing the setup:

Today, I want to share a video I filmed on planetary Rossby waves. To be clear: This is not a polished, stand-alone teaching video. It’s me rambling while playing. It’s supposed to give students an initial idea of an experiment we’ll be doing together during a video call, and that they’ll be discussing in much more depth in class. It’s also meant to prepare them for more “polished” videos, which are sometimes so polished that it’s hard to actually see what’s going on. If everything looks too perfect it almost looks artificial, know what I mean? Anyway, this is as authentic as it gets, me playing in my kitchen. Welcome! :-)

In the video, I am using an ice cube, melting on a sloping bottom in a rotating tank, to create planetary Rossby waves. Follow along with the whole process:

Also check out the video below that shows both a top- and side view of a planetary Rossby wave, both filmed with co-rotating cameras.

Previous blog posts with more movies for example here.

Now. What are you curious about? What would you like to try? What would you do differently? Any questions for me? :-)

Brine rejection and overturning, but not the way you think! Guest post by Robert Dellinger

It’s #KitchenOceanography season! For example in Prof. Tessa M Hill‘s class at UC Davis. Last week, her student Robert Dellinger posted a video of an overturning circulation on Twitter that got me super excited (not only because as of now, April 15th, it has 70 retweets and 309 likes. That’s orders of magnitude more successful than any kitchen oceanography stuff I have ever posted! Congratulations!).

Robert is using red, warm water on one side and melt water of blue ice cubes on the other side to provide heating and cooling to his tank to create the overturning. Why did I get so excited? Because of this: the head of the meltwater plume was very clearly not blue (see above)! Rob kindly agreed to write a guest post about these observations:

“I first and foremost want to start off by thanking Dr. Mirjam Glessmer for doing a phenomenal job at SciCom through Kitchen Oceanography. I was able to replicate her physical oceanography experiment regarding oceanic overturning circulation for my oceanography class with Dr. Tessa Hill.

As mentioned in her previous post, oceanographic currents are often simplified to give an easier understanding of how oceanic overturning circulation operates. The top 10% of our oceans are controlled by wind-driven currents and tidal fluctuations while the bottom 90% of our ocean currents are controlled by density-dependent movements.Originally this process was defined as thermal circulation but was later expanded to thermohaline circulation. Thermohaline circulation is dependent upon both temperature (thermal) and salinity (haline.) These density-dependent reactions occur when either freshwater fluxes meet saltwater and from thermal differences in water masses. Due to differential heating in our planet, colder formations of dense water masses are formed at the poles, which in turn causes the convective mixing and sinking of water masses driving oceanic circulation.

(Video by Robert Dellinger; thanks for letting me use it!)

In this experiment, we primarily focus on the thermally dependent reactions between two water masses. As seen in the video, the warmer water mass is dyed red, while the cold water mass formed by ice melting, is blue. As expected the more dense water mass (cold) is pushed under the warmer mass once they meet. One feature I would like to point out is the clear plume head feature in my experiment (see picture on top of this post). My theory is that part of the ice cube that was not dyed melted first and was pushed under the warm water mass. This feature is most likely due to the ice cube experiencing unequal cooling, which in turn led to an uneven dye distribution as seen in the previous post “Sea ice formation, brine release, or: What ice cubes can tell you about your freezer.

As seen in the experiment, thermohaline circulation is thermally driven therefore, the role of salinity causes the system to be non-linear. Salinity serves as a positive feedback mechanism by increasing the salinity of deeper water and strengthens the circulation. Furthermore, current studies are focusing on how atmospheric warming is altering thermohaline circulation attributed by increases in ocean heat absorption and freshwater fluxes (primarily from melting ice caps.)”

Reposting my “field report” for the DIYnamics blog

Reposting a guest post I wrote for the @DIYnamicsTeam‘s blog:

When we came across the DIYnamics article right after its publication, Torge and I (Mirjam) were very excited about the endless possibilities we saw opening up with an affordable tool like the DIYnamics rotating table. We applied for, and were granted, money for an “innovative teaching” project by Kiel University’s PerLe (1) and built four DIYnamics rotating tables (five if you count the one I built for personal use ;-)), which we’ve been working with for about a year now. Since we are using them in a slightly different context than we’ve seen described before, and also have modified and added some of the experiments, I thought I’d report on it here. If you have any comments or suggestions for us, please do get in touch!

DIYnamics tables in undergraduate education

In contrast to using the DIYnamics rotating tables mainly for outreach purposes which is the most common application I am aware of, we are using them as part of a regular Bachelor-level class on “ocean and atmosphere dynamics” at Geomar, Germany. I have gained a lot of experience using a rotating table in undergraduate education at GFI, Norway, but there we only had one – much bigger – table available. Now we have four that can be used simultaneously! This is great for so many reasons:

Time efficiency for the instructor

With only one rotating table available, the typical setup I have used was to have small groups of students come in at different times over the course of a week or so, to do that week’s experiment with me. But that meant that I would spend a lot of time in the lab, and a large part of that time would be spent on waiting for the water on the rotating table to have spun up into solid body rotation, as well as prep time or cleaning, drying, putting away time.

Of course, wait times can easily be used for discussions of the upcoming experiment, of the concept of a “spun up” body of water, of how to judge whether or not a body of water is spun up or not, and many other things. But those are things that don’t necessarily have to be discussed in a setting of one instructor per each small student group, they could just as well be discussed in student groups and then in a larger plenum.

Exchange between student groups

In the setup with one table and student groups coming in one after the other, students would then write lab reports, submit them, and come back for the next experiment. While I am sure there was some exchange between student groups happening (which we could sometimes see from eerily similar ways of expressing things between groups, or errors propagating through several groups’ reports), that wasn’t an instructional design choice.

Now, however, when we have student groups working on the same experiment at the same time in the same room, it is very easy to have discussions both within individual groups and then across groups. There are many instructional methods to choose from that facilitate that kind of exchange, for example “think, pair, share”, where students first think about a question individually, then pair up with a partner (or the group at their tank) to discuss, and then results are shared with and discussed in the whole class.

Seeing many implementations of the same experiment

One reason why these discussions are especially fruitful if done in connection with simultaneously-run tank experiments is that, even if all student groups get the exact same instructions, two implementations of the same experiment do not ever look the same. There is always something that’s different. Maybe one tank is spun up less than the others, or a bit wobbly, because someone bumped into the table mid-spinup. Or the dye that is used as flow tracer has a different density for one group (less diluted? Different temperature?) and thus behaves differently. Or dye is put in a different spot in the tank and thus shows different features of the flow field. There are so many tiny things that can and will be different from experiment to experiment, and it’s a great learning experience to see an ensemble of different implementations and discuss what change in boundary conditions made results look different rather than just seeing one implementation and wrongly assuming that this is the one and only way this experiment always turns out.

Seeing many different experiments at the same time

And then, there is of course the opportunity to have different student groups work on different experiments simultaneously, which cuts down on total prep and spin-up time and enables students to see a larger variety of experiments. It also opens up the possibility that students pick what experiment they want to work on – either new ones or repeating older ones that they would like to take better pictures of or modify something in the boundary conditions. This seems to be very motivating!

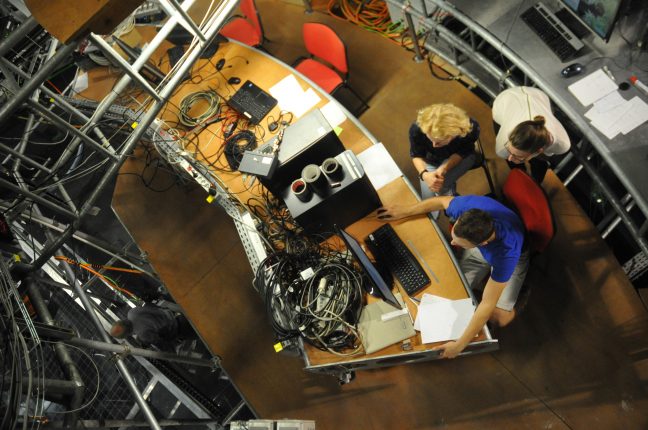
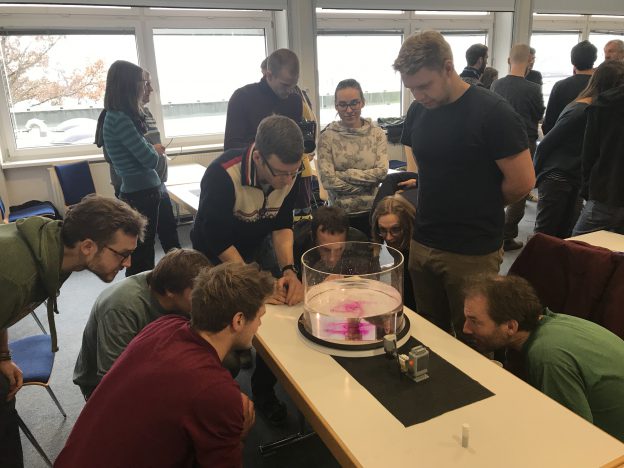
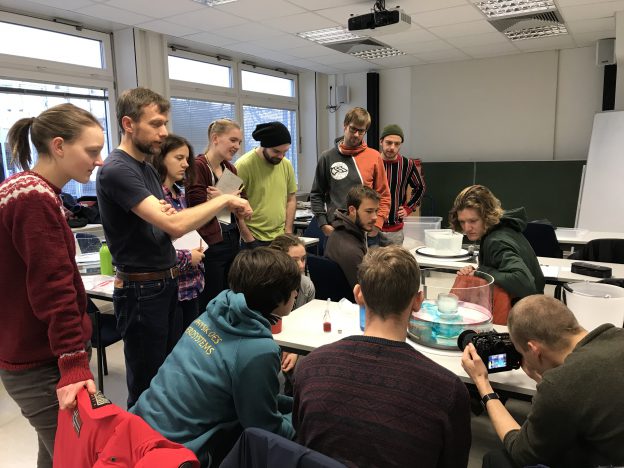
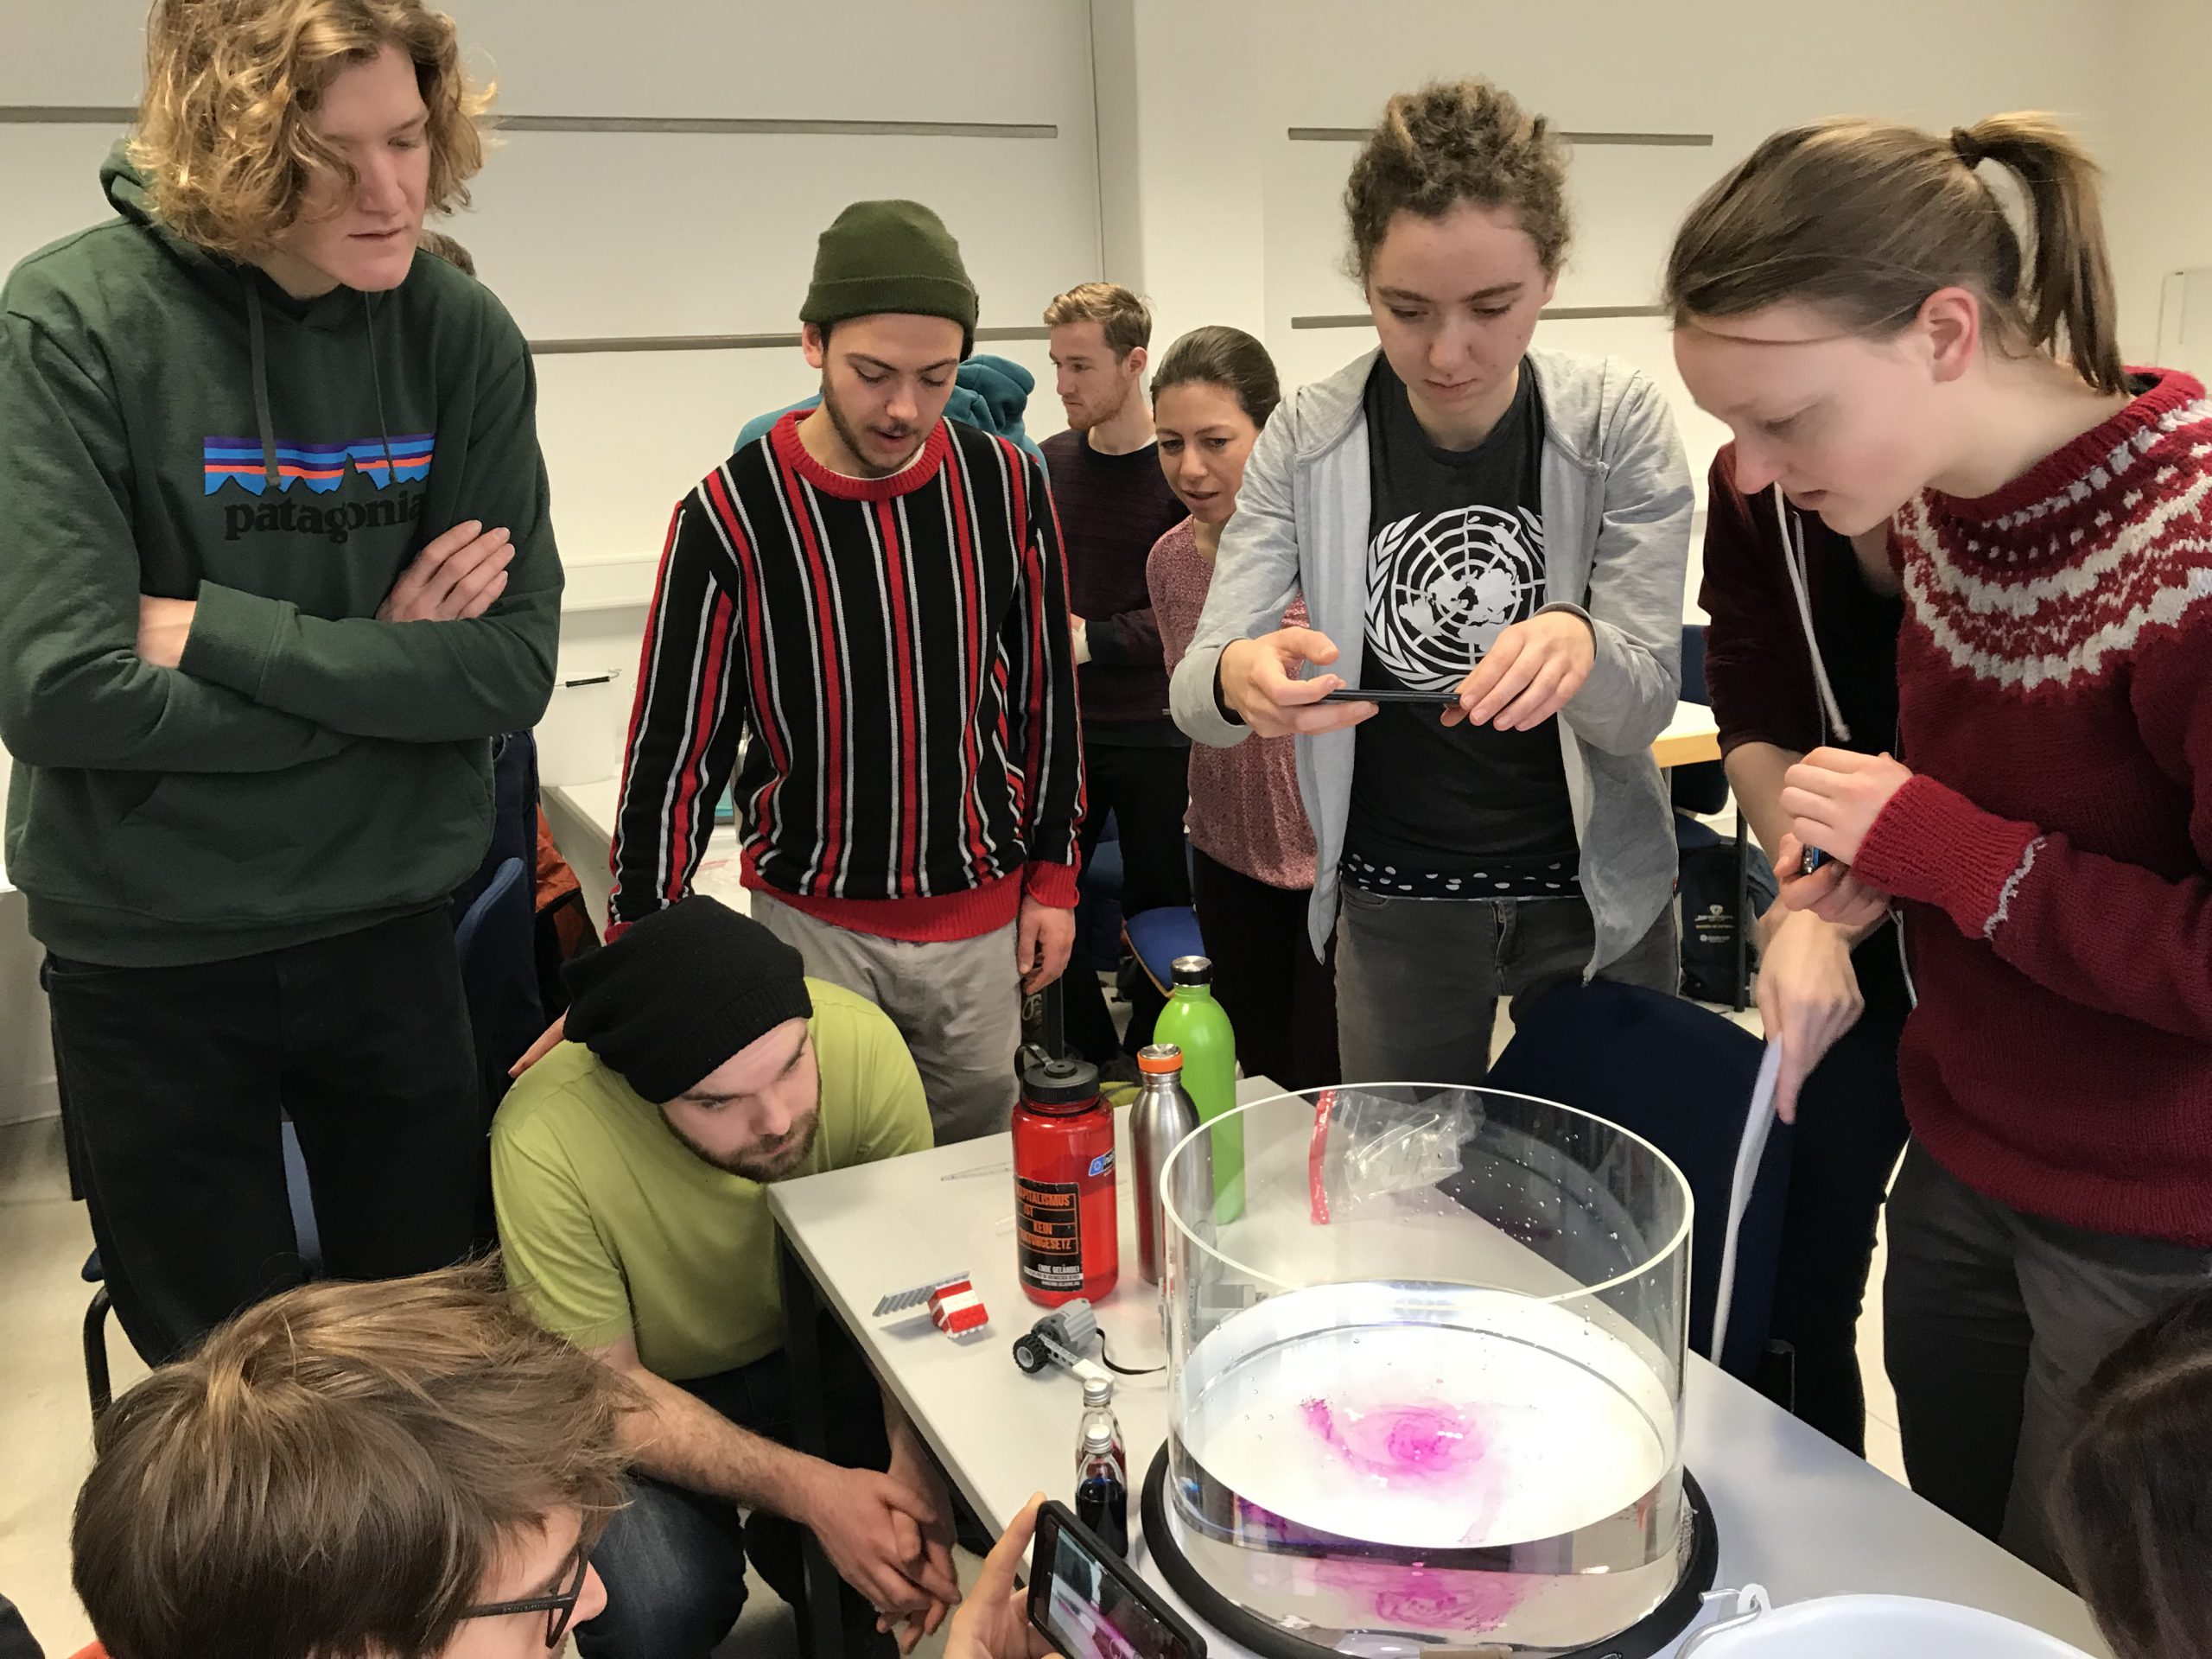
Our group of students coming together at one tank to discuss observations. Note that in the background a square tank is sitting on a different rotating table, being spun up for the Rossby wave experiment described below

Why we are using higher-walled tanks

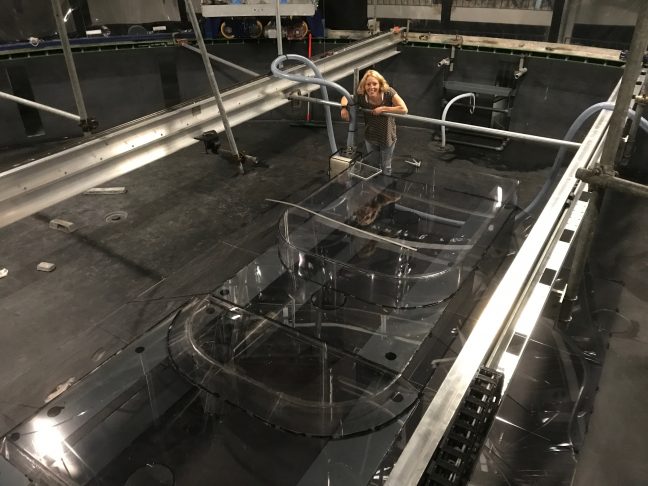
In contrast to the tanks we’ve seen used on the DIYnamics rotating tables before, we chose to invest in some high-walled tanks.

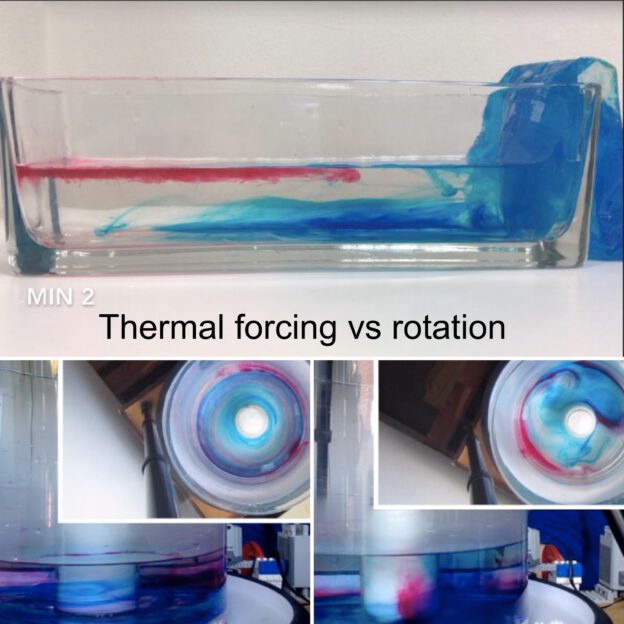
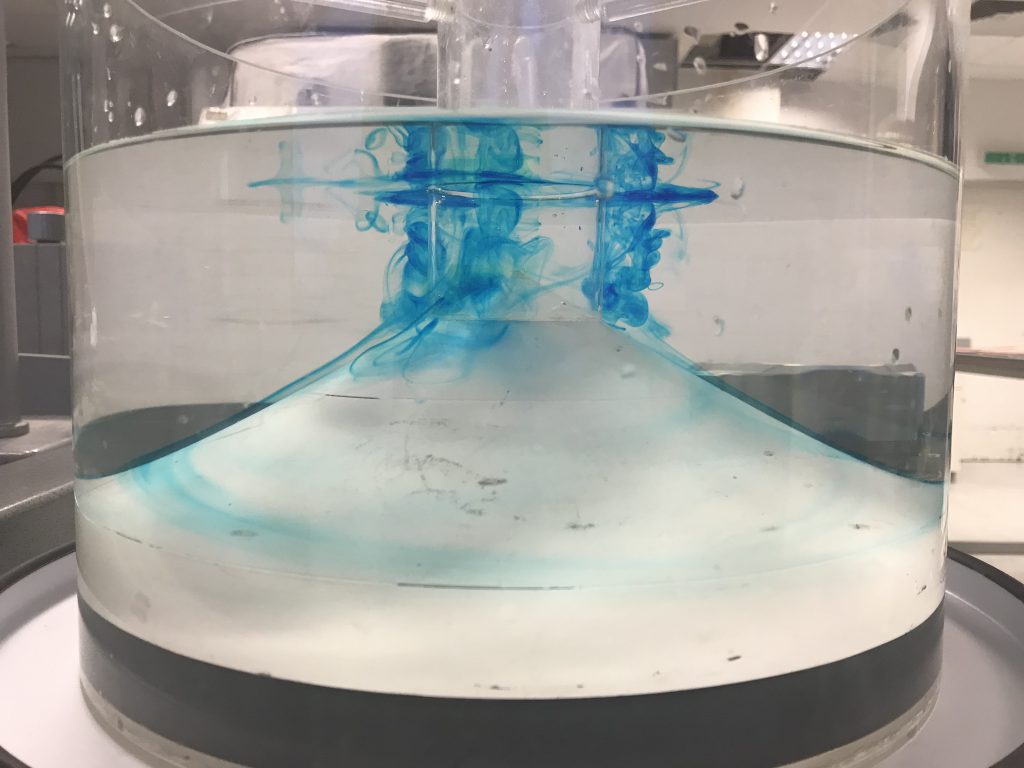
An interesting feature of rotating fluid dynamics is that the flow becomes 2D, so technically having a shallow layer of water is completely sufficient to give a good representation of those flows. And if we look at the aspect ratios of the oceans, they are in fact extremely shallow compared to their horizontal extent. But it’s easy to see a 2D flow in a shallow tank and assume that it’s 2D because of the shape of the tank, not because of the flow itself. So having an exaggerated third (depth) dimension that can be easily observed by looking into the tank from the side actually helps drive home the point that there is “nothing to see” on that dimension because the flow really is as 2D as theory told us it would be.

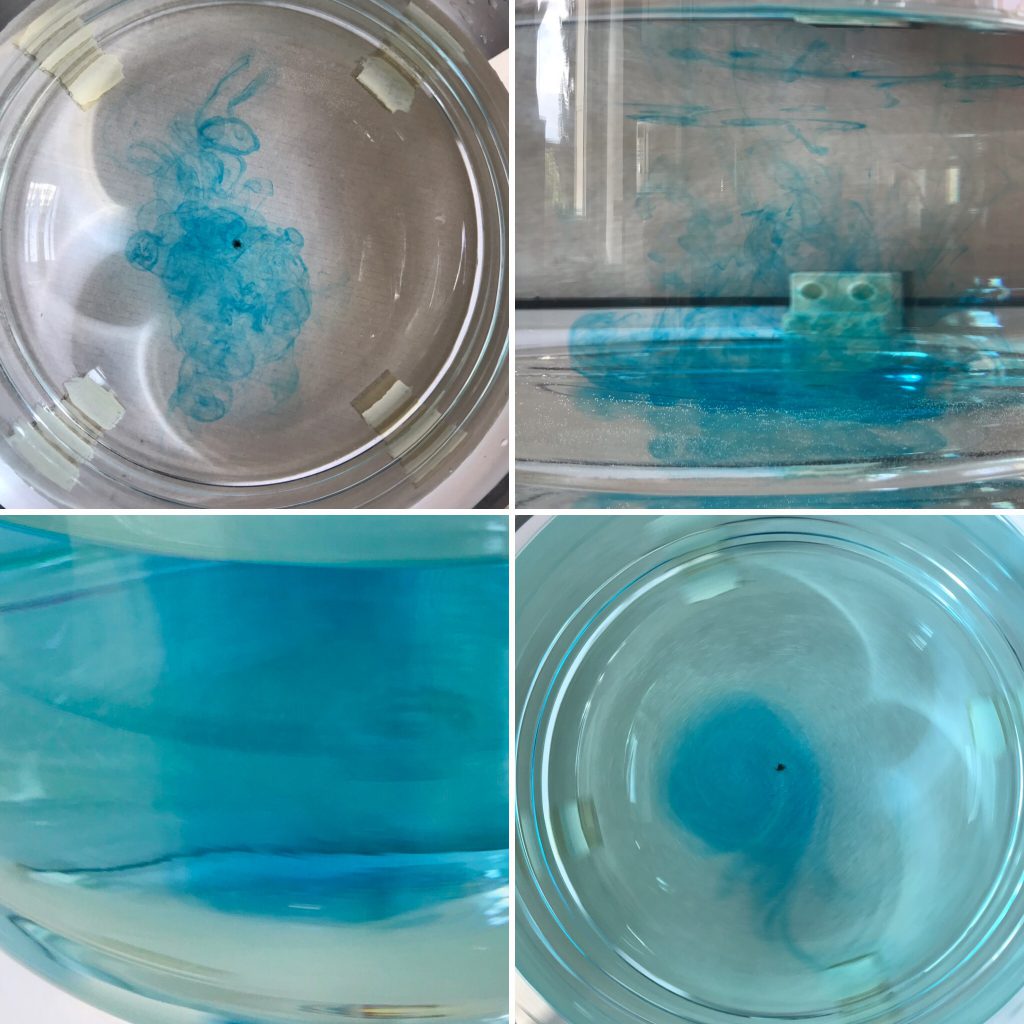
But then there are of course the cases where the flow isn’t 2D, and then a higher-walled tank is really convenient. For some experiments where there are exciting things to discover by looking into the tank from the side, check out this blog post over on my blog.

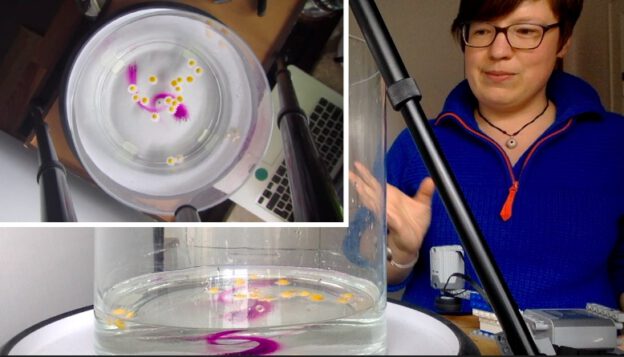
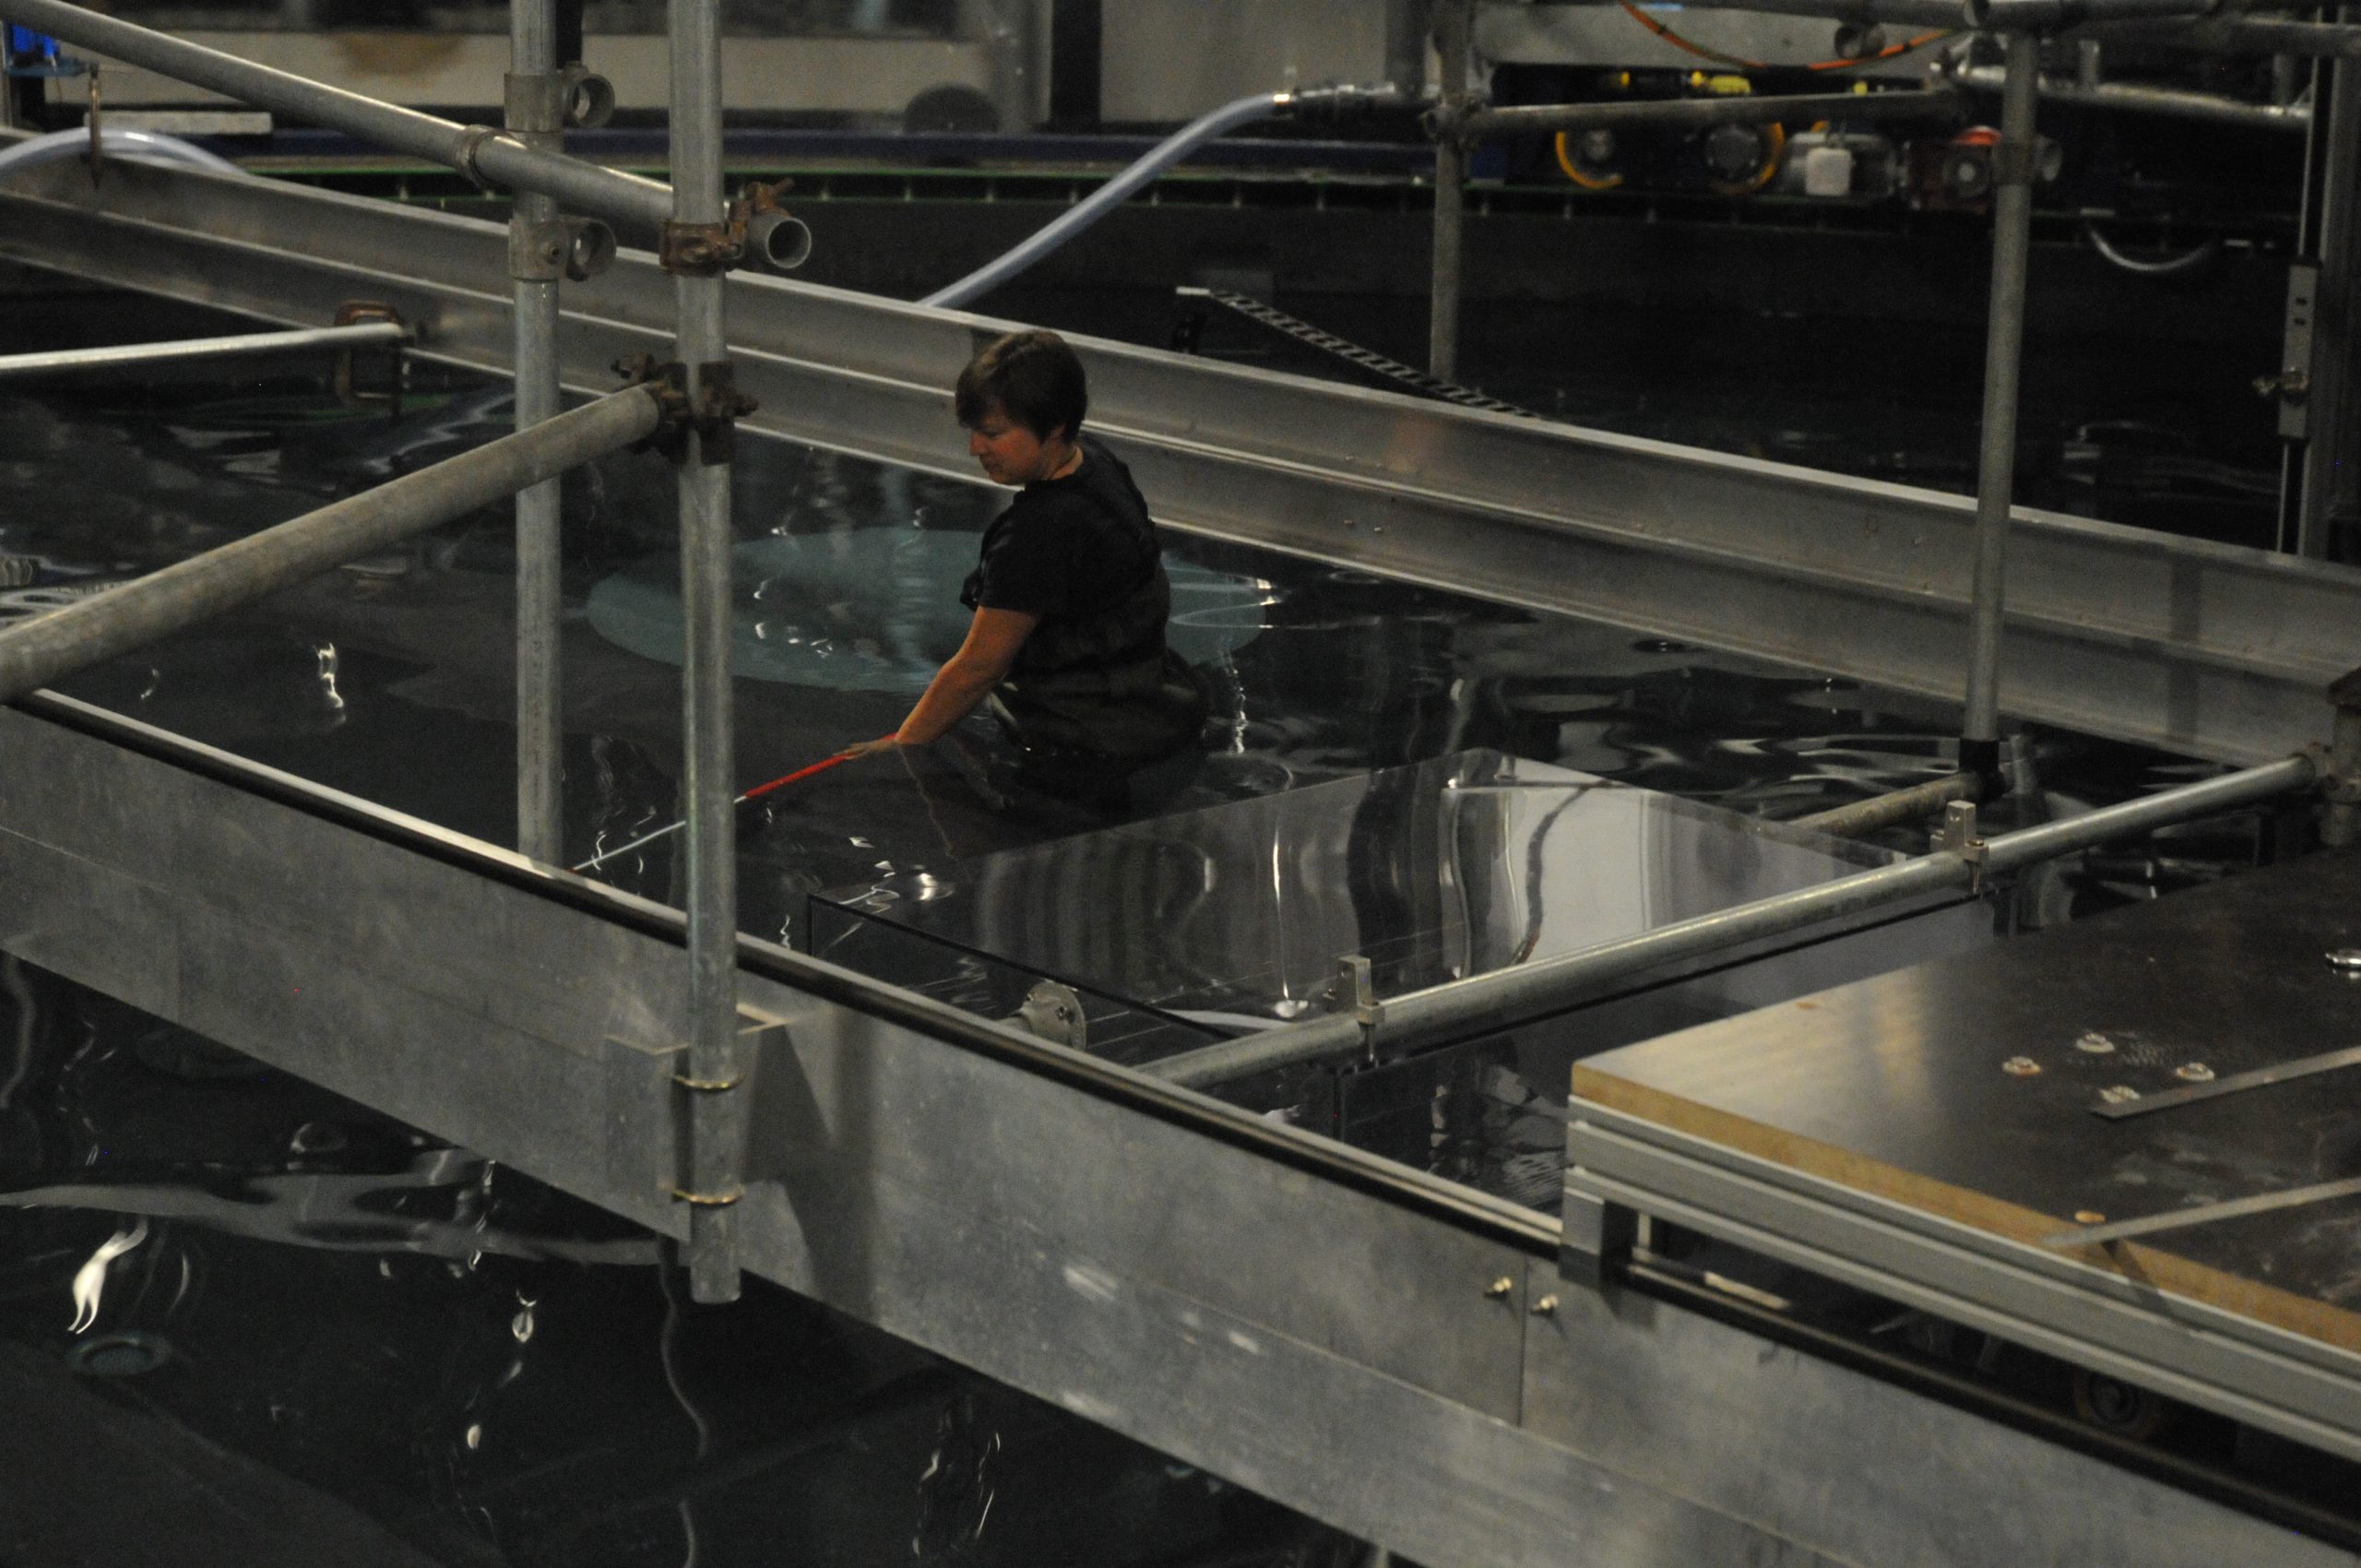
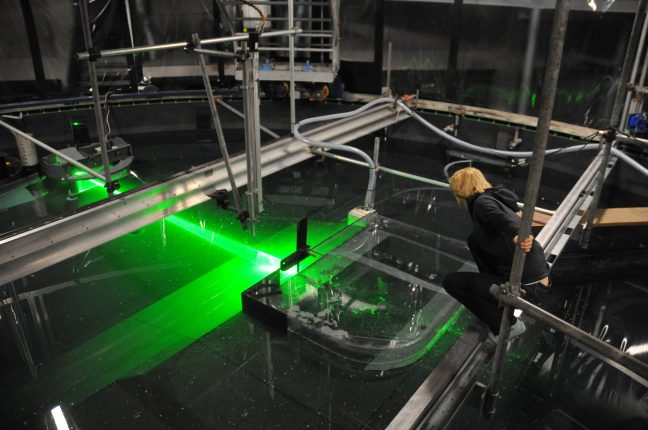
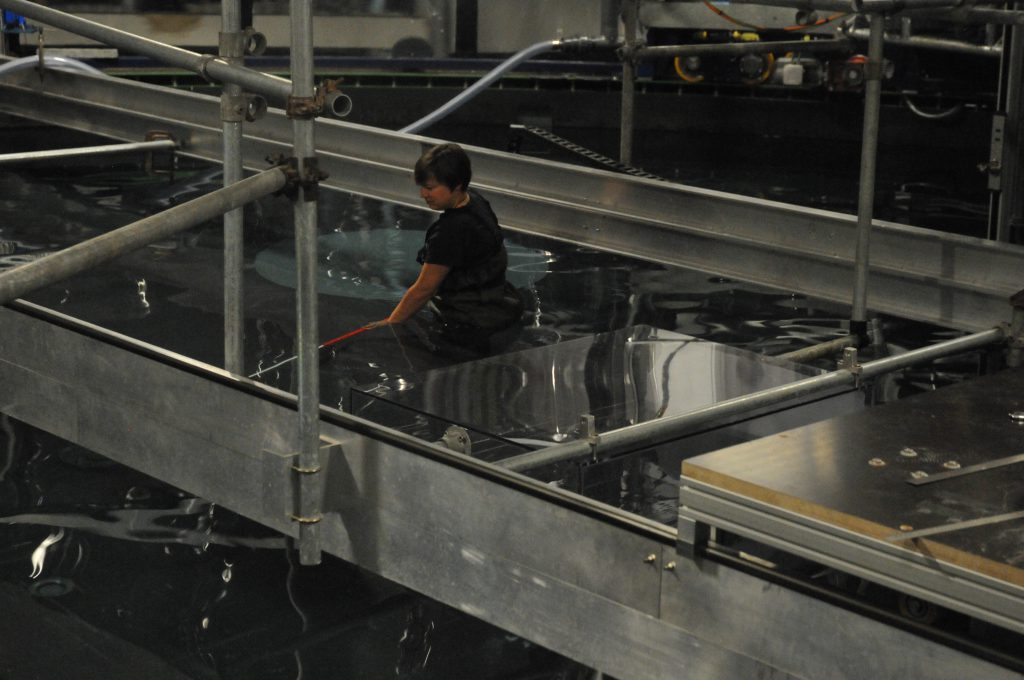
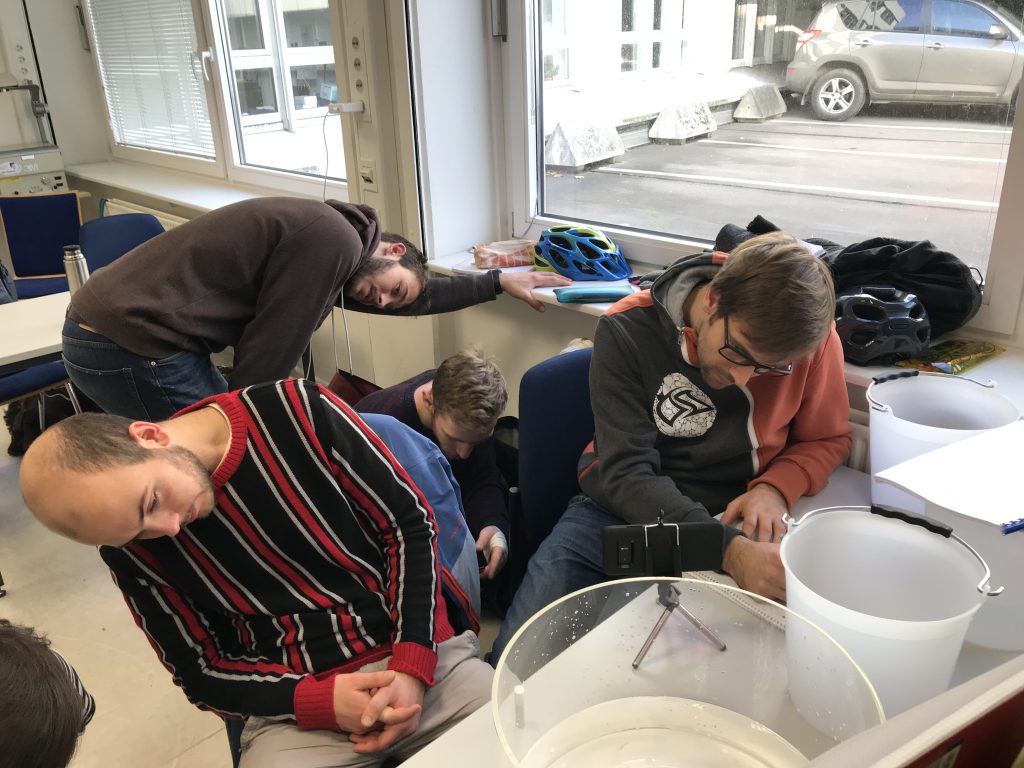
Students working with an experiment on the Ekman bottom boundary layer – one of the experiments that really benefit from a larger water depth because this allows for observations of the development of the boundary layer over time.

Experiment on planetary Rossby waves

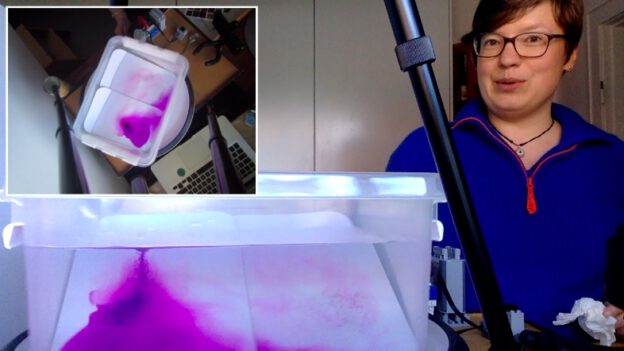
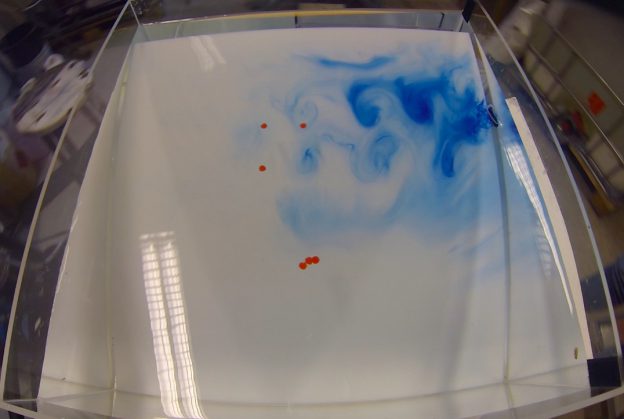
One of the first experiments we tried on our DIYnamics rotating table was a “planetary Rossby wave” experiment. We hadn’t bought our cylindrical tanks yet (read more about those below), so using a clear plastic storage box was very convenient. Btw, this is one of the experiments where looking into the tank from the side gives a lot of interesting insights!

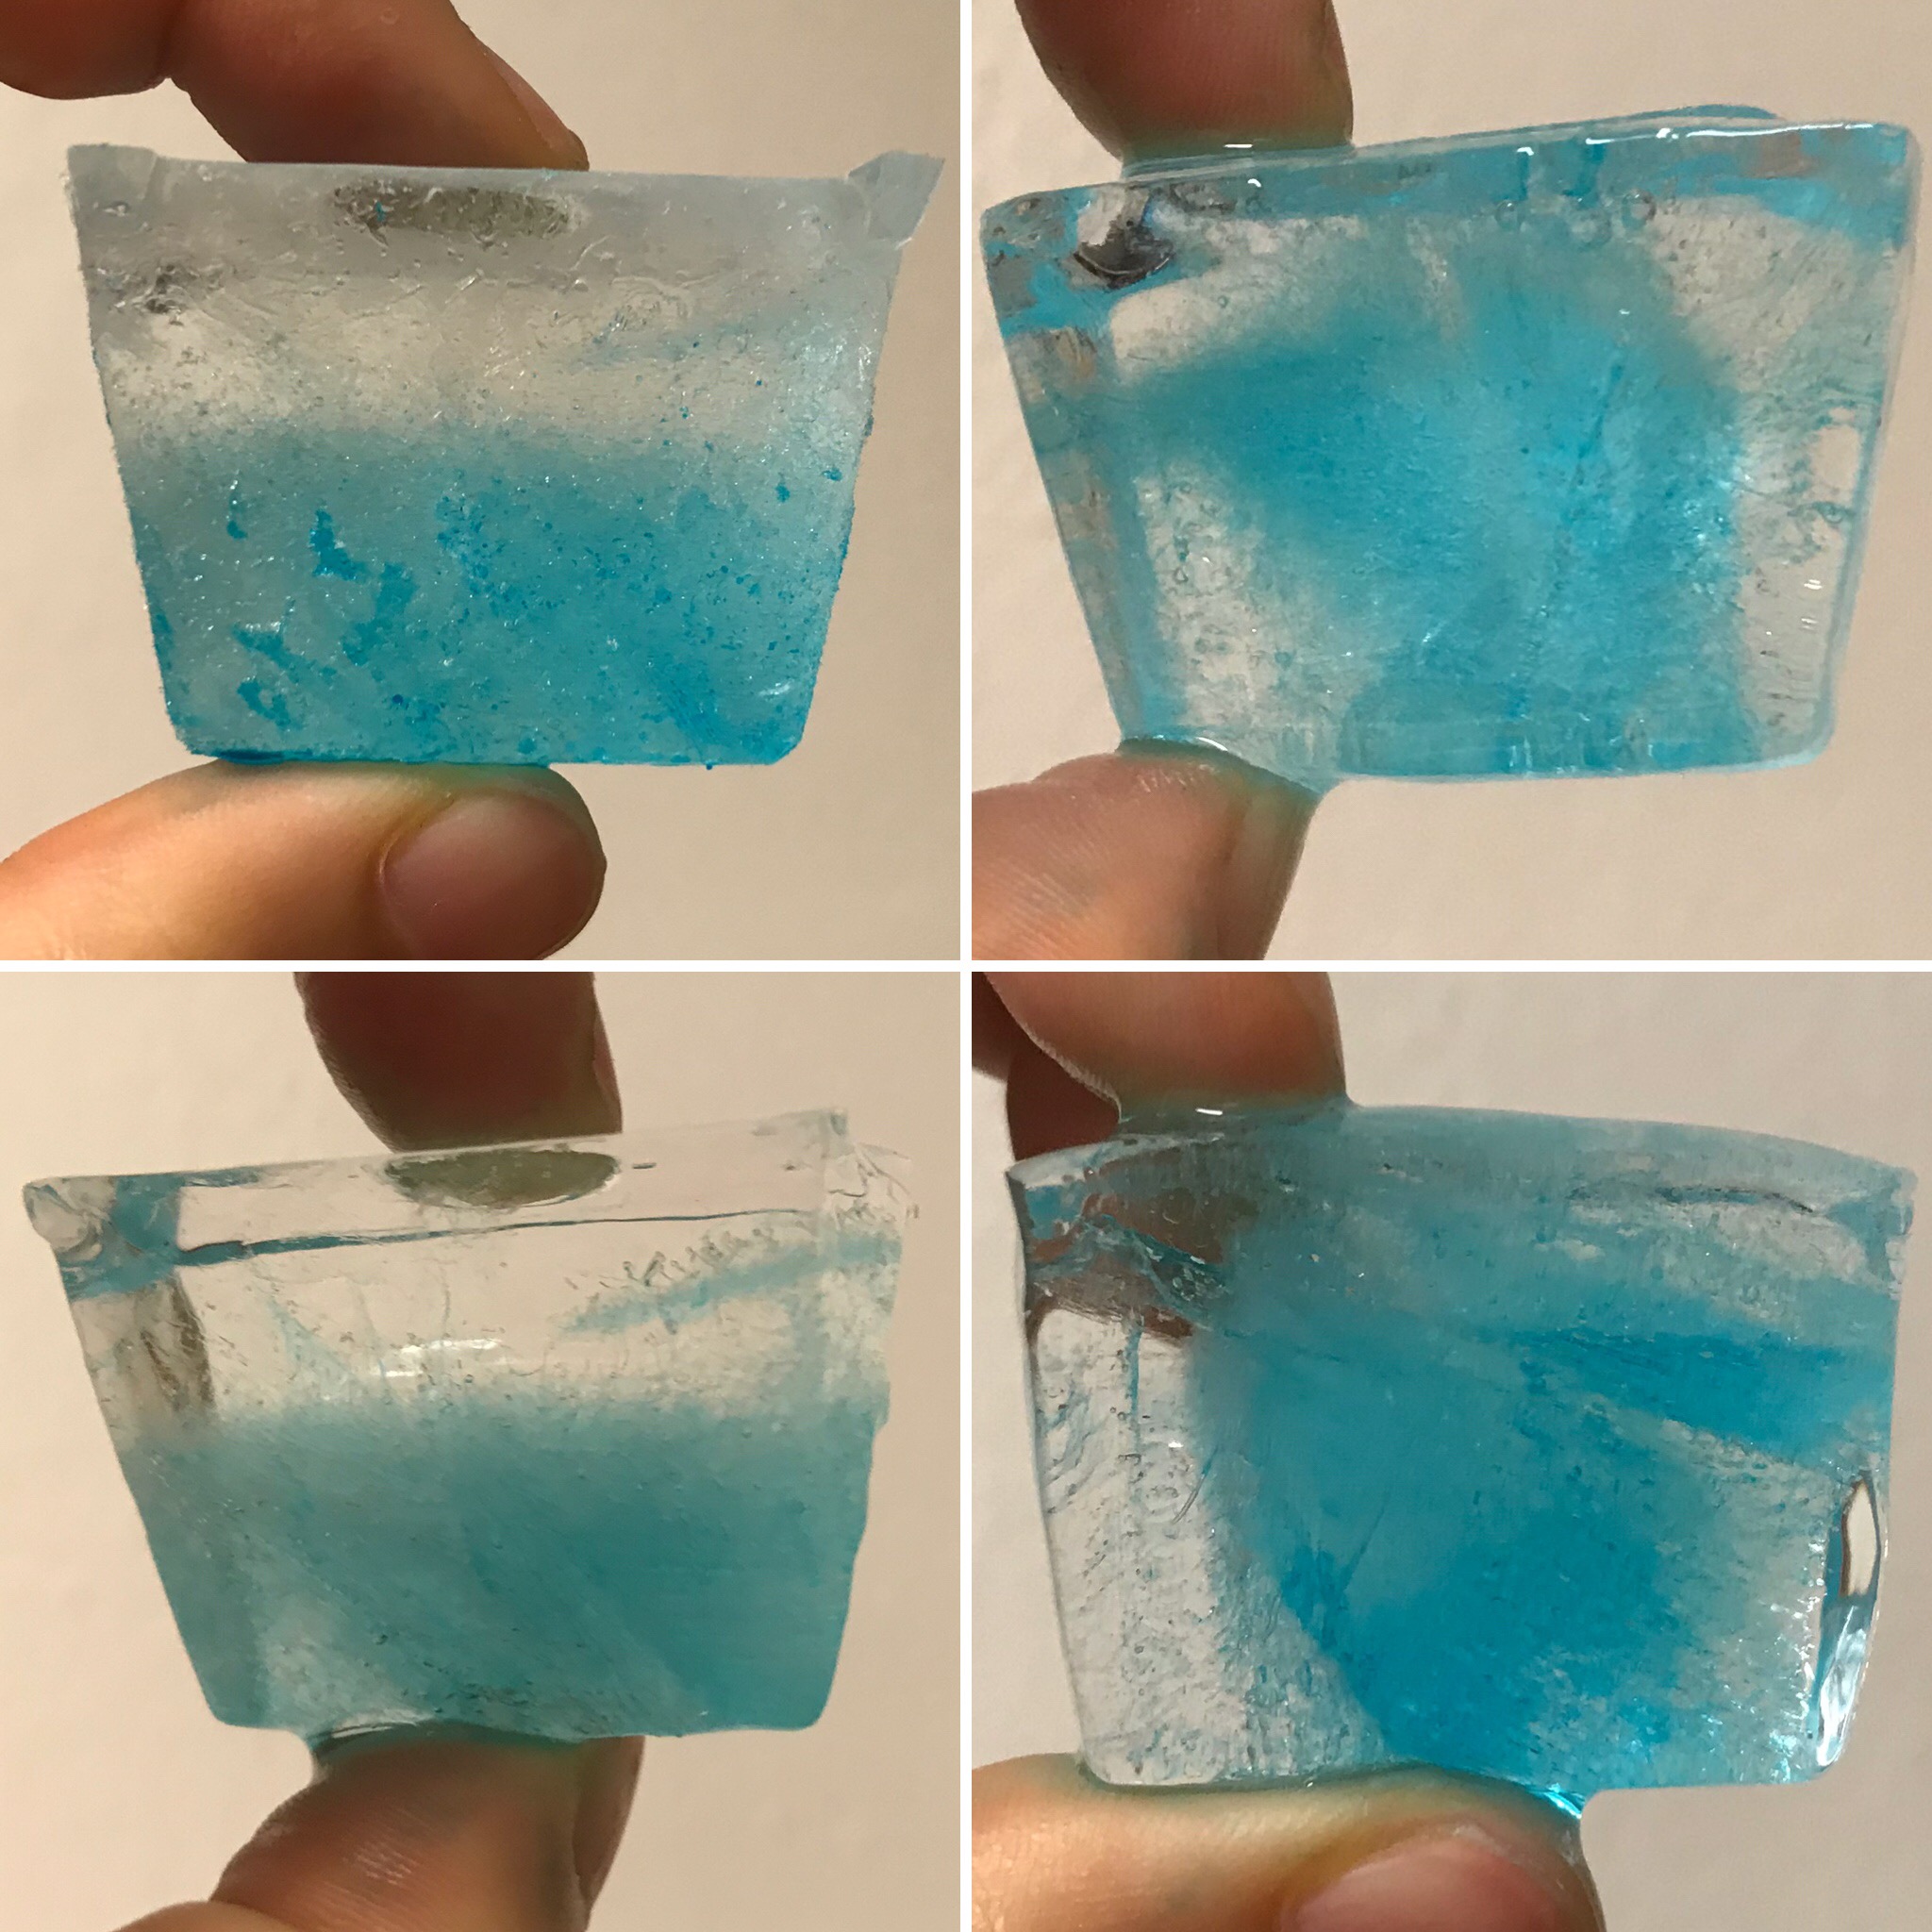
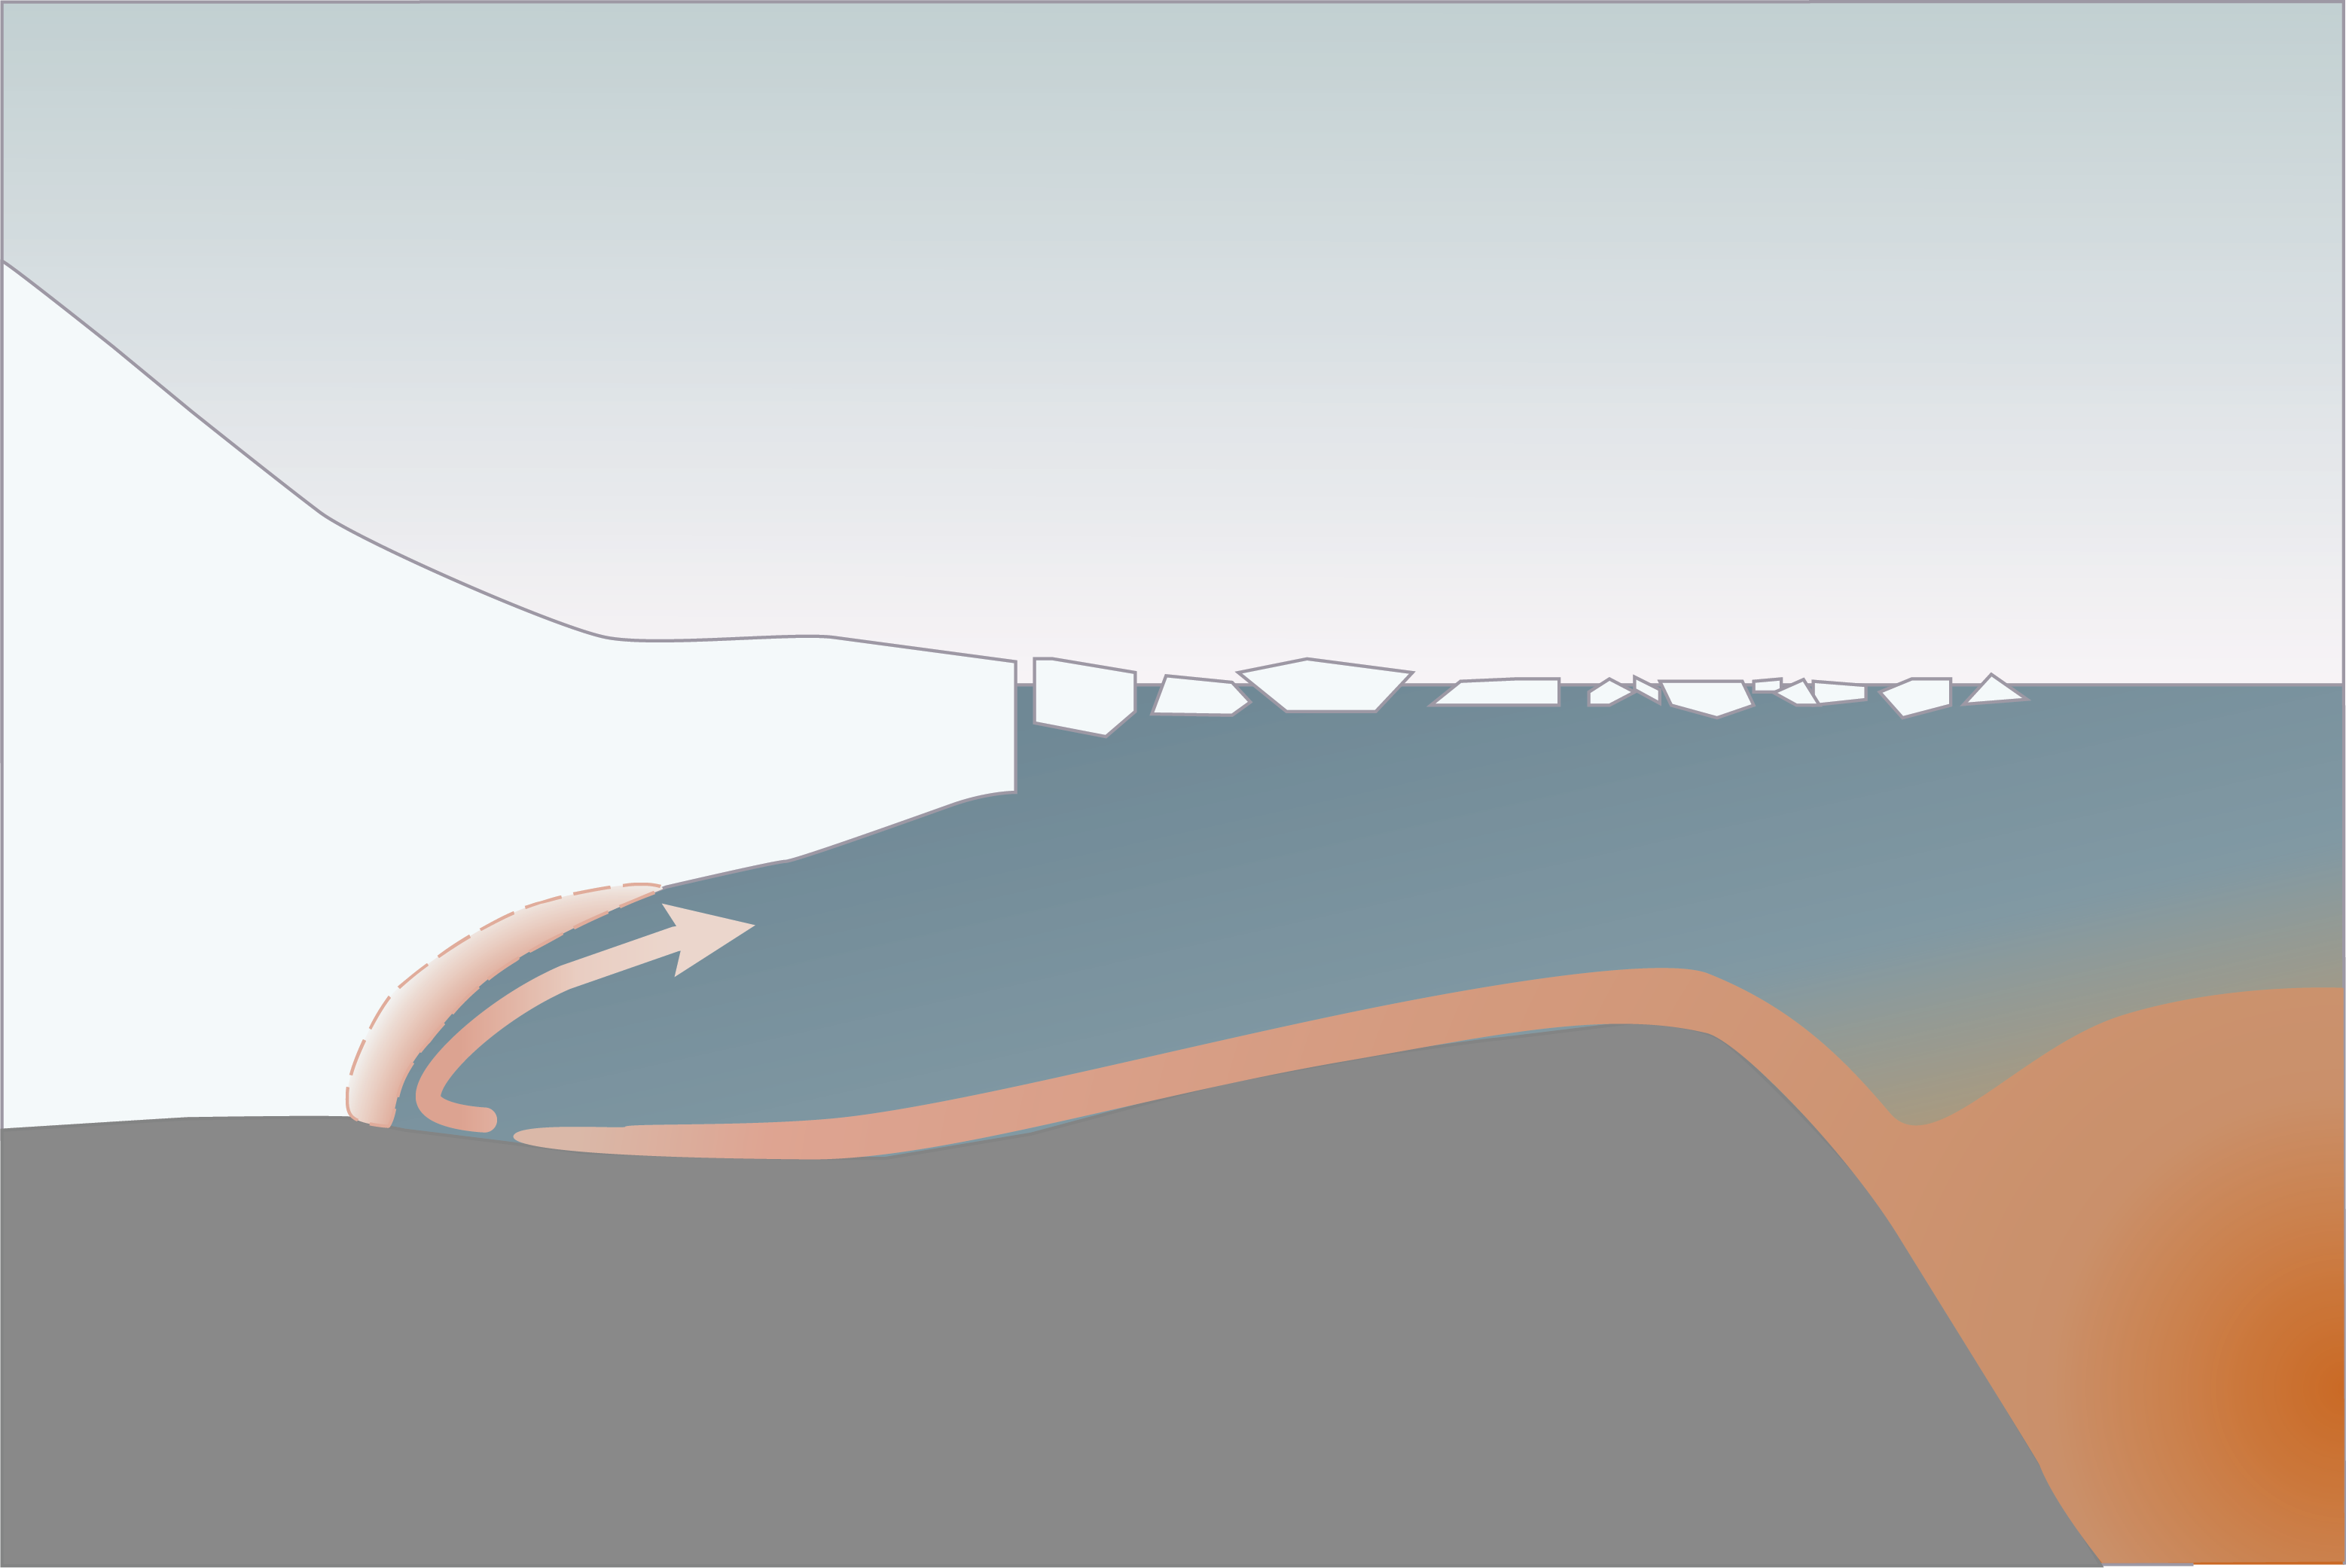
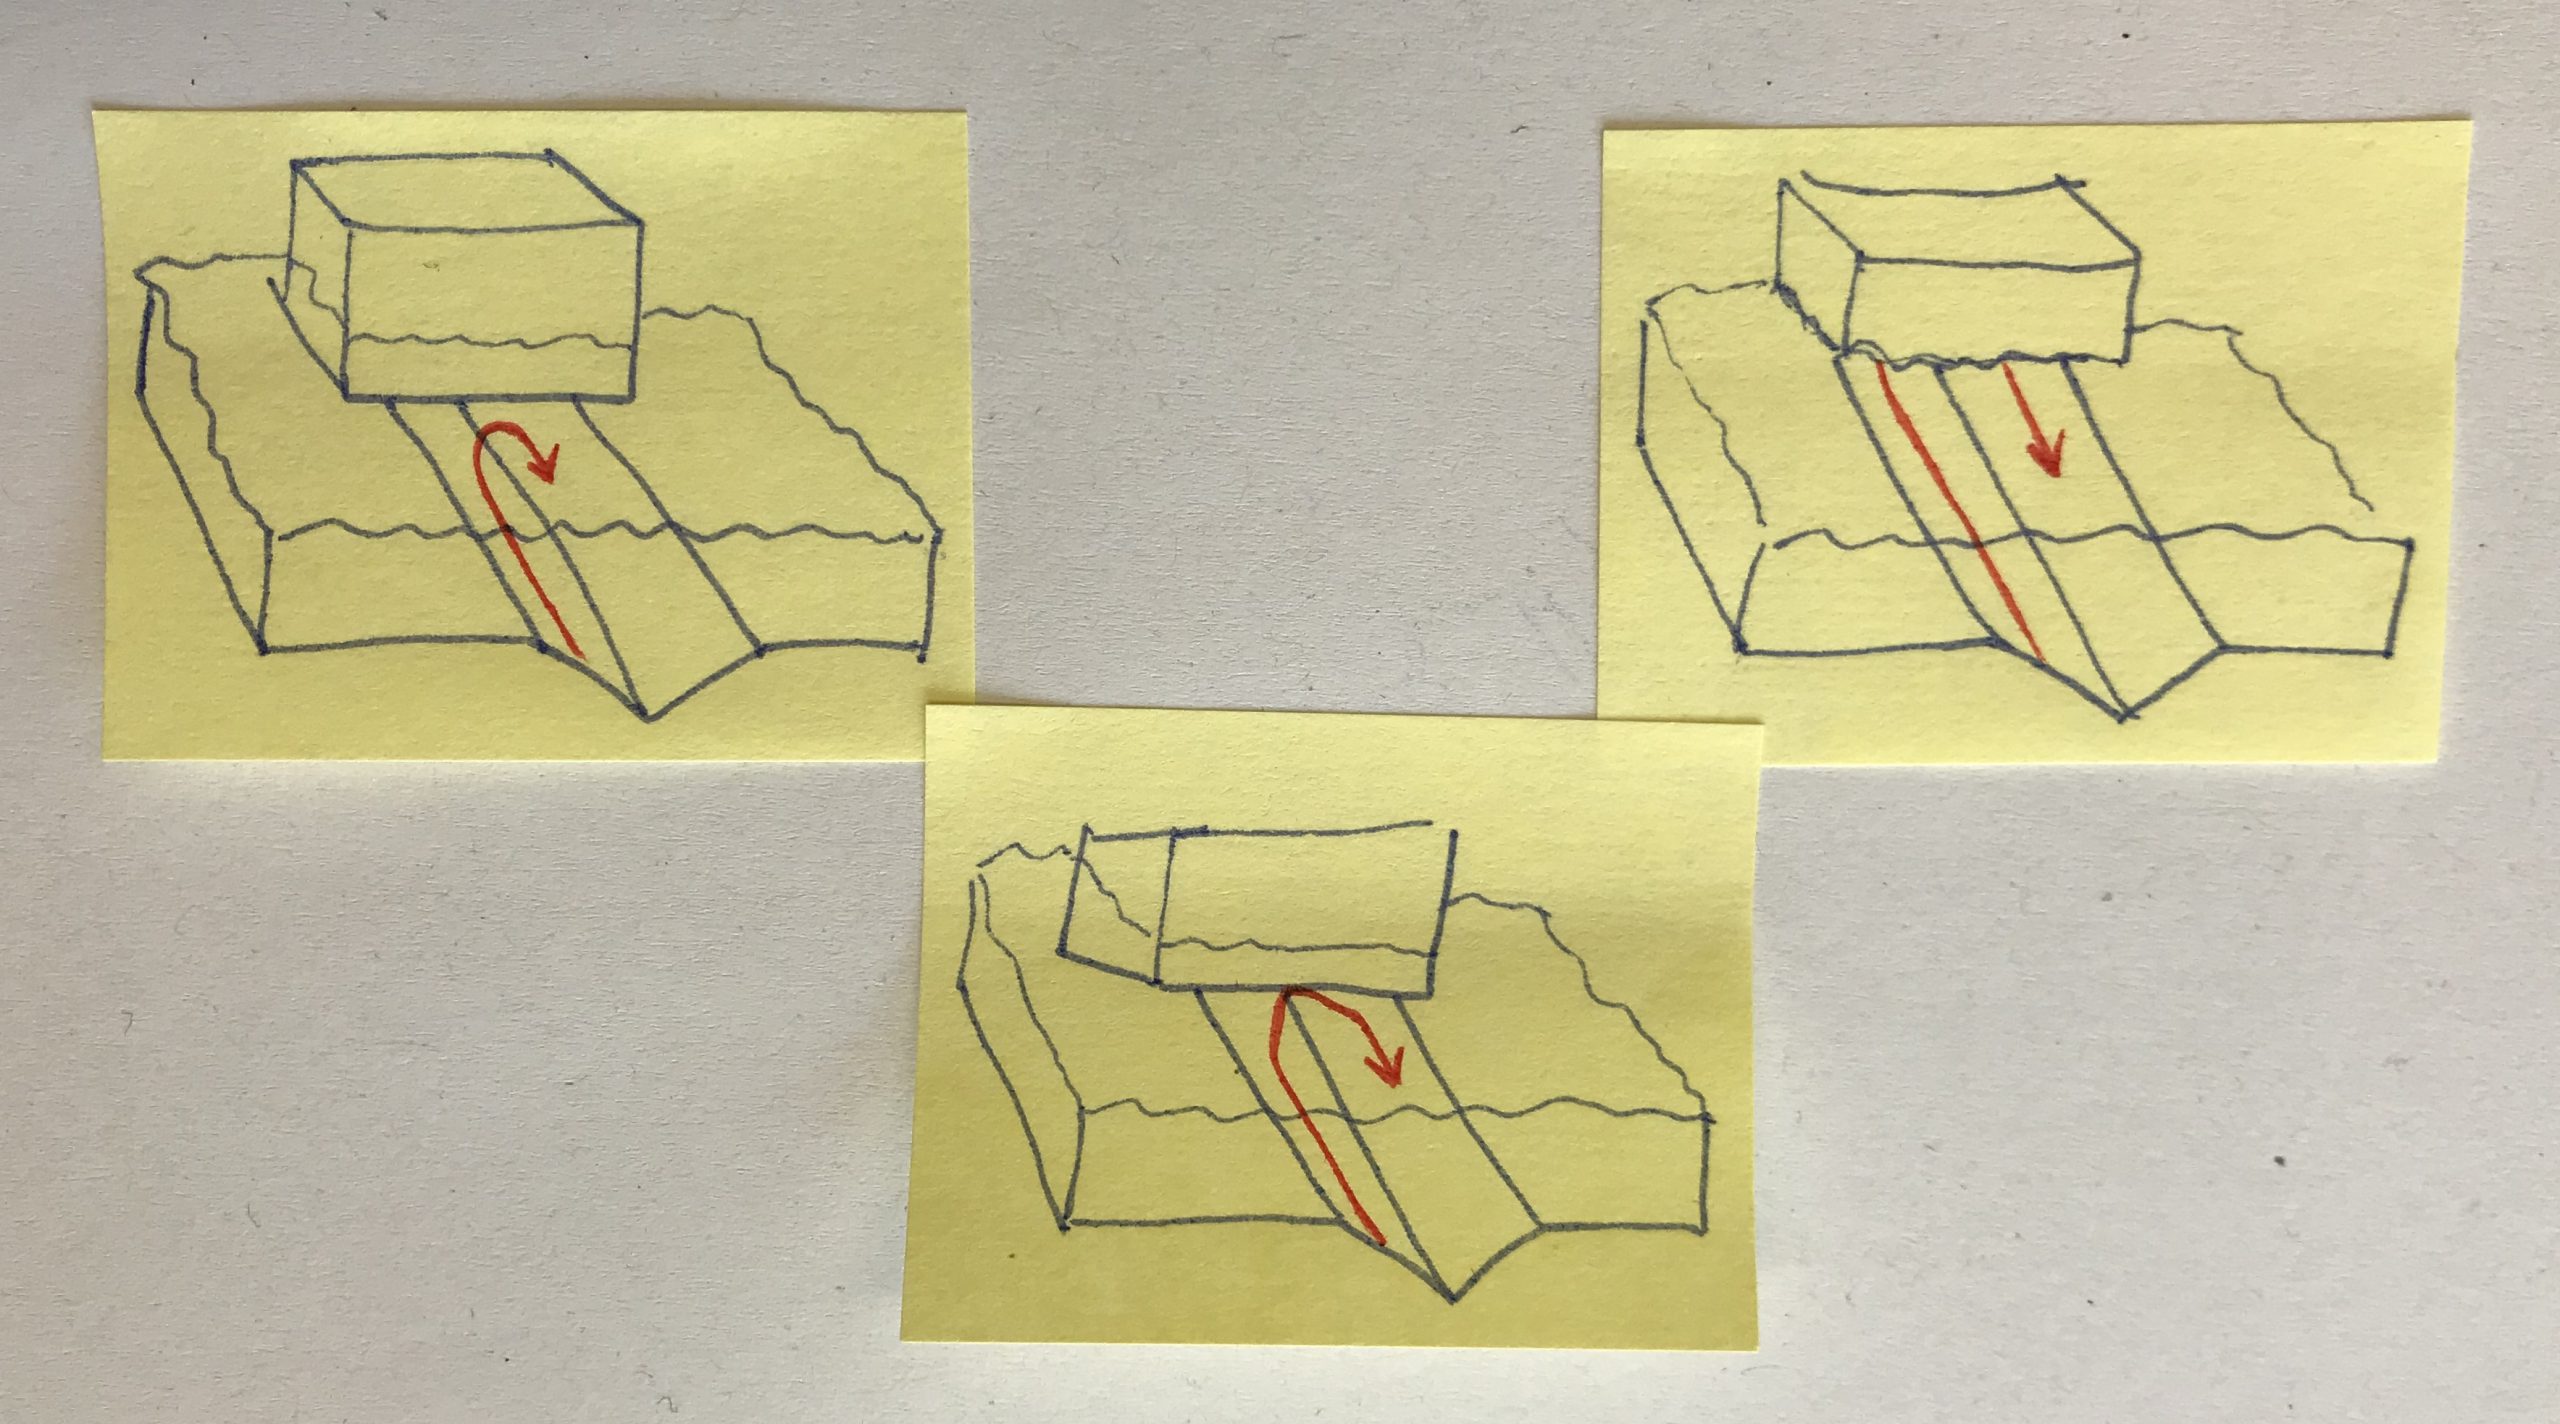
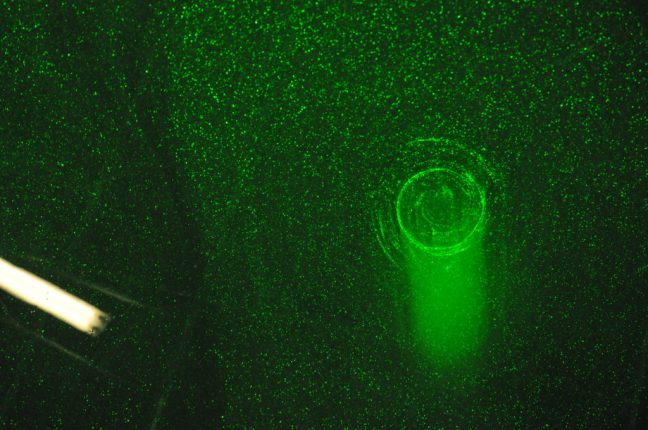
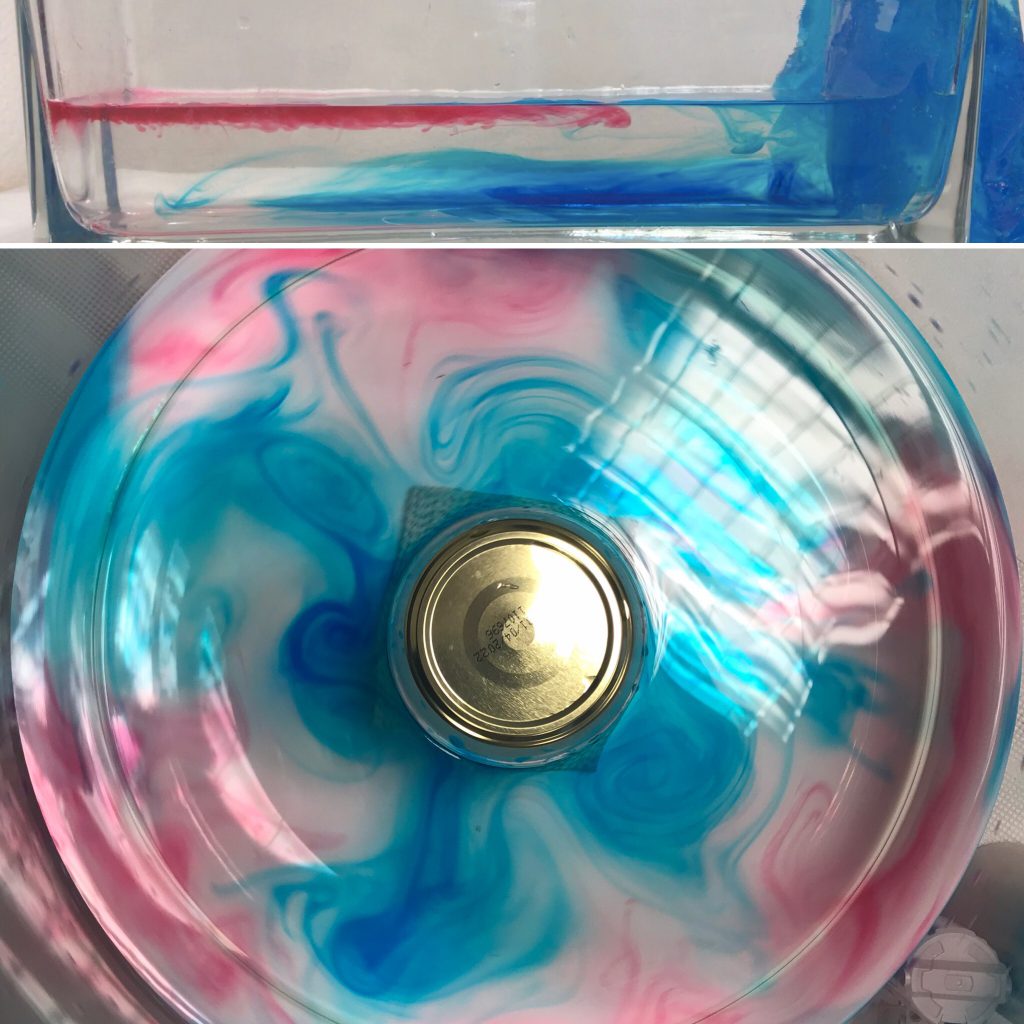
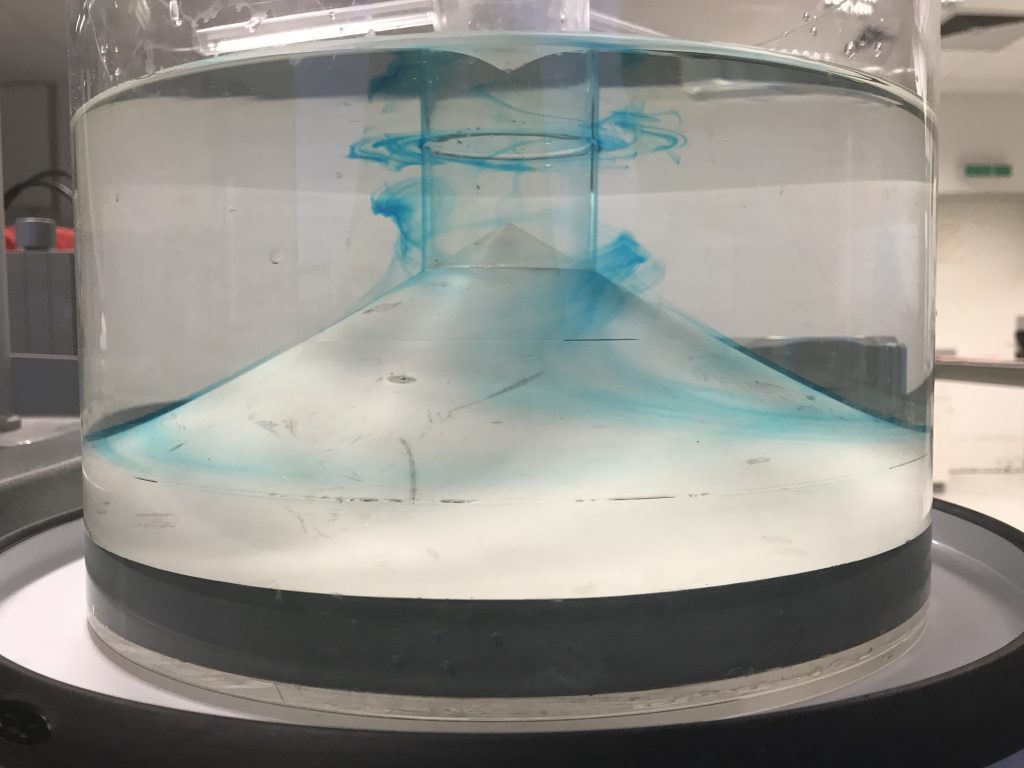
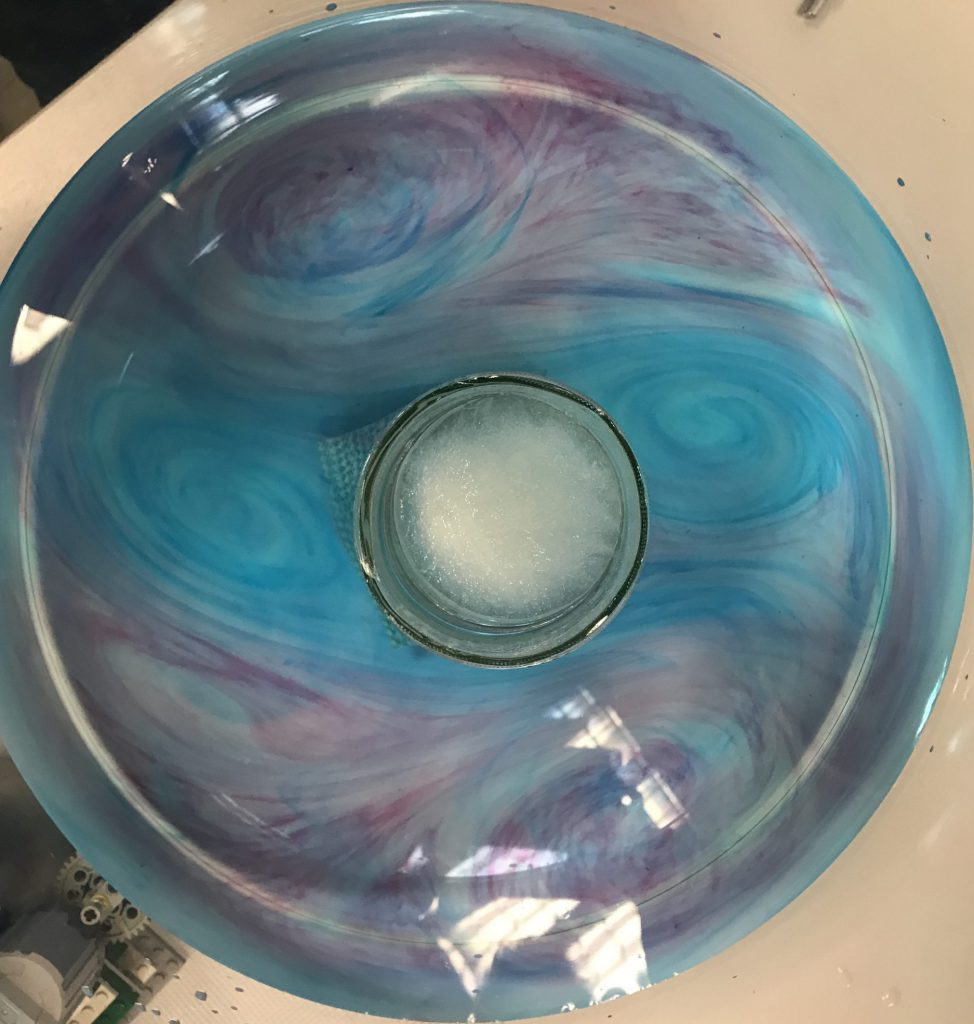
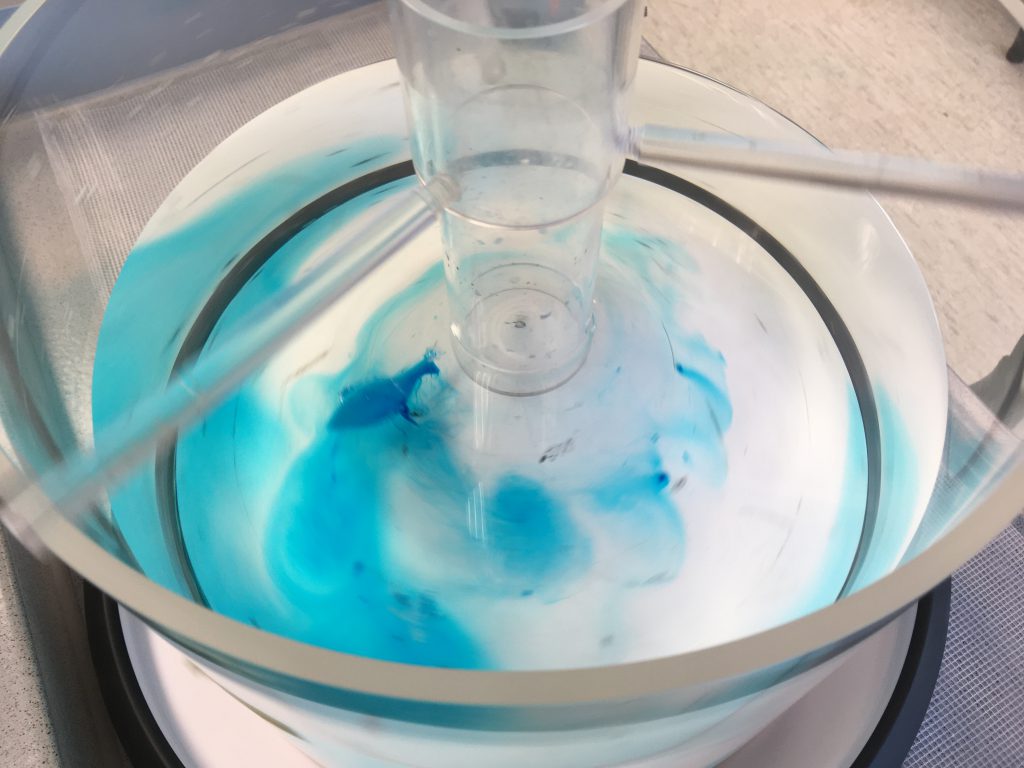
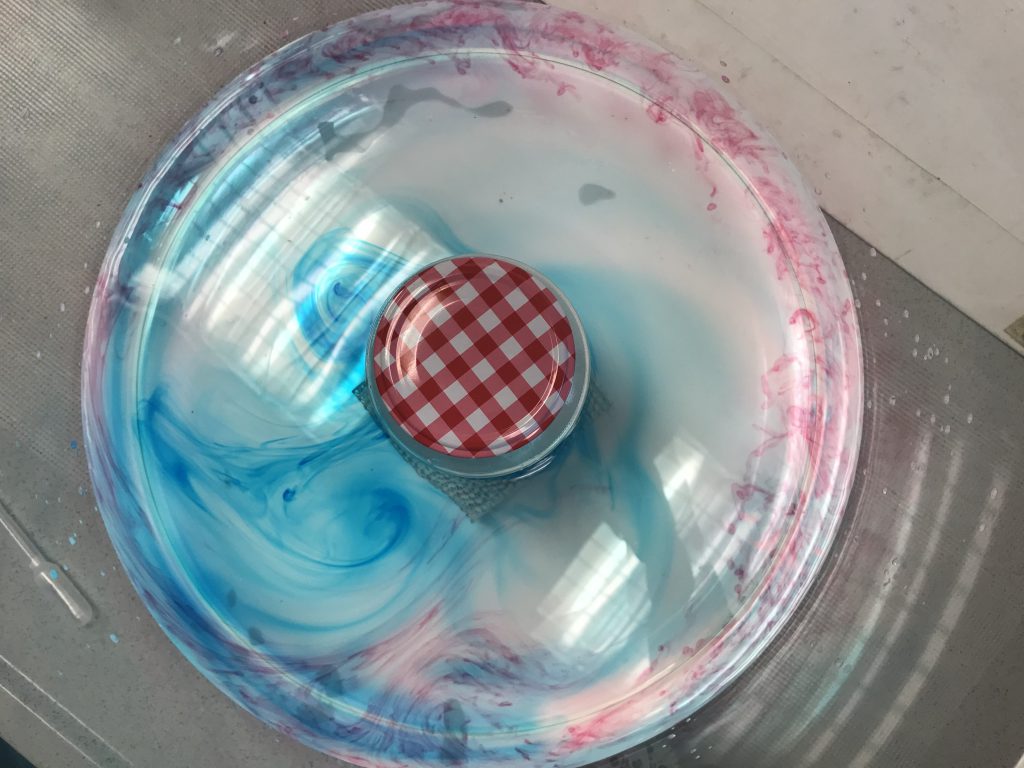
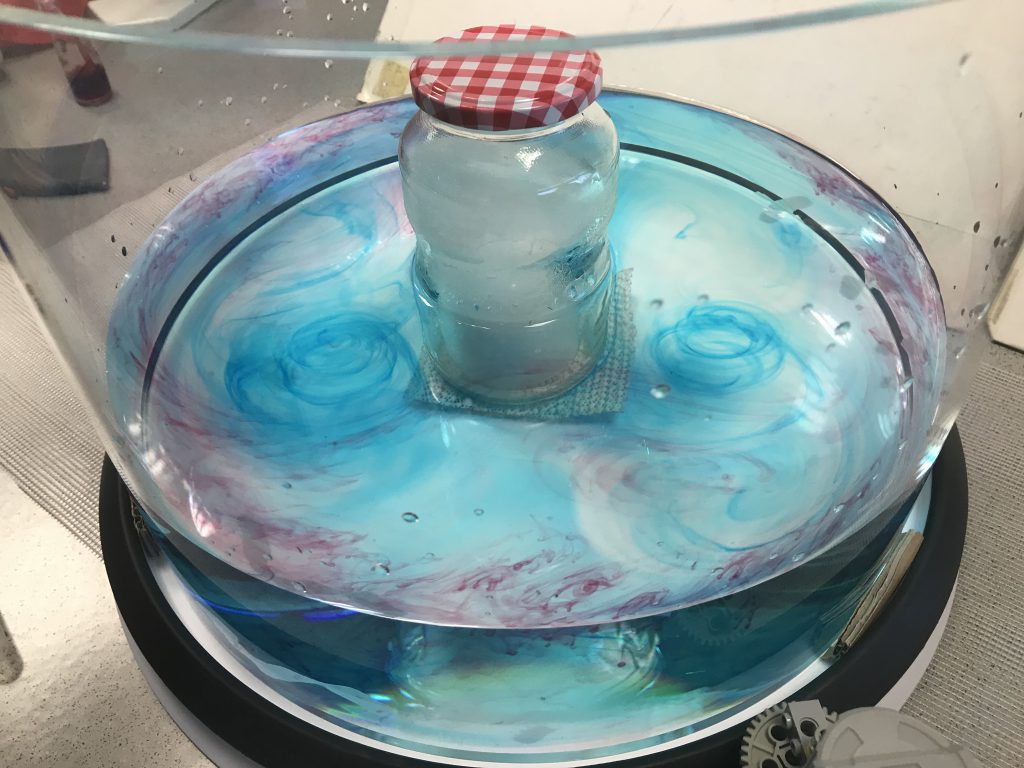
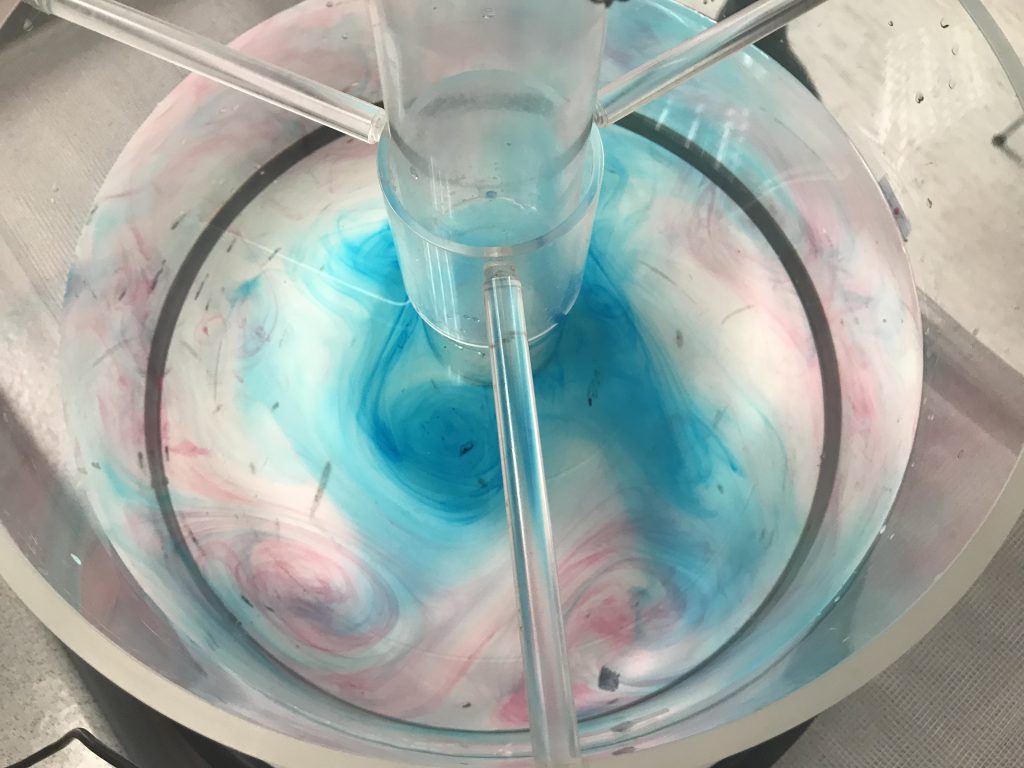
For the planetary Rossby wave experiment, we need a sloping bottom (easiest done in a rectangular tank, but we’ve also run the same experiment on a cone-shaped insert in a cylindrical tank) and a dyed ice cube. When the tank is in solid body rotation, a dyed ice cube is inserted in the shallow “eastern” corner of the tank (make sure it is sitting far enough from the edge of the tank so it can turn around its own axis unobstructed). For more details see this blog post, but in a nutshell: The cold melt water sinks, setting up a column of spinning water that sheds spinning eddies at regular intervals. Eddies and ice cube propagate westwards. This is a really easy and fool-proof experiment, and it looks beautiful!

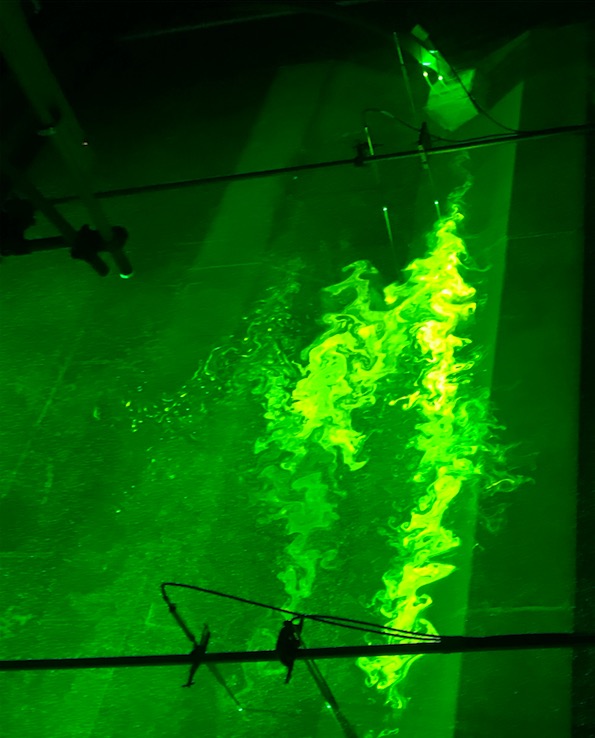
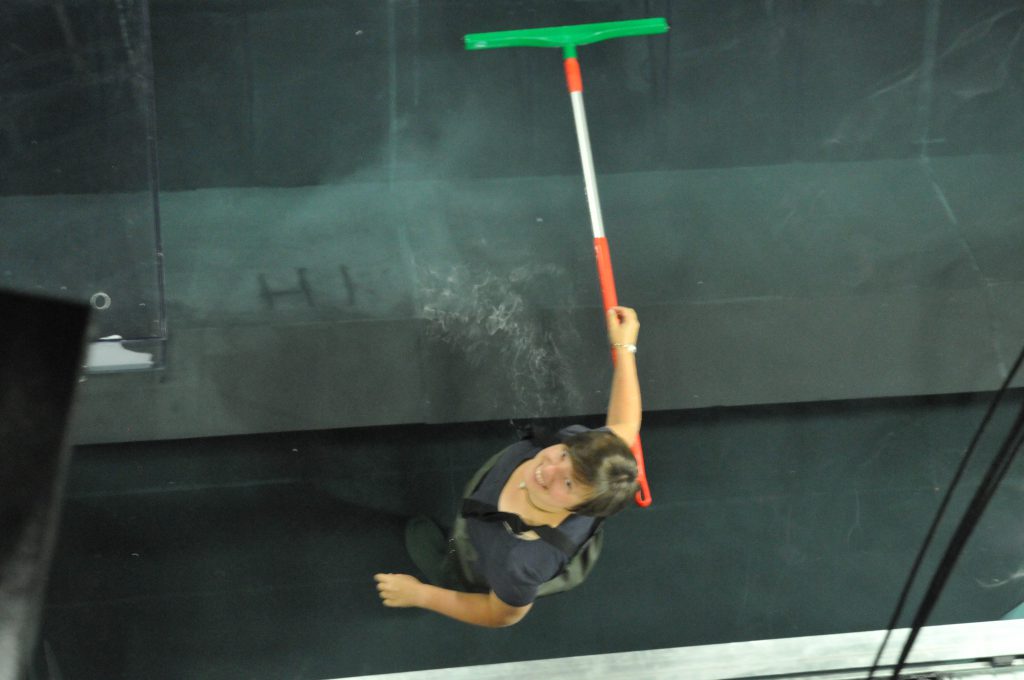
Planetary Rossby waves in a square tank with a sloping bottom.

Presenting the DIYnamics tanks at an institute colloquium

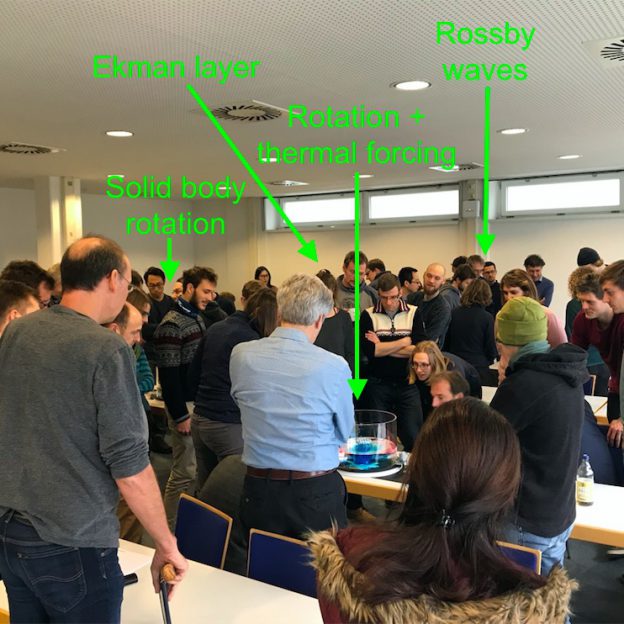
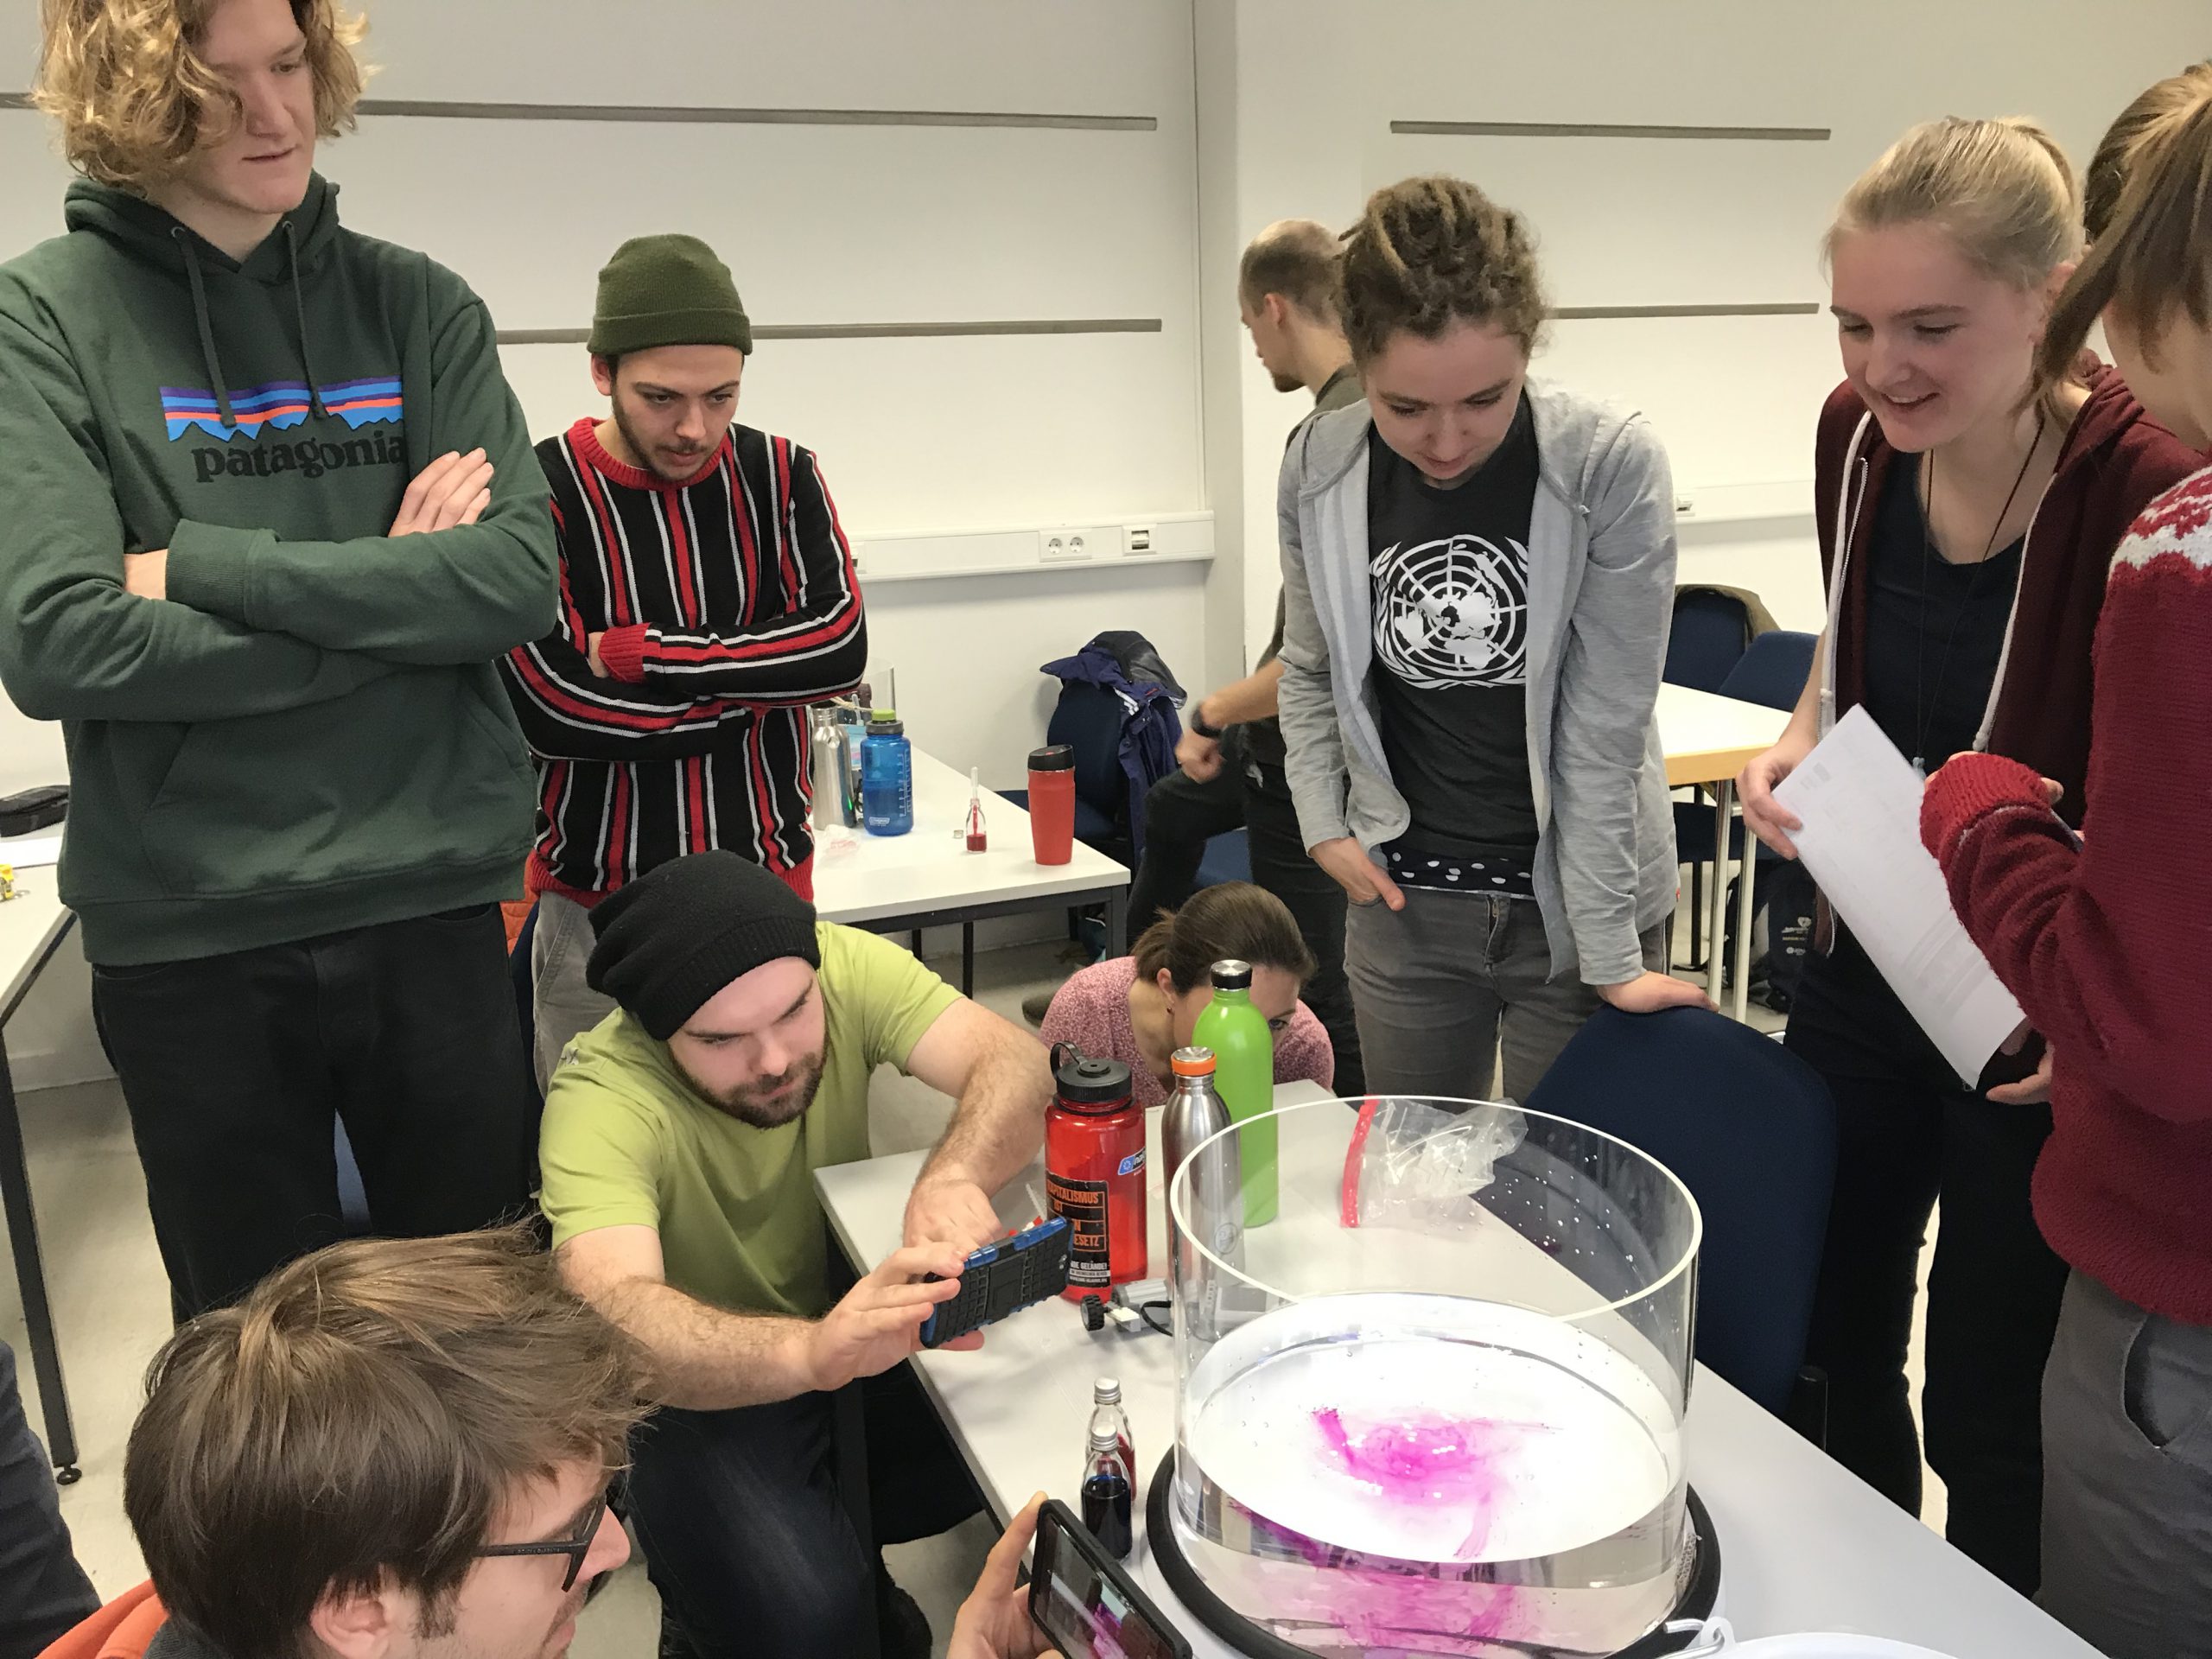
In January, Torge and I gave a seminar presentation titled “you should really play more often! Using tank experiments in teaching” at our institute’s colloquium. In the abstract, we announced that we would give a brief overview over our project and then give people the opportunity to play – which we did. We had been expecting that maybe a handful of our loyal friends would stick around after the presentation to look at the tanks, but we were very surprised and excited to see that pretty much everybody in the audience wanted to stay. We had set up the four rotating tables with four different experiments and a student presenting at each in the back of the room, and we ended up running all the experiments repeatedly, until we were kicked out of the room because the next lecture was about to start. It was really motivating to see how everyone – students, PhD students, postdocs, staff, professors – got really excited and wanted to learn more about the tank experiments, discuss observations, modify and experiment. This goes to show that an affordable rotating table is an amazing tool at every level of education: There is always more to discover!

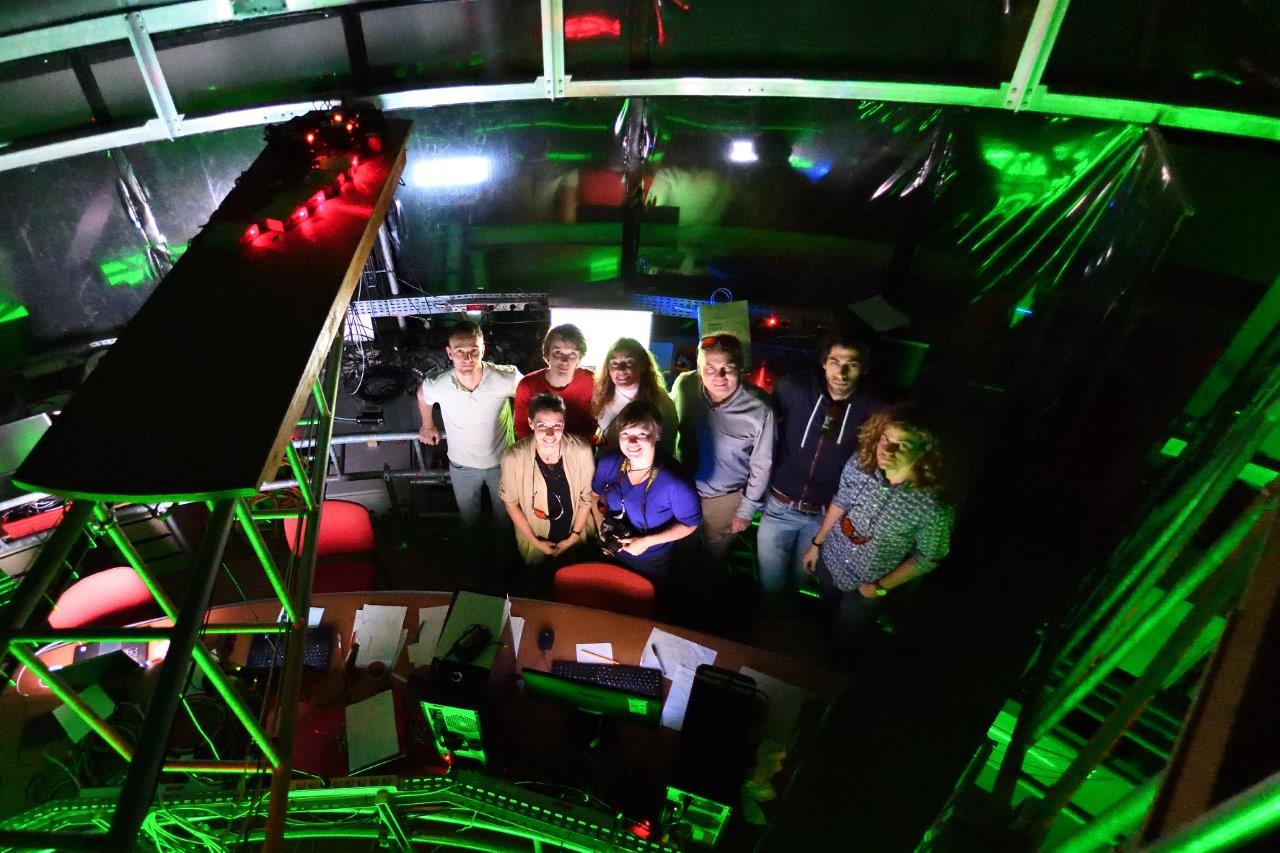
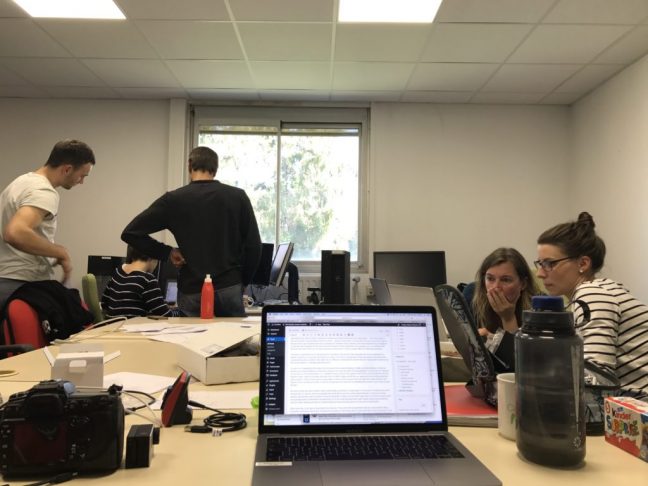
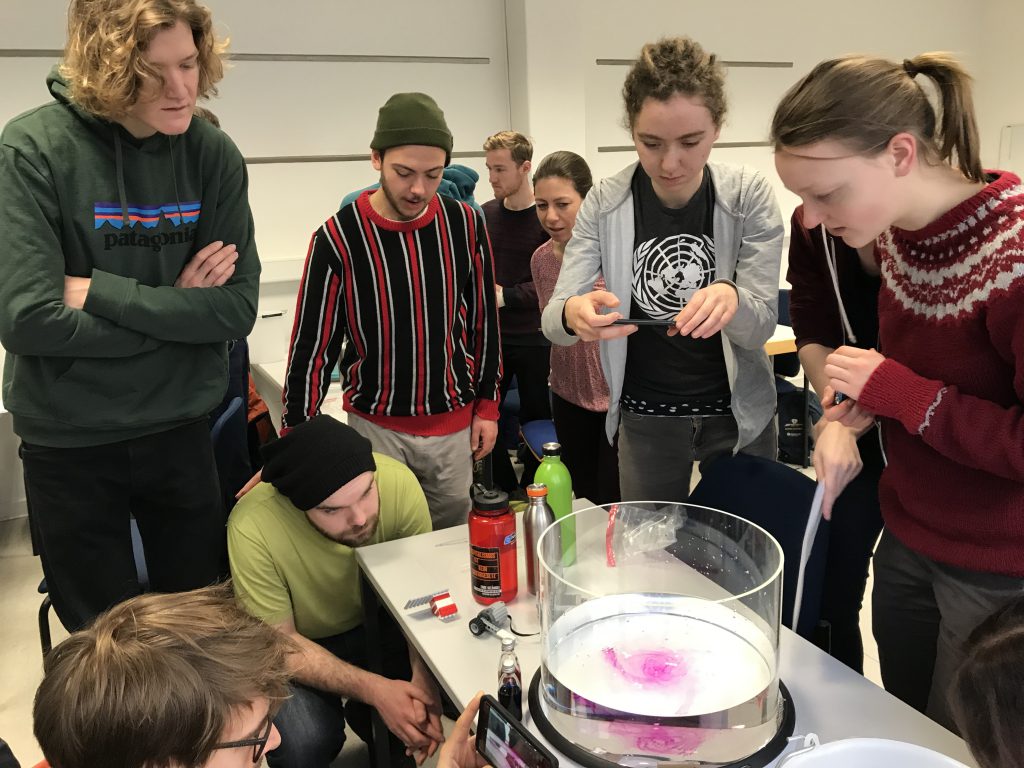
A snapshot of the audience of our seminar presentation interacting with the tanks and each other. We were running four experiments simultaneously.

Follow our experiences

If you want to follow our experiences with the DIYnamics rotating tables, there are several options for you:

Torge and I have recently launched the “Teaching Ocean Science” blog at https://www.oceanblogs.org/teachingoceanscience/, which is a joint effort of ourselves and other instructors, describing fun hands-on stuff they do in their teaching, and students, who write course assignments on what they are currently learning for the blog.

Additionally, all the outgoing links in my guest post above are to posts on my own blog, “Adventures in Teaching and Oceanography”, at https://mirjamglessmer.com/blog. I use that blog as my own archive and document every new thing I try on there, so you might want to sign up for email alerts or follow via my Twitter @meermini.

In addition to writing about the DIYnamics rotating tables and what we are up to with those (and you can be sure that if I played with a tank, you will read it on that blog right away ;-)), I write a lot about#KitchenOceanography (which are very easy hands-on experiments on ocean and climate topics that you can do with household items) and #WaveWatching (observing ocean physics everywhere, all the time). I also write about science communication issues.

Please feel free to check out those blogs and as I wrote in the beginning: Please get in touch if you have any comments or suggestions for us. I am always happy to chat!

(1) This project has been funded by the PerLe fund for innovative teaching through resources from the Federal Ministry of Education and Research, grant number: 01LP17068. The responsibility for the content of this publication lies with the authors.

Our Nature article in 20 tweets

(Not true, there were 22 tweets, but apparently I can’t count! :-D)

For those of you that don’t follow my Twitter, here is what I posted over there the day our Nature paper got published:

Published online in @Nature today: “Ice front blocking of ocean heat transport to an Antarctic ice shelf” by @a_wahlin @nadsteiger @dareliuselin @telemargrete @meermini (Yes! That’s me!!! :-)) @ClnHz @ak_mazur et al.. What is it all about? A thread. 1/x

And here is the link to our Nature article!

The Antarctic ice sheet has been losing mass recently. Ice sheets consist of the “grounded” parts that rest on land or sea floor, and the parts that float on the sea. If the floating part get thinner, the grounded part “flows off” land much more easily (pic by @dareliuselin) 2/x

Floating parts of ice shelves break off&melt. But why are ice sheets thinning? Mainly because of melting from below. We are thus concerned with what controls how much warm(-ish) water is transported across the Antarctic continental shelf towards the ice (Sketch: Kjersti Daae) 3/x

I’m writing “Warm(-ish) water”, because the water is only 1-2°C “warm”, but that’s still warmer than the freezing point. IF this warm(ish) water gets in contact with ice, it will nibble away at it. But that’s a big IF, that we set out to investigate 4/x

From existing data, it seemed that the shoreward heat flux is much larger than what would be needed to cause the observed melting. But this is a heat flux that was measured not right where the melting is happening, but a lot further offshore 5/x

It’s difficult to measure the heat flux right up to the ice shelf, because Antarctica isn’t the friendliest of environments for research ships, gliders, moorings, etc, especially in winter. Cool toys like floats, or CTDs on seals give a lot of data, but not enough yet 5/x

But @a_wahlin, @dareliuselin & team put moorings closer to the ice shelf than ever before, the closest one of three only 700m from the ice shelf front. There was absolutely no guarantee that the moorings would survive (Pic by @a_wahlin showing @dareliuselin) 6/x

Luckily, despite being threatened by storms, ice bergs etc, the moorings recorded for two years, right next to the ice shelf, giving us better estimates of heat fluxes than were available ever before 7/x

While the moorings were out in Antarctica, we went to LEGI in Grenoble and worked on the Coriolis rotating platform, basically a 13-m diameter swimming pool on a merry-go-round. SO EXCITING! (Pic by Nadine Steiger) 8/x

It’s really an amazing experience to sit in an office above a swimming pool when both are rotating together. As long as it’s dark outside the tent that covers both, you don’t really notice movement. But when the light comes on it’s very easy to get dizzy! (Pic Samuel Viboud) 9/x

We were not playing on the merry-go-round for two months just for fun, though. Rotating the large water tank is important to correctly represent the influence of Earth’s rotation on ocean currents, which is very important for this research question 10/x

In the rotating platform, we built a plastic “ice shelf” that was mounted at the end of a v-shaped plastic “canyon”. We could set up a current and then modify parameters to investigate their influence on the transport towards and underneath the ice shelf (Pic @a_wahlin) 11/x

If you are interested to read a lot more about this (also about how parts of the team went for a swim in the rotating tank, and about how sick you can get when sitting on a merry-go-round all day every day for weeks), check out @dareliuselin’s blog 12/x

Link to Elin’s blog!

In a nutshell: We put particles in the water and lit them, layer by layer, with lasers. We took pictures of where the particles in each layer were, and with the “particle image velocimetry” (PIV) technique, we got a 3D map of particle distributions over time 13/x

And what we found both from the data that we got from the moorings in Antarctica, that we were lucky enough to recover, as well as from the tank experiments at the rotating platform was really interesting: Ice front blocking of ocean heat transport to the Antarctic ice shelf14/x

The ice shelf, at its most offshore part, still reaches down to 250-500m. That means that the depth of the water column changes drastically at the front of the ice shelf. And that has important consequences for depth-independent part of the current 15/x

The barotropic, i.e. depth-independent part of the current is blocked by the step shape of the ice front (as well as the plastic front in the tank). Only the baroclinic (depth-varying) part can flow below the ice, but that part is much smaller 16/x

In the tank we changed the shape of the ice front to see that it’s really the large step that blocks the current. Other configurations lead to different flow pattern. But the large step shape is what the Getz Ice Shelf system looks like, and other systems, too 17/x

What that means is that looking at the density structure of the water column, thus the relative magnitude of barotropic and baroclinic components of the current, is a better indicator of ice shelf melting than the heat transport onto the continental shelf 18/x

It also shows the importance of accurately representing the step of the ice shelf front accurately in models in order to simulate the heat transport towards the ice as well as the melting of the ice shelves 19/x

TL;DR: Article published @Nature on ice front blocking of ocean heat transport to an Antarctic ice shelf, and I contributed to the exciting study and feel so honored to have been part of this amazing project with @a_wahlin, @dareliuselin, @clnhz et al. (Pic Samuel Viboud) 20/x

Playing in a 13-m-diameter pool on a merry-go-round results in Nature article

A long, long time ago (ok, in fall of 2017) I got the chance to join Elin Darelius and Anna Wåhlin’s team for a measuring campaign at the Coriolis platform in Grenoble for several weeks. I was there officially in an outreach officer-like role: To write and tweet about the experiments, conduct “ask me anything” events, write guest posts newsletters and websites, etc.. A lot of my work from that time is documented on Elin’s blog, that I blogged on almost daily during those periods. And we had so many amazing pictures to share (mostly green, that’s because of the lasers we used).

Turbulence in a rotating system is 2D, therefore the whole water column is rotating in this eddy that we accidentally made when moving parts of the structure in the tank

But I was extremely lucky: Neither Elin nor Anna nor anyone else on the team saw me as “just the outreach person”, which is a role that outreach people are sadly sometimes pushed in. Instead, they knew me as an oceanographer and that’s how I was integrated in the team: We discussed experiments all the way from the setup in an empty tank (below you see Elin with her “Antarctica”)

No matter how carefully you planned your experiments, once you start actually conducting them, there is always something that doesn’t work quite the way you imagined. But since time in facilities like the Coriolis platform is limited, it is hugely important to think on your feet, come up with ideas quickly, and fix things. Which is the part of science that I enjoy the most: Being confronted with a problem “in the field” and having to fix it right then and there, using whatever limited equipment and information you have available.

Speaking of “limited information”: Sometimes you have to make educated guesses about what’s in the data you are currently collecting in order to make decisions on how to proceed, without being able to know for sure what’s in the data. We took tons of pictures and videos and obviously also observed by eye what was happening in the tank, but in the end, the “real” data collection was happening with images that we couldn’t analyse on the spot (and that’s what the research part is about that took place in between fall of 2017 and now: many many hours of computing and analysing and discussing and rinse and repeat).

Grenoble was also an amazing experience just because of the sheer size of the Coriolis platform. Below you see the operations room, an office that is built above the tank and rotates with it. And let me tell you, being on a merry-go-round all day long isn’t for everybody!

I really also enjoy the hands-on work. Below is me in waders in the 13-m-diameter rotating pool (while it’s rotating, of course), using a broom to sweep up “neutrally buoyant” particles that we use to track the flow that over night settled on the topography (so much for “neutrally buoyant”, but close enough). Sometimes it comes in handy to be an early bird and doing this work before everybody else gets up, so the tank has the chance to settle into solid body rotation again before experiments start for the day.

Here you see the layer of particles in different stages of disturbance, and me having fun with it (it might not be obvious from the picture, but I’m standing in waist-deep water there)

But then we weren’t playing all day long for weeks. There were times of intense discussions of preliminary results. Exciting times! And of course, those discussions only intensified when all the data was in and could be analysed in more depth.

I loved being part of the whole process and contributing to this exciting publication now!

Giving it a side eye: Why we use high-walled tanks on our rotating table #FlumeFriday

Inspired by a recent twitter comment on how our tanks are higher-walled than those usually used on the DIYnamics rotating tables, today I’ll talk about why we went for those.

Full disclosure: Mainly for practical reasons (see below). BUT: having high-walled tanks is really helpful for many experiments because they make it a lot easier to observe the vertical dimension. Even though oceanic flows are largely 2D and thus a shallow tank should be enough (and it is for many purposes!), if you look at representations of sections of oceanic properties, the vertical dimension is always stretched to make the important 3D features visible. That’s basically what we are doing here, too: In order to make the point that rotating flows are largely 3D, we blow up the vertical dimension so people can actually observe that claim. Plus then there are all those cases where rotating flow actually isn’t 2D!

For which experiments might a high-walled tank (or a higher water level) be helpful?

For example the Ekman layer experiment. If you want to see the bottom boundary layer thicken over time as friction propagates upwards through the water column, you need to look at it from the side and over a certain period of time, so the water needs to be deep enough to be able to see parts of the water column that are already affected by friction, and then the upper part that isn’t and that’s still in solid body rotation.

Or if you want to observe the difference between rotating and non-rotating fluids, the extra height helps to show that rotating fluids are 2D whereas non-rotating fluids are 3D. So just to make it easier to observe that structures are really 2D, it helps to stretch the vertical axis.

For example of thermal forcing in rotating and non-rotating cases (And yes, I see the irony that i am showing a top-view of the rotating case. But observing by eye and taking pictures in which you can actually see what you saw by eye are two very different things).

Or non-rotating vs rotating turbulence (check out the movie in the linked blog post; makes it much clearer than the picture below).

Or those cases of rotating fluid dynamics where we force the flow to become 3D by mean tricks like slow rotation on a sloping bottom

In reality, there were other reasons, too: Firstly, we couldn’t find cheap options that matched all our requirements (We wanted something that had a diameter close to the maximum that we could fit on our rotating tables, that was cylindrical, had a flat bottom, had clear walls and would be robust enough to use with students).

Secondly, I own a glass vase with a similarly high walls that we used as tank on our prototype of the rotating table. I still use it at home, but we didn’t want to go with glass for the tanks we use all the time with students & for outreach, for obvious reasons. But since we were happy with the dimensions of the vase, we just went with it. Never change a running system, right?

And a practical reason: Emptying a high-walled tank by carrying it to a sink and throwing out the water there is much less likely to make a mess than emptying a lower-walled tank with the same water height in it. Waves created by moving the tank is all I am saying…

And also I think observing vertical structures develop in fluids is always fun! :-)

Playing for #FlumeFriday

Yesterday, we’ve had four rotating tables operating simultaneously, for three different experiments. The one that everybody is gathering around in the picture above is our favourite experiment: a slowly rotating tank with cooling in the middle that shows a nice 2D circulation instead of an overturning as we would expect in a non-rotating system.

A second group was doing an Ekman spiral experiment similar to this one.

If you are interested in observing the bottom boundary layer of a tank, it might look a bit weird to people who don’t know what you are up to…

And the other two experiments were the planetary Rossby wave experiments that I’ve written about so much before that it doesn’t really matter that I didn’t take any pictures this time round.

Rotating tank experiments on a cone

I had so much fun playing with rotating tank experiments on a cone this afternoon! And with Torge Martin (who I have the awesome #DryTheory2JuicyReality project with) and Rolf Käse (who got me into tank experiments with an amazing lab course back in 2004, that I still fondly remember). We tried so many different things, that I will at some point have to describe in detail, but for now I just need to share the excitement ;-)

Here, for example, a blue fish-shaped ice cube. This experiment is pretty much the topographic Rossby wave experiment described here, except now we aren’t on an inclined plane, but on a cone. Which is basically an infinitely long inclined plane — the ice cube doesn’t encounter a boundary as it travels west, it just goes round and round the tank until it melts. And look at the cool Rossby waves!

Then we did another one of our favourite experiments, the Hadley cell circulation. What was really fascinating to observe was how turbulence the turbulence that was introduced by dripping dye into the tank changed scales. At first, we had the typical 3D pattern with plumes shooting down. But over time, the pattern became more and more organized, larger, and 2D. See below: The blue dye had been in the tank for a little longer than the red dye, so the structures look completely different. But interesting to keep that in mind when interpreting structures we observe!

Here is another view of the same experiment. Since we are cooling in the middle and rotating very slowly (about 3 rotations per minute), the eddy structures aren’t completely 2D, but they are influenced by an overturning component.

This looks even cooler when done on a cone. Can you see how there is both an overturning component (i.e. the plumes running down the slope) and then still a strong column in the middle?

This just looks so incredibly beautiful!

And one last look on the eddies that develop. We saw that there are cyclonic eddies happening in the center of the tank and anti-cyclonic eddies at the edge. Since we are on a cone, I could imagine that it’s just due to conservation of vorticity. Stuff that develops near the center and moves down the slope needs to spin cyclonically since the columns are being stretched, and on the other hand things that develop near the edge must move up the slope, thus columns being compressed. What do you think? What would be your explanation?