Experiment: Double-diffusive mixing (salt fingering)

On the coolest process in oceanography.

My favorite oceanographic process, as all of my students and many of my acquaintances know, is double-diffusive mixing. Look at how awesome it is:

Double-diffusive mixing happens because heat and salt’s molecular diffusion are very different: Heat diffuses about a factor 100 faster than salt. This can lead to curious phenomena: Bodies of water with a stable stratification in density will start to mix much more efficiently than one would have thought.

In the specific case of a stable density stratification with warm, salty water over cold, fresh water, finger-like structures form. Those structures are called “salt fingers”, the process is “salt fingering”.
IMG_4233_sehr_klein

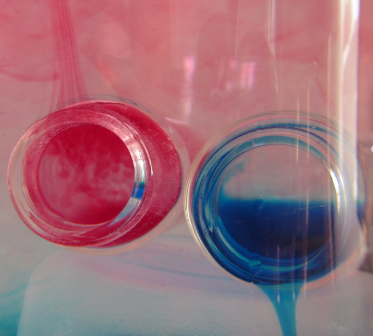
Salt fingering occuring with the red food dye acting as “salt”.

Even though salt fingers are tiny compared to the dimensions of the ocean, they still have a measurable effect on the oceanic stratification in the form of large-scale layers and stair cases, and not only the stratification in temperature and salinity, but also on nutrient availability in the subtropical gyres, for example, or on CO2 drawdown.

Over the next couple of posts, I will focus on double diffusive mixing, but less on the science and more on how it can be used in teaching. (If you want to know more about the science, there are tons of interesting papers around, for example my very first paper)

How to easily set up the stratification for the salt fingering process.

Setting up stratifications in tanks is a pain. Of course there are sophisticated methods, but when you want to just quickly set something up in class (or in your own kitchen) you don’t necessarily want to go through the whole hassle of a proper lab setup.

For double diffusive mixing, there are several methods out there that people routinely use.

For example the hose-and-funnel technique, where the less dense fluid is filled in the tank first and then the denser fluid is slid underneath with the help of a hose and a funnel. And a diffuser at the end of the hose. And careful pouring. And usually a lot more mixing than desired.

Or the plastic-wrap-to-prevent-mixing technique, where the dense fluid is put into the tank, covered by plastic wrap, and then the lighter fluid is poured on top. Then the plastic wrap is removed and by doing so the stratification is being destroyed. (No video because I was frustrated and deleted it right away)

Or some other techniques that I tried and didn’t find too impressive. (No videos either for the same reason as above)

But then accidentally I came across this method (as in: I wanted to show something completely different, but then I saw the salt fingers and was hooked):

Granted, this is not a realistic model of an oceanic stratification. But as you can see towards the end of that movie, that turns out to be a blessing in disguise if you want to talk about the process in detail. As you see in the movie, the salt fingers inside the bottle are much smaller than the salt fingers outside the bottle. Because, clearly, inside the bottle the warm water is cooled both at the interface with the cold water inside the bottle, and by heat conduction through the walls of the bottle, since the water is surrounded by cold water. The warm water that flowed out of the bottle and up towards the water’s surface is only cooled at the interface with the water below (the air above is warmer than the cold water). So this gives you the perfect opportunity to discuss the scaling of salt fingers depending on the stratification without having to go through the pains of actually preparing stratifications with different gradients in temperature or salinity.

IMG_9084

Self-portrait with salt fingers :-)

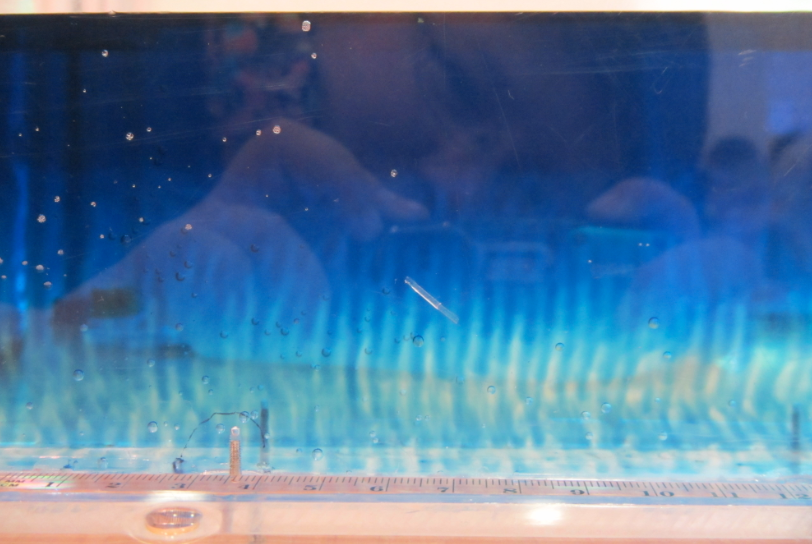
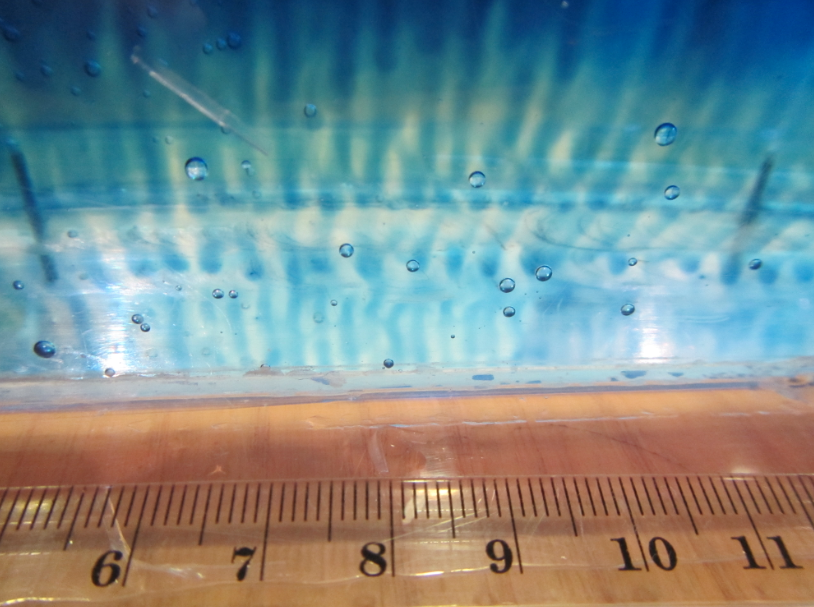
In my experience, the best salt fingers happen when you use hot water with dye (as the warm and salty top layer) and cold fresh water below. Salt fingers develop quickly, you don’t have the hassle of hitting the exact temperatures or salinities to make the density stratification statically stable, yet unstable in salinity, and it ALWAYS works.


IMG_9079

Double-diffusive mixing. Scale at the bottom is centimeters.


IMG_9054

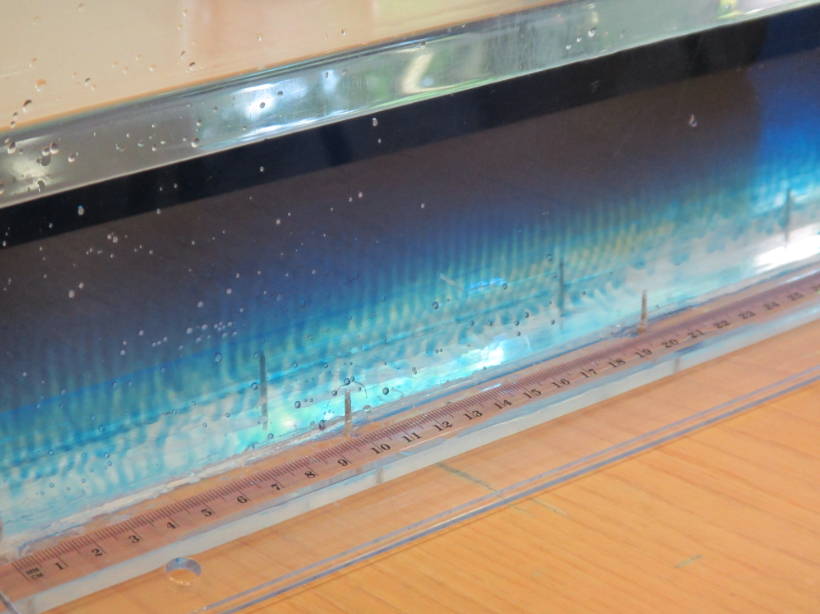
Salt fingering in a tank. Scale at the bottom is centimeters.

And look at how beautiful it looks! Do you understand why I LOVE double diffusion?

P.S.: This text originally appeared on my website as a page. Due to upcoming restructuring of this website, I am reposting it as a blog post. This is the original version last modified on November 4th, 2015.
I might write things differently if I was writing them now, but I still like to keep my blog as archive of my thoughts.

Guest post: Using seawater to make bread!

Last week I got one of the coolest emails I have ever received: Someone had found my blog while googling for the salt content of seawater in order to use it to make bread, and he sent me a couple of pictures the resulting bread! Of course, I asked if I could share it as a guest post on my blog, so here we go (Thanks, Martin Haswell, for this unique and inspiring contribution! See, everybody? Real-world impact of science blogging!):

Making bread using seawater

There is nothing like a challenge from your best friend, to do something that you’ve never done before but might just work. In my case, make bread using sea water.

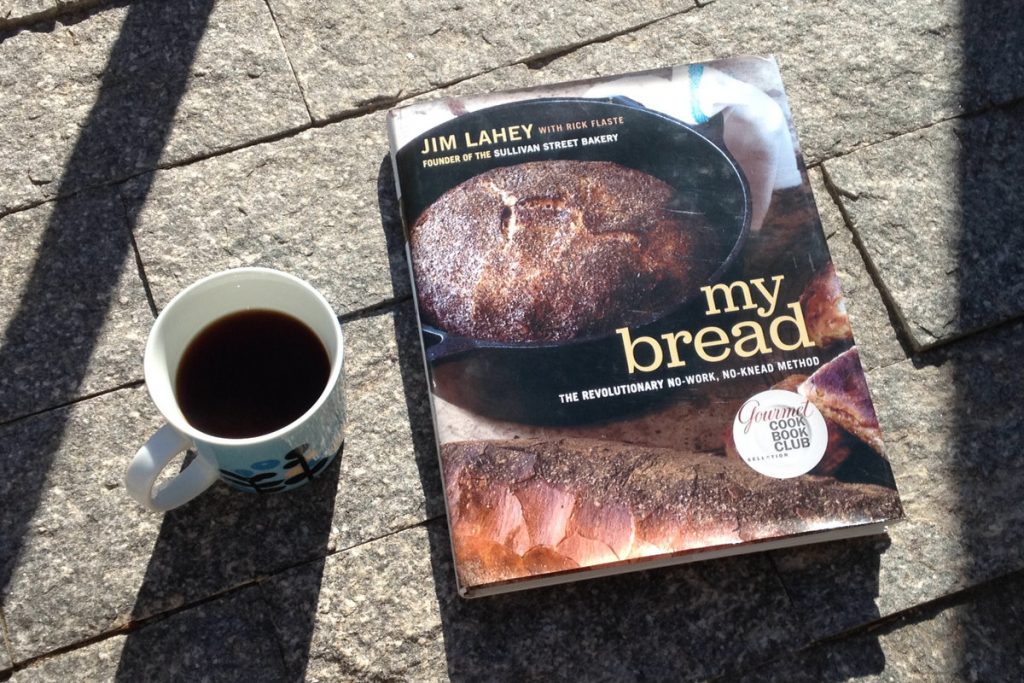
My friend Mandy had brought me back from New York a copy of Jim Lahey’s book “My Bread”. Jim’s ‘no-knead’ method of bread making uses flour, water, salt (normally) and a tiny amount of yeast – and a lot of time, but no kneading. The dough is left for a long time to rise and is baked very very hot, and makes a tasty and crusty loaf.

Jim has a recipe in his book called  “Jones Beach Bread” in which he uses seawater instead of house water plus salt to make the dough. Knowing that we both used the ‘no-knead’ recipe and that I had access to a beach with clean water, Mandy challenged me to follow this recipe, and this is how it went.

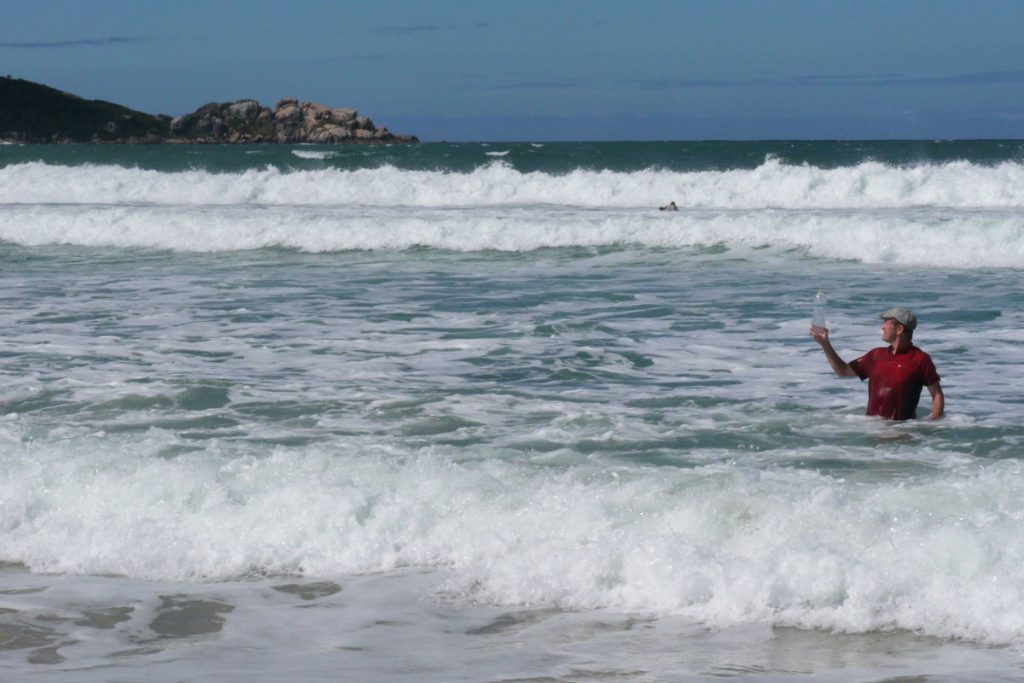
Martin collecting seawater on the beach, far enough out to miss most of the turbidity

Martin collecting seawater on the beach, far enough out to miss most of the turbidity

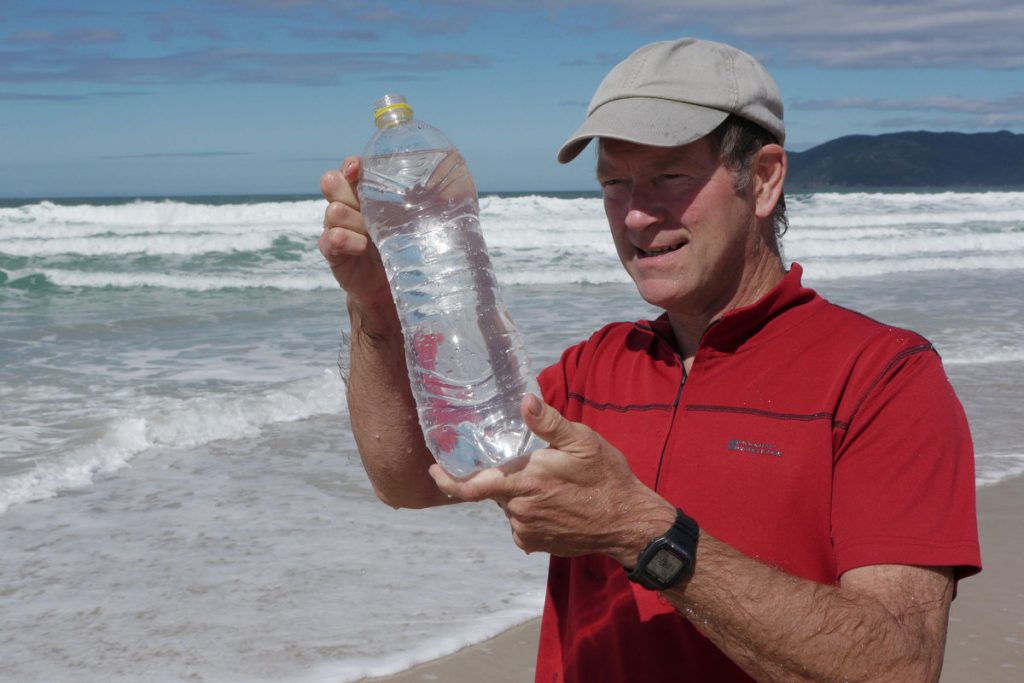
Martin checking the seawater sample for sand or other impurities

Martin checking the seawater sample for sand or other impurities

Jim Lahey’s book “My Bread” that contains Jim’s 'no-knead' method of bread making used for the bread in this blog post

Jim Lahey’s book “My Bread” that contains Jim’s ‘no-knead’ method of bread making used for the bread in this blog post

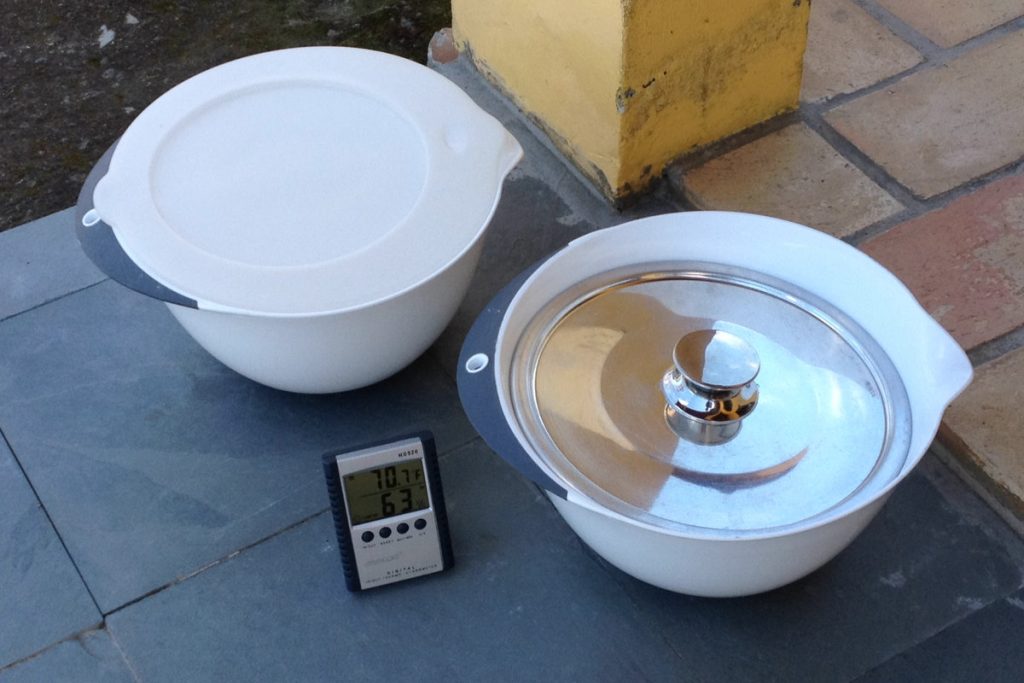
Waiting for the bread to raise

Waiting for the bread to raise

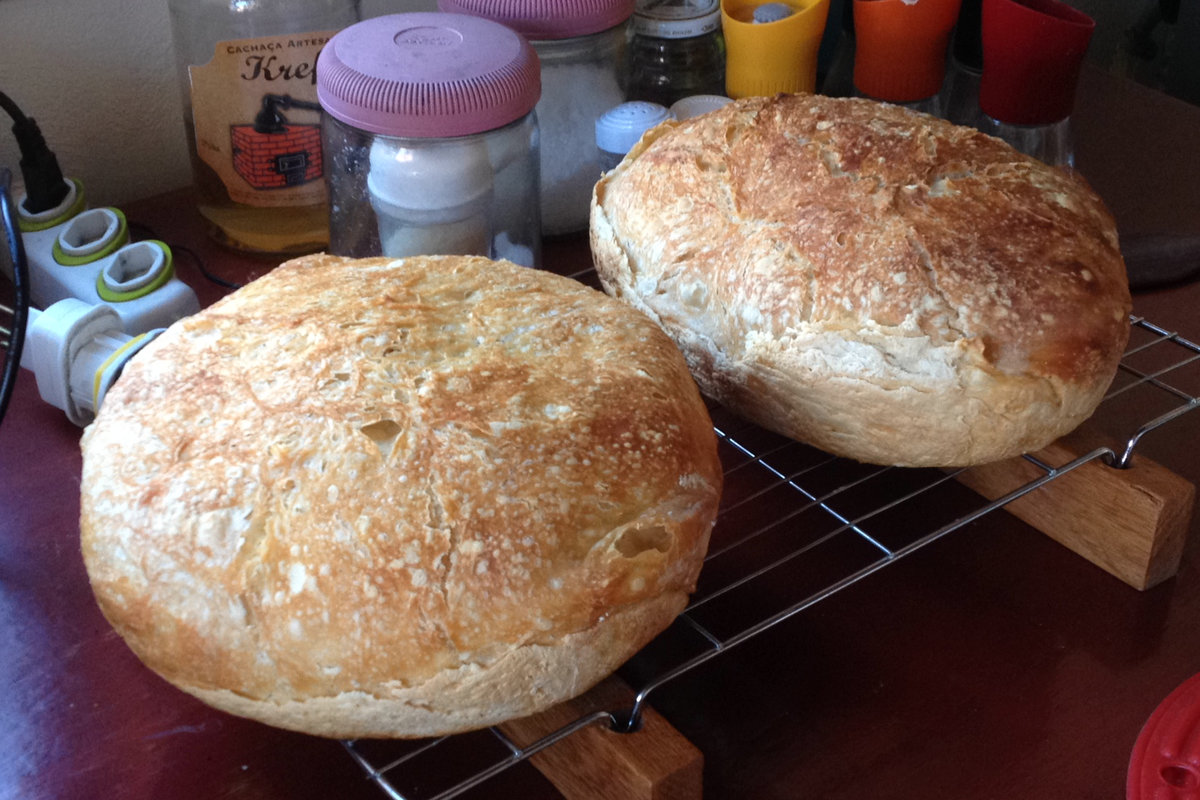
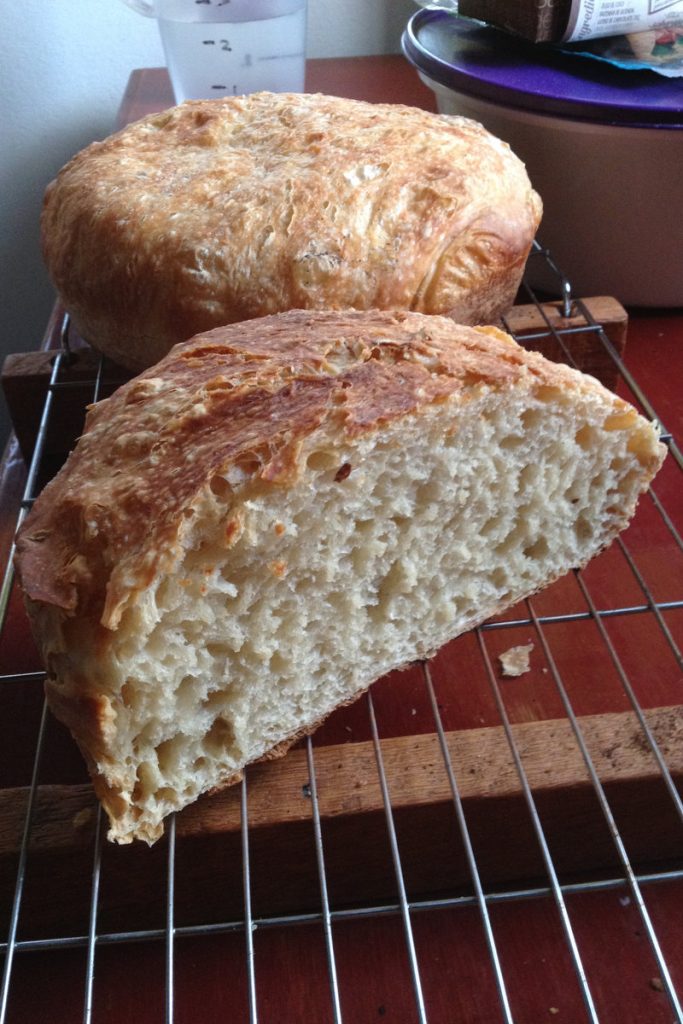
The finished result! Doesn't it look delicious?

The finished result! Doesn’t it look delicious?

The bread tasted very good, crusty and tasty. I made two loaves, one with the seawater filtered through a coffee filter and the other with unfiltered seawater. Normally this recipe needs around 12-18 hours rising time but this took 28 hours for the two risings, but it is winter in southern Brasil (Florianópolis, on the coast) and the day temperature was only 72F (22°C) on the day of the experiment. It’s also possible that the greater proportion of salt might have hindered the development of the yeast and held back the rise. This wasn’t a very scientific experiment.

I calculated that Lahey’s original no-knead’ recipe calls for 8g salt to 300g of water which makes 26.66g per litre, whereas sea water (according to Mirjam’s 2013 blog is 35g/litre so this should mean that the sea bread loaf should be around 30% more salty than normal; if I’m honest, it didn’t tasty significantly more salty).

Further experiments: the obvious test would be a sea water loaf vs conventional made, risen and baked at the same time.

Notes:

The Jones Beach in Jim’s recipe is the Jones Beach State Park on Long Island, New York State. The current water cleanliness data is here (PDF), scroll down for the Jones Beach SP results.

The beach that I collected my sea water from is currently ‘própria‘ but I wouldn’t collect after heavy rain (runoff) or heavy seas (turbidity).  As a safety precaution one could boil the sea water and let it cool just enough before using. In fact, when the weather is cold, that would be the best way of giving the bread a good start.

[note by Mirjam: I’ve done a super quick google search and it looks like typical salinities for the Florianopolis area can go down to 30-ish and thus be lower than the typical, open ocean value of 35, but during summer they might go up to 37 (Pereira et al., 2017) but in addition to the seasonal changes, your salinity probably depends very much on which beach you took the water sample at (for example if it was a lagoon-ish beach with a lot of freshwater runoff and not so much mixing with the open ocean). Since you collected the water fairly close to the beach and during winter, it’s likely that the salinity wasn’t quite as high as the 35 I mentioned (which would explain why the bread didn’t taste as salty as you might have expected). If you wanted to know the exact salinity next time you are making bread, an easy method to measure the salinity of sea water would be to boil a liter until all the water has evaporated and weigh the remaining salts. This isn’t very precise for oceanographer-standards, since some of the substances that oceanographers include in their measure of “salinity” in sea water at normal temperatures might actually evaporate with the water, but since the largest constituent of the “salt” in sea water is just normal NaCl, the mistake you’d be making is probably small enough for cooking purposes, and you’d get a general idea of how “typical” your sample is in terms of seawater salinity.]

Bio:

Martin Haswell is an English photographer who loves travel and making bread.

Taking ownership of your own mentoring

Have you ever had questions related to your career development that you didn’t know who to ask for answers for? Or have you ever felt that you would probably profit from having a mentor, but didn’t know who that mentor could be? Or do you have a great mentor but wonder whether you might be relying too heavily on him or her? Then this post is for you!

(This post, and the article referenced at the bottom, are heavily inspired by the work of Kerry Ann Rockquemore, especially this post, and workshops she gave for the Earth Science Women’s Network.)

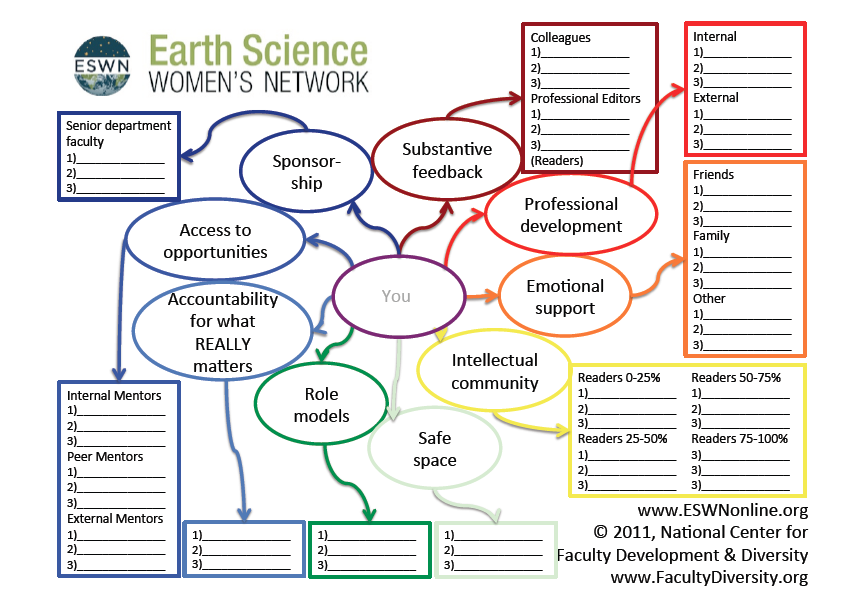
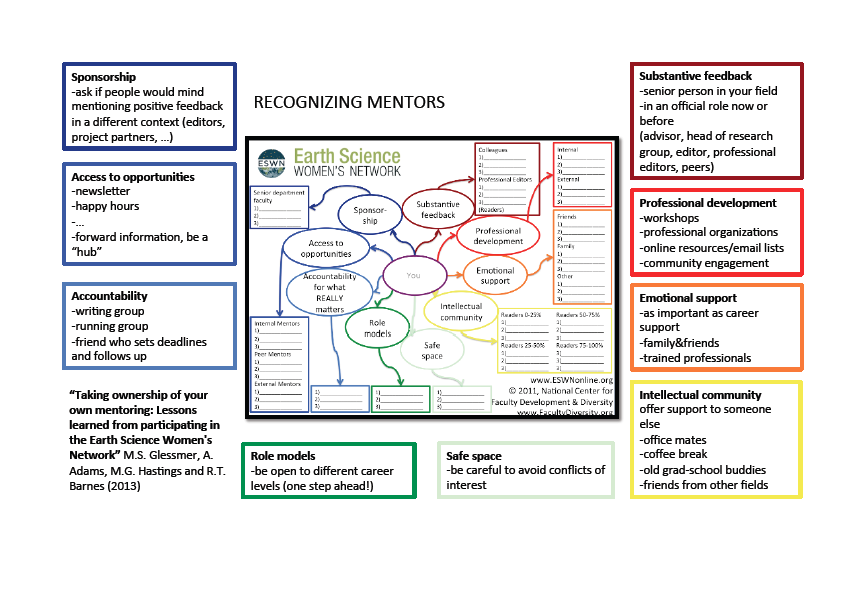
So. Let’s get started. Do you even know what your current mentoring needs are? In the image below we suggest different kinds of mentoring needs that you will probably all encounter throughout your career, hopefully not all at the same time.

It is really helpful to try and identify a person for each of those fields that might possibly be able to help. If you fill out the blank spaces in the graphic below now, before you actually urgently need someone to fill a specific role, it’ll be very valuable once the time comes!

Mentoring_map_01

A “mentoring map” to help you identify your mentoring needs as well as who might be able to fill those needs.

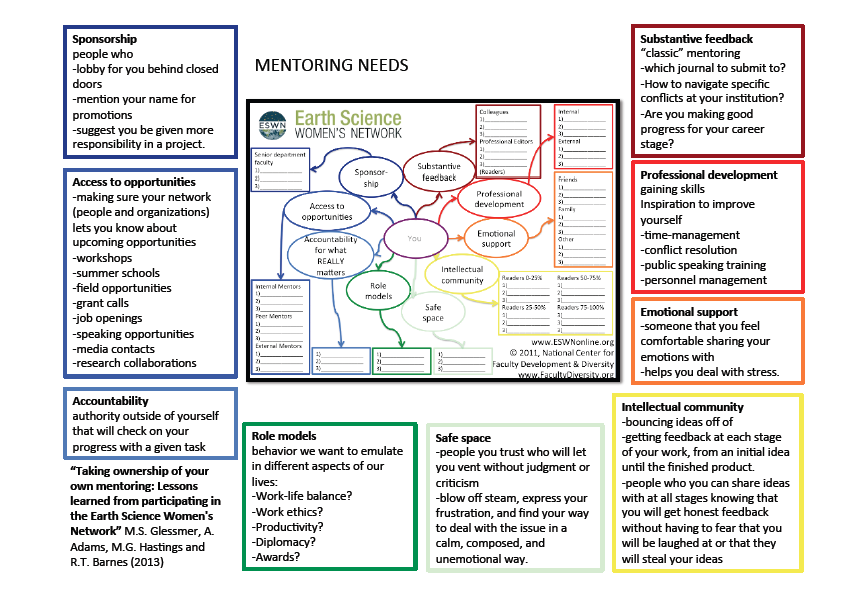
If you aren’t quite sure what each of the fields above contains, the image below might give you ideas:

Mentoring_map_02

Mentoring map. What exactly are your mentoring needs?

And now that you know what your needs are, how do you actually identify possible mentors for each category? We give some ideas in the image below!

Mentoring_map_03

Mentoring map and where to find possible mentors for the different mentoring needs

Do you feel like you are taking unfair advantage of your mentors? Then maybe think about paying it forward. Be a sponsor to the student that stands out in your class and recommend her for a scholarship. Be the safe space your friend needs. Give substantial feedback on your office mate’s paper. Even if you feel you are nowhere near ready to “be someone’s mentor”, that is probably not true. Give back when the opportunity arises, and don’t feel bad to ask for the mentoring you need!

For more details, check out our article:

Glessmer, M.S., A. Adams, M.G. Hastings, R.T. Barnes, Taking ownership of your own mentoring: Lessons learned from participating in the Earth Science Women’s Network, published in The Mentoring Continuum: From Graduate School Through Tenure, Syracuse University Graduate School Press, ed. Glenn Wright, 2015.

Pdf of the chapter here.

P.S.: This text originally appeared on my website as a page. Due to upcoming restructuring of this website, I am reposting it as a blog post. This is the original version last modified on November 4th, 2015.
I might write things differently if I was writing them now, but I still like to keep my blog as archive of my thoughts.

Experiment: Temperature-driven circulation

My favorite experiment. Quick and easy and very impressive way to illustrate the influence of temperature on water densities.

This experiment is great if you want to talk about temperature influencing density. Although it doesn’t actually show anything different from a temperature driven overturning experiment, where circulation is determined by hot water rising and cold water sinking, somehow this experiment is a lot more impressive. Maybe because people are just not used to see bottles pouring out with the water coming out rising rather than plunging down, or maybe because the contrast of the two bottles where one behaves exactly as expected and the other one does not?

Anyway, it is really easy to do. All you need is a big jar and two small bottles. Cold water in one of the small bottles is dyed blue, hot water in the other small bottle is dyed red. Both are inserted in the jar filled with lukewarm water (movie below).

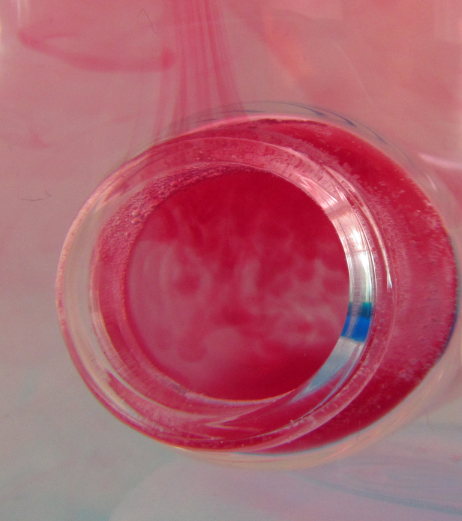
Using bottles with a narrower neck than mouth is helpful if you want to use the opportunity to talk about not only temperature-driven circulation, but also about double-diffusive mixing (which you see in form of salt fingers inside the red bottle in the picture above).

Isn’t this beautiful?

P.S.: This text originally appeared on my website as a page. Due to upcoming restructuring of this website, I am reposting it as a blog post. This is the original version last modified on December 2nd, 2015.

I might write things differently if I was writing them now, but I still like to keep my blog as archive of my thoughts.

The proof of concept phase is over! My Instagram in July, and what’s the plan now.

So what’s going on with my Instagram fascinocean_kiel? Plenty of things are changing!

In July, I stuck to the strategy I had developed for my private #scicommchall. But then in August I noticed that I was ready for a change, so that change happened!

Let me first remind you of how fascinocean_kiel was set up.

My goals with fascinocean_kiel were to

  1. extend my portfolio as science communicator to include Instagram (clearly achieved since I’ve been asked to give interviews and workshops on how to use Instagram for science communication purposes, and I have four solid months of scicomm Insta to show),
  2. establish a “proof of concept” of sorts: An Instagram profile that uses daily snapshots of something that isn’t possible to plan for 100% (in this case waves, but it might also be clouds or anything else you go out to observe without knowing exactly what to expect each day) but consistently points out interesting things specific to that day’s situation and explains different aspects every day, and in doing so target a specific, local audience in order to raise awareness of a very specific topic (so if anyone is looking for a science communicator to do this: I’ve proven that I am ready if a) your topic is something that I can get really excited about and b) you pay me for doing the work ;-)),
  3. provide an example of an Instagram profile to the PhD students in my project, who I was tasked with motivating to start science communication on social media (which worked beautifully: Check out the KiSOC_Kiel Instagram we are running for the project, and it links to all the different accounts of KiSOC PhDs and friends!).

So yes, even though I’m really happy with how things worked in the “proof of concept” phase, I am done with it now. For any science communication, it is really important that you not only have your goal, audience and message clear, but also that it fits with your lifestyle. And while snapping pictures of Kiel fjord every morning before work is fine while I am in Kiel, I am travelling too much for work to be as consistent as I would like for the purpose of the specific Instagram strategy described above (both because the regular Kiel fjord theme will have gaps, and also because during those gaps I am snapping pictures of water elsewhere that I also want to post!). But so over a longish period of time I’ve been thinking about where to go with fascinocean_kiel, in terms of goals, message, audience and also feasibility in my life and what I really enjoy.

And this is the new (and improved? What do you think?) fascinocean_kiel:

  • “Proof of concept” phase is over, and what is going on now and in the future will be disconnected from what went on until the end of July(-ish). Goals are different, audience is different, message is different, and that is fine!
  • Goal: This will not be a profile with the primary focus on establishing a good practice example for science communication any more. This will be my private creative outlet, and thus I will only post when I feel like it and not try to keep up a regular schedule (yep, I know that’s bad for the algorithm, but that’s fine), and I will post on whatever I fancy that moment.
  • Audience: I’ll be writing in English again, because the people that I want to reach with my posts and that I want to interact with are basically people who are my blog’s current audience (or people who haven’t found my blog yet, but are “similar” to my established readers): People with an interest in oceanography and/or teaching worldwide, not restricted to a german speaking community. I’ll also let go of the idea of specifically talking to a lay audience. I’ll try to still write in a way that you don’t need training in oceanography to follow, but I am now envisioning people like my friends Ib, Elin, Nena, Heiko, or my parents or sisters reading the posts, and I’ll be writing for them.
  • Message: Posts won’t contain a lot of information themselves (unless for some reason I feel like it that day), instead, they will be used to advertise new blog posts (which then will contain more text).
  • Feasibility: I am taking this from something that I do “for my job, but on my own time” and following the fairly restrictive design criteria described above to purely a creative outlet.

Phew, that actually takes SO MUCH pressure off me! Even though it has been a lot of fun to do all this fascinocean_kiel stuff, it has also been work! And I have enough other stuff that I do pro bono that, in the long run, I think will have a bigger impact. So goodbye, old fascinocean_kiel! It was fun, but here is to new challenges and new solutions! :-)

Oh, and you actually wanted to see the stuff I did in July, too? More below the cut…

Continue reading

Alexander’s band: the dark space in between a primary and secondary rainbow

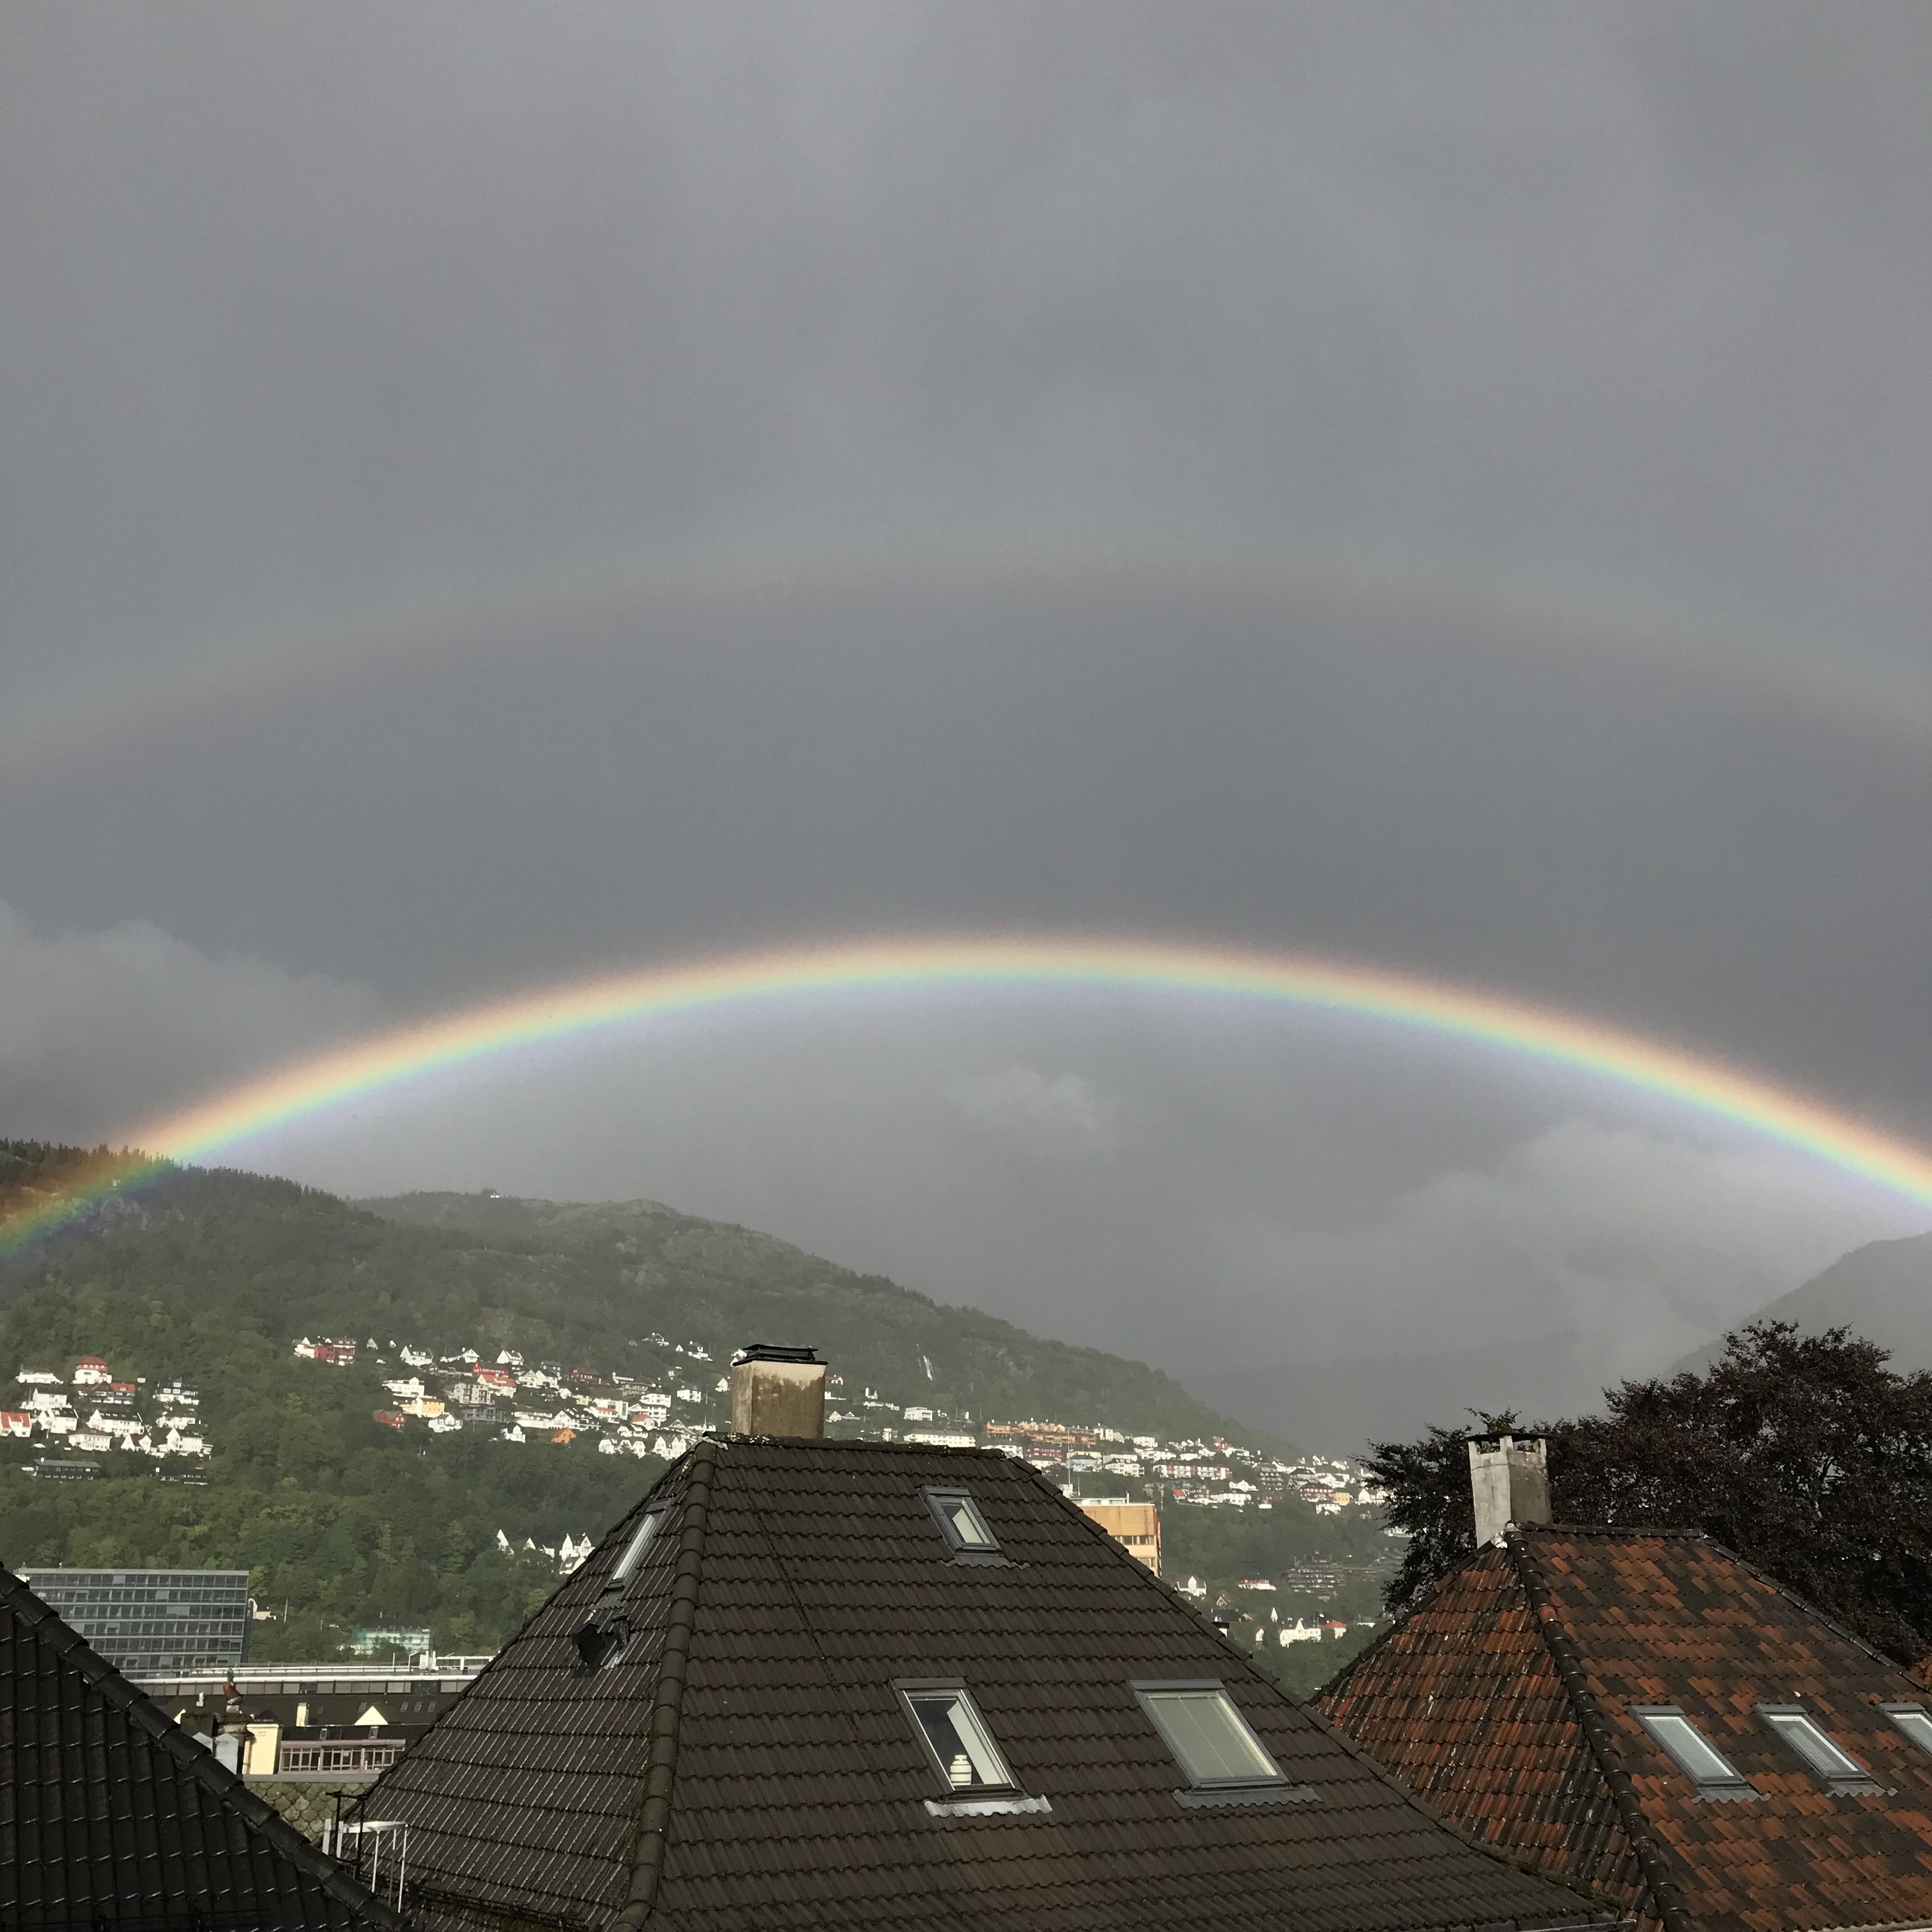
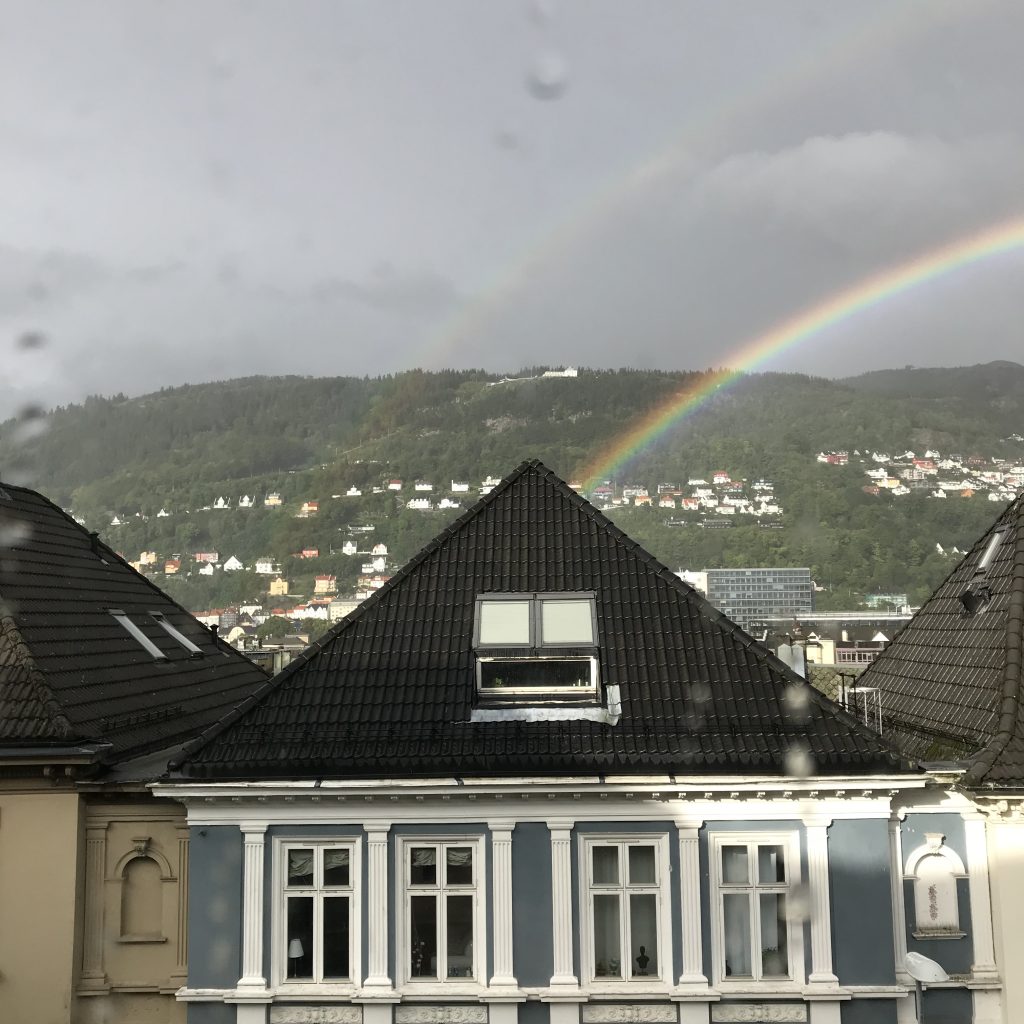
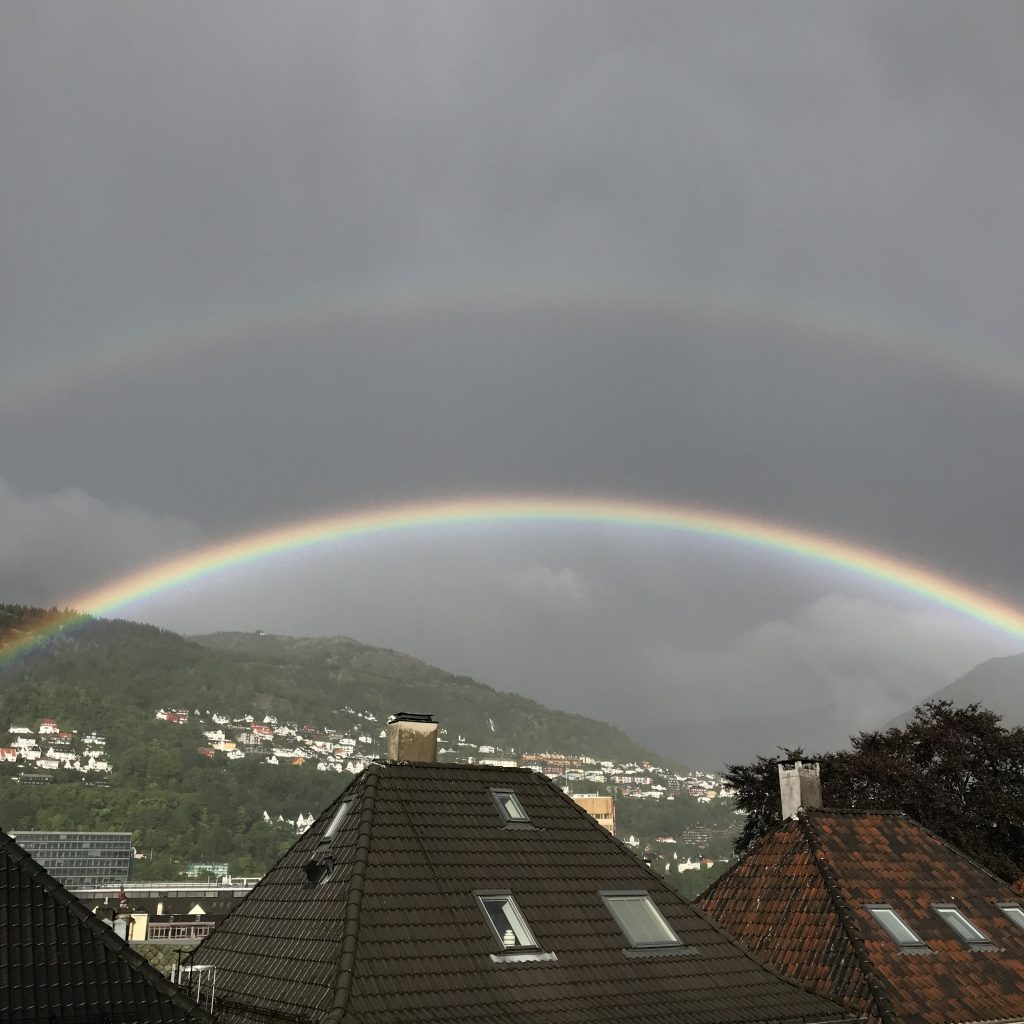
Bergen is a fairly wet place with on average 240 rain days every year. But that actually provides us with the perfect opportunity to see plenty of rainbows. Here is the view from the window of my apartment in the university guest house yesterday (and I love the raindrops on the windowpane!):

Bergen, Norway: primary and secondary rainbow on August 17, 2018. Note the "Alexander's band", the dark space between the two rainbows!

Bergen, Norway: primary and secondary rainbow on August 17, 2018. Note the “Alexander’s band”, the dark space between the two rainbows!

Isn’t this beautiful?

I am always fascinated by the intensity of the colors in a rainbow, and in cases where you get a primary and a secondary rainbow, of the darkness between those two. That area is called “Alexander’s band”, and occurs because the inner, primary rainbow focusses light towards its inside, whereas the outer, secondary rainbow spreads it towards its outside. So we end up with this dramatic dark band in between the two. I love how dramatic it looks!

Bergen, Norway: primary and secondary rainbow on August 17, 2018. Note the "Alexander's band", the dark space between the two rainbows!

Bergen, Norway: primary and secondary rainbow on August 17, 2018. Note the “Alexander’s band”, the dark space between the two rainbows!

Fun fact on the side: A couple of years ago I did a couple of short movies on optics in rainbows, when I was playing around with different styles of teaching videos. Watching them back today is so painful, but at least this blog helps me to remember how far I have come… ;-)

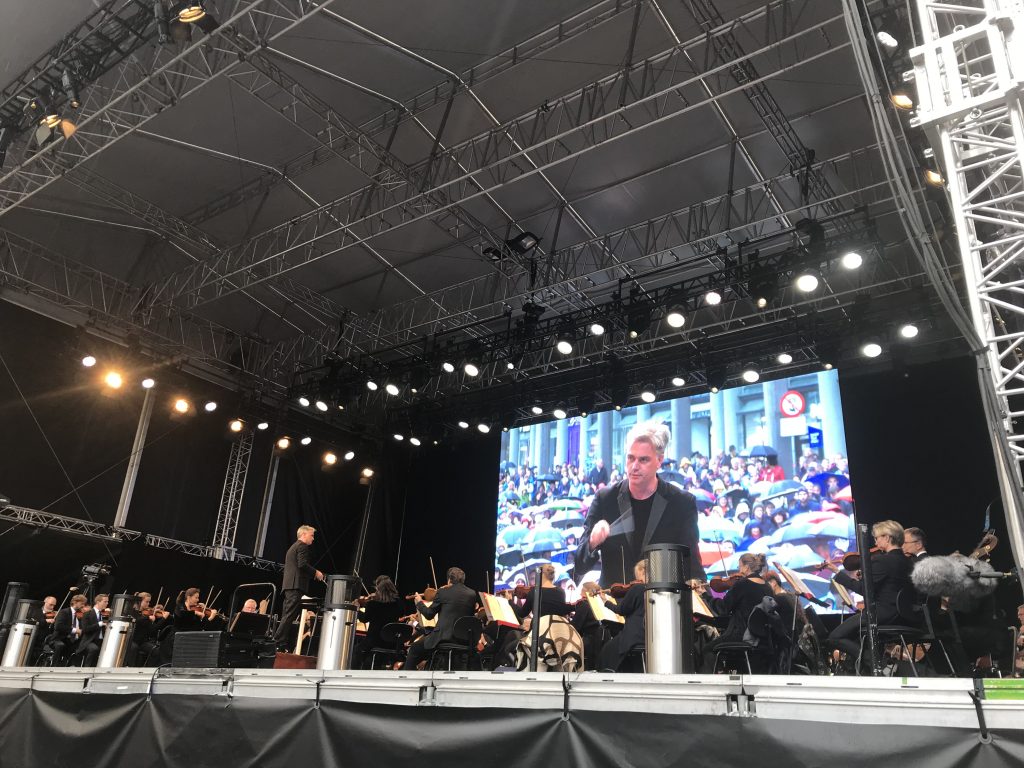
But let’s get back to talking about the weather. As I learned during the “summer concert” of the Bergen Filharmoniske Orkester yesterday: According to conductor Edward Gardner, translating from Det finnes ikke dårlig vær, bare dårlige klær, “there is no such thing as bad weather, only bad cleather”. Hahaha.

Summer concert of the Bergen Filharmoniske Orkester under conductor Edward Gardner on August 17, 2018. On the big screen you get a glimpse of what the weather was like...

Summer concert of the Bergen Filharmoniske Orkester under conductor Edward Gardner on August 17, 2018. On the big screen you get a glimpse of what the weather was like…

Above, on the big screen behind the orchestra, you see the kind of clothing that was appropriate for the occasion. That was one brilliant concert and totally worth sitting in the pouring rain with rain coat, rain pants, waterproof shoes! There really is no such thing as bad weather! :-)

Tides themselves don’t induce (a lot of) mixing, only tides hitting topography do. An experiment.

As you might have noticed, the last couple of days I have been super excited to play with the large tanks at GFI in Bergen. But then there are also simple kitchen oceanography experiments that need doing that you can bring into your class with you, like for example one showing that tides and internal waves by themselves don’t do a lot of mixing, and that only when they hit topography the interesting stuff starts happening.

So what we need is a simple 2-layer system and two different cases: One with topography, one without. And because we want to use it to hand around in class, the stratification should be indestructible (-> oil and water) and the container should be fairly tightly sealed to prevent a mess.

Here we go:

There definitely is a lot to be said for kitchen oceanography, too! Would you have thought that using just two plastic bottles and some oil and water could give such a nice demonstration?

Enabling backchannel communication between a lecturer and a large group

Using technology to enable active engagement with content in a large lecture.

In 2014, I presented the paper “Enabling backchannel communication between a lecturer and a large group” at the SEFI conference in Birmingham. That paper is based on work that I have done with two colleagues – the instructor of a large lecture, and the teaching assistant at the time.

Now if oceanographers hear something about “large lectures”, they typically envision a couple dozen students. In this case, it was a couple of hundred students in a lecture theatre that sits about 700.

The challenge

When sitting in on the class the year before, I noticed that there were a lot of questions that students were discussing around me that never made it to the instructor’s attention. This is not very surprising given the large number of students and that there were only two instructors in the room. But when talking about it afterwards, we decided that we wanted to find a way to channel student questions to make sure they reached the instructor. The “backchannel” was born.

We met up to discuss our options. It became clear very quickly that even though there are a lot of nice methods out there to invite feedback of the sort we wanted (for example through “muddiest point” feedback), this was not feasible with the number of students we were dealing with. So instead we decided to go for an online solution.

Twitter has been propagated for use in instruction for a while, and there are many other tools out there that enable backchannel communication. But we realized that we had very specific requirements which none of the existing tools were meeting simultaneously:

  • anonymous communication, to keep the threshold as low as possible
  • no special hardware or software requirements
  • easy to use
  • communication student to instructor, but not student-student
  • possibility of moderation

The solution

 In the end, Patrick coded a “backchannel” tool that could do all that. On a webpage, students enter text in a text field. They click a button to submit the text, and a moderator then, in real time, decides whether to forward the text to the instructor. The instructor then gets the text on a screen and can decide whether and when to incorporate it in their teaching.
We’ve found that this works really well from an operational point of view. The instructor has been really happy with the quality of questions he has been getting, and sometimes students even send links that they think should be shared with the class.

Students seem to like it, too, even though they aren’t engaging with the tool as much as we had anticipated. But there are a couple of reasons for that which we all name in our paper. Ultimately, we liked the tool enough to continue using it this year. The new semester has just started, so let’s see how it goes!

Thanks to my co-authors for a very interesting and enjoyable collaboration!

Enabling backchannel communication between a lecturer and a large group
M.S. Glessmer, M.-A. Pick and P. Göttsch
In Proceedings of the 42nd SEFI Conference. Birmingham, UK (2014)
http://www.sefi.be/conference-2014/0101.pdf

P.S.: This text originally appeared on my website as a page. Due to upcoming restructuring of this website, I am reposting it as a blog post. This is the original version last modified on November 4th, 2015.
I might write things differently if I was writing them now, but I still like to keep my blog as archive of my thoughts.

Waves in a density stratification. One of the most beautiful tank experiments I’ve ever seen.

It’s pretty impressive when a mountain moves through a stratification and generates lee waves. But what I find even more impressive: The waves that travel behind the mountain when the mountain is long gone. See here:

This kind of stuff looks more like a numerical simulation than something actually happening in a tank, doesn’t it? I am pretty stoked that we managed to set up such a nice stratification! Those are the things that make me really really happy :-)

(The setup of this experiment is the same as in this post)

Tank experiment: Lee waves in a fancy density (and dye) stratification

Did you seriously think we’d stop tank experiments with only 2-layer systems? Nooo!

Today, the plan was to set up a continuous stratification, which I have been planning to do for many years. After fiddling with the setup all morning (do you have any idea how many fittings on all kinds of hoses are needed to get that to work well?), reality set in and we ended up doing a quasi-continuous stratification, i.e. 12 density layers dyed in 6 different colors*.

And this is what it looks like when you tow a mountain through that stratification (and try to ignore the excited audience being reflected in the tank): Still very nice lee waves and surprisingly little turbulence!

*We set up the tank to contain the same amount of salt as our 2-layer system yesterday, so instead of one big density jump from about 1000g/l to 1026g/l, this now happened in 5 smaller, more or less regular, jumps. And here is how we did it in the end: Two large reservoirs (unfortunately of different diameters), one containing freshwater, the other one filled up to the same height, containing as much salt as we had in our experiment yesterday. Now the height of the reservoirs was divided in 12 equal dzs, and for each dz that went out of the “freshwater” tank into the experimental tank, we added salt water of the same dz to the “freshwater” tank, which thus continued to increase in salinity. The water that we mixed that way went through a hose and entered the experimental tank through the bottom of the tank through a hole over which we had put the mountain (to contain mixing to a small volume and also so we didn’t have to watch water shooting out of that hole in our nice stratification). So as the water we added became increasingly dense, it nicely layered itself underneath the other water in the tank. And we just had to add more and more dye for the color gradient. Easy peasy :-)