Category Archives: observation

It’s all about the right equipment: That’s why I now own a UV lamp! I see a lot of fluorescent tracer spotting in my future!

Before I start gushing about my awesome new UV lamp (thanks for encouraging that purchase, Uta! :-)), some other updates on the state of green in the park across the road from my house (don’t know what I am talking about? Check out previous posts on the fluorescent dye tracer).

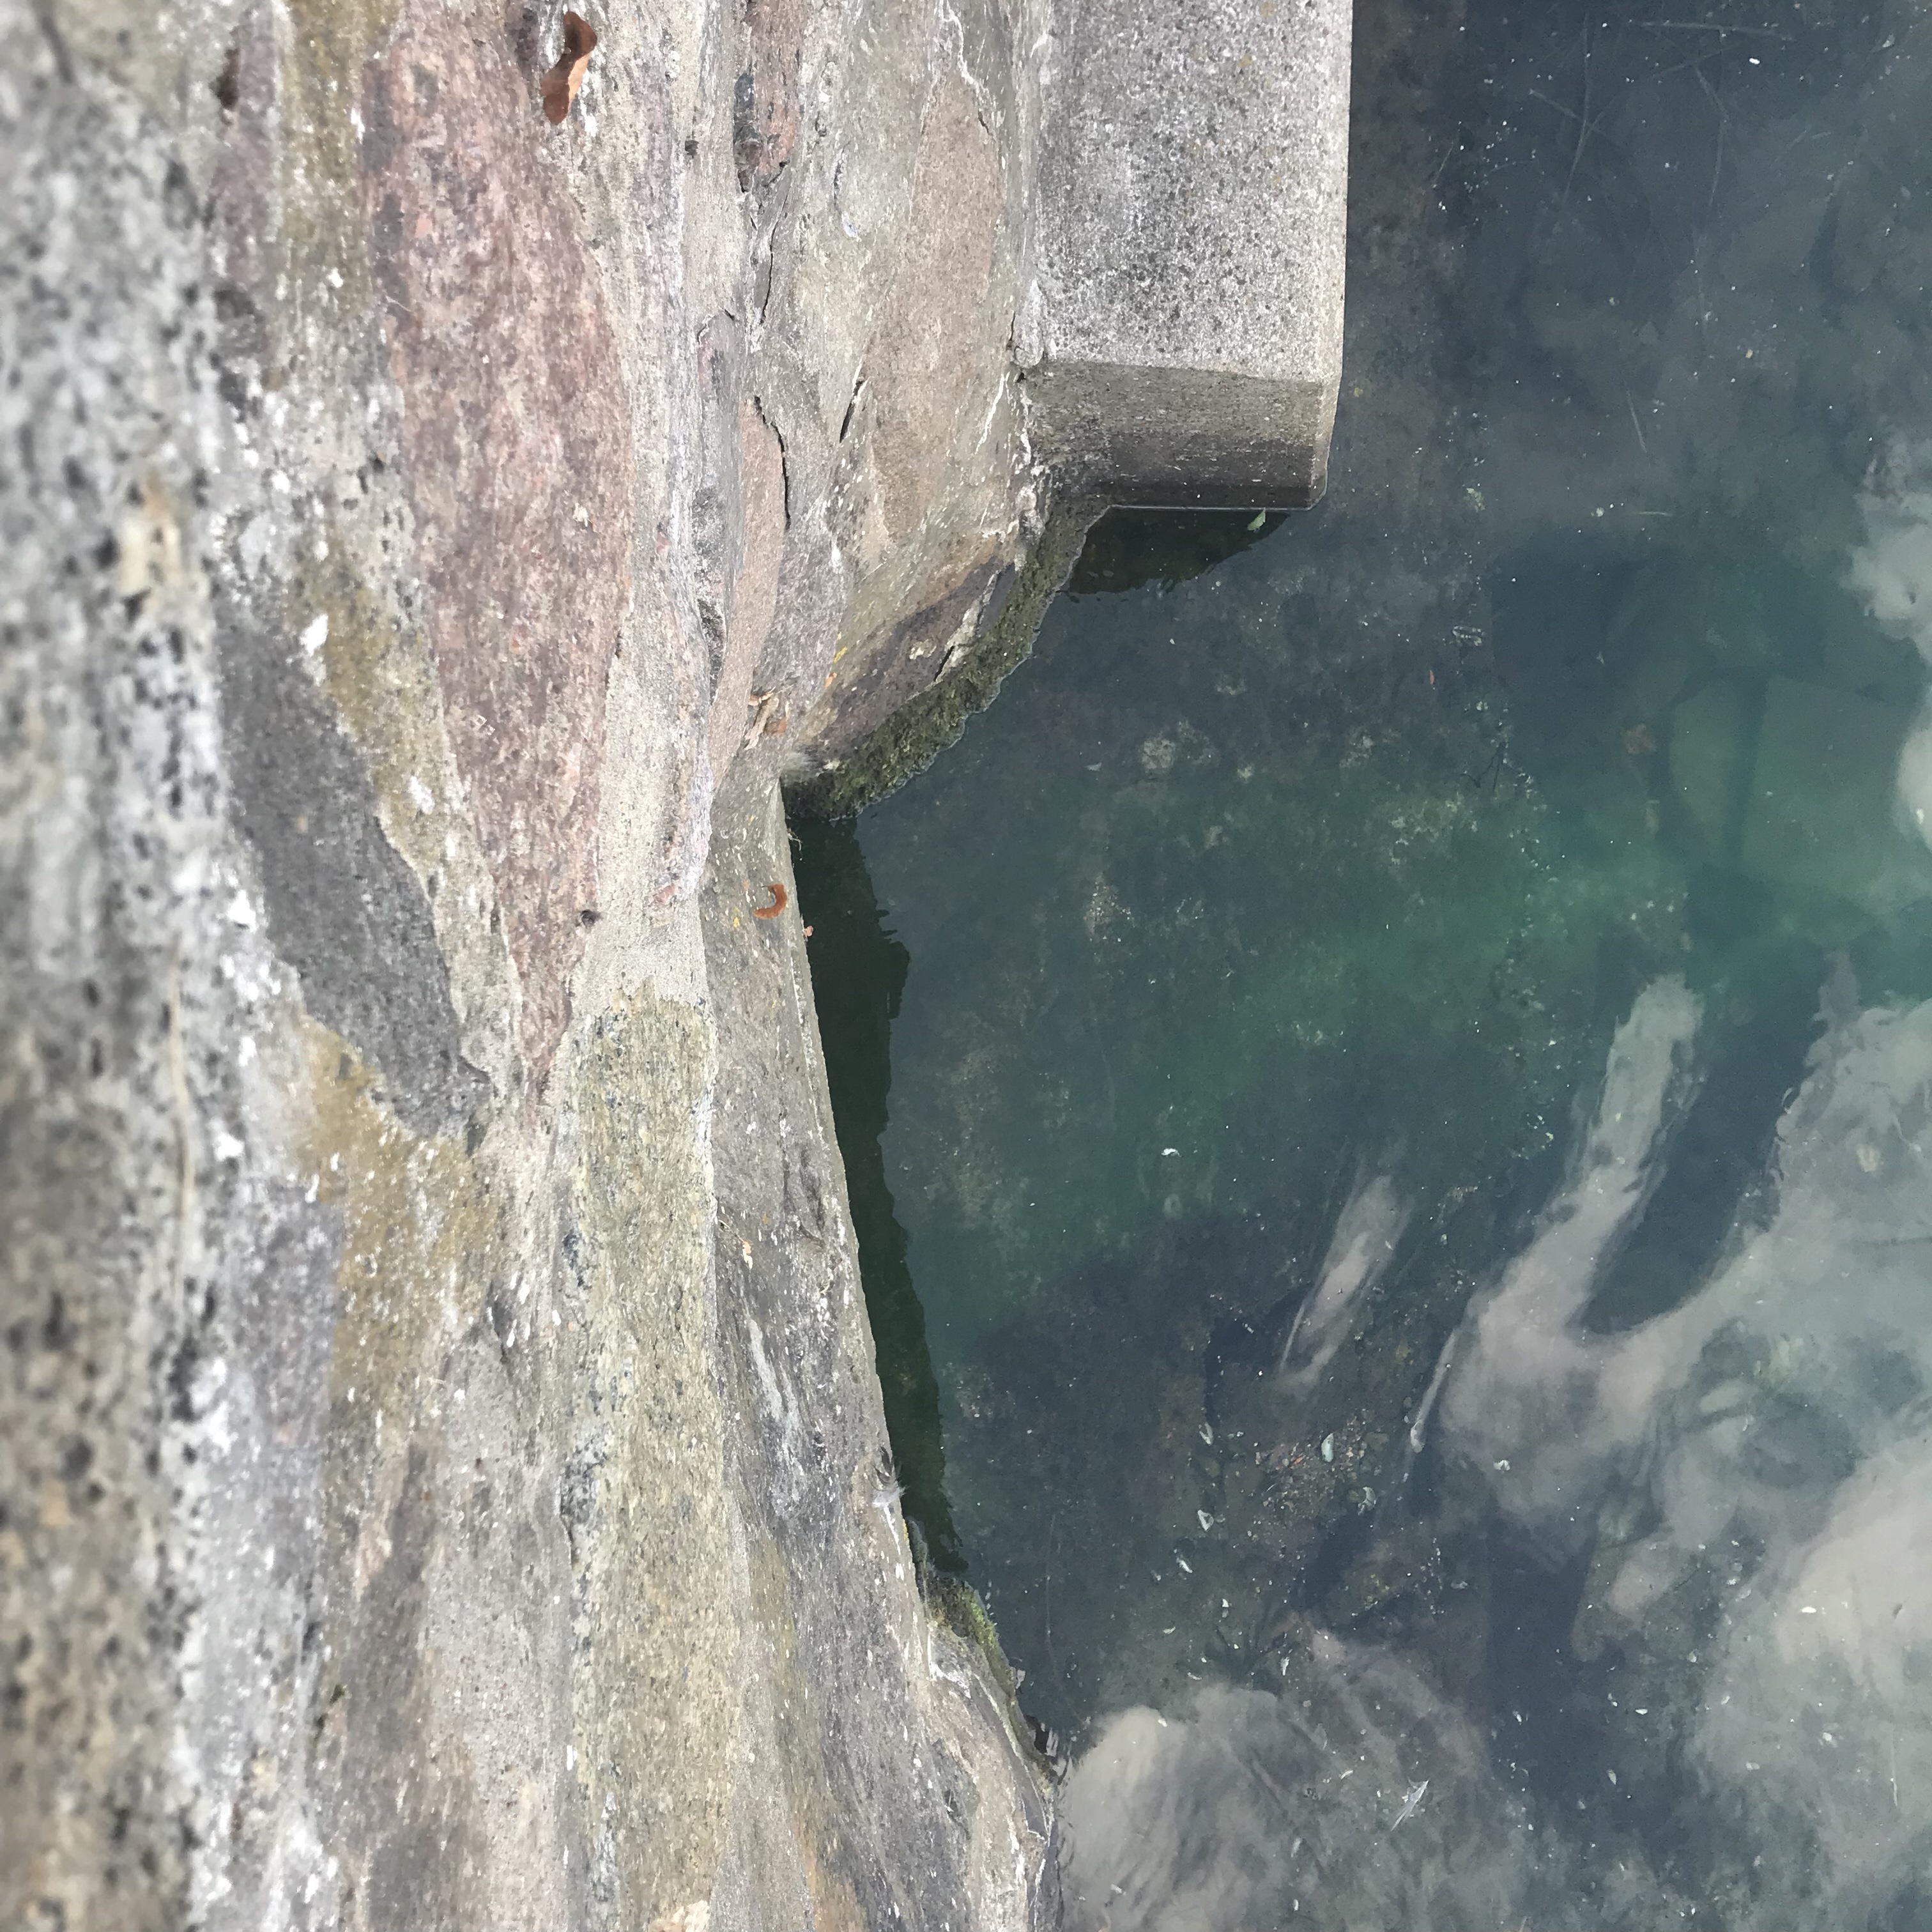
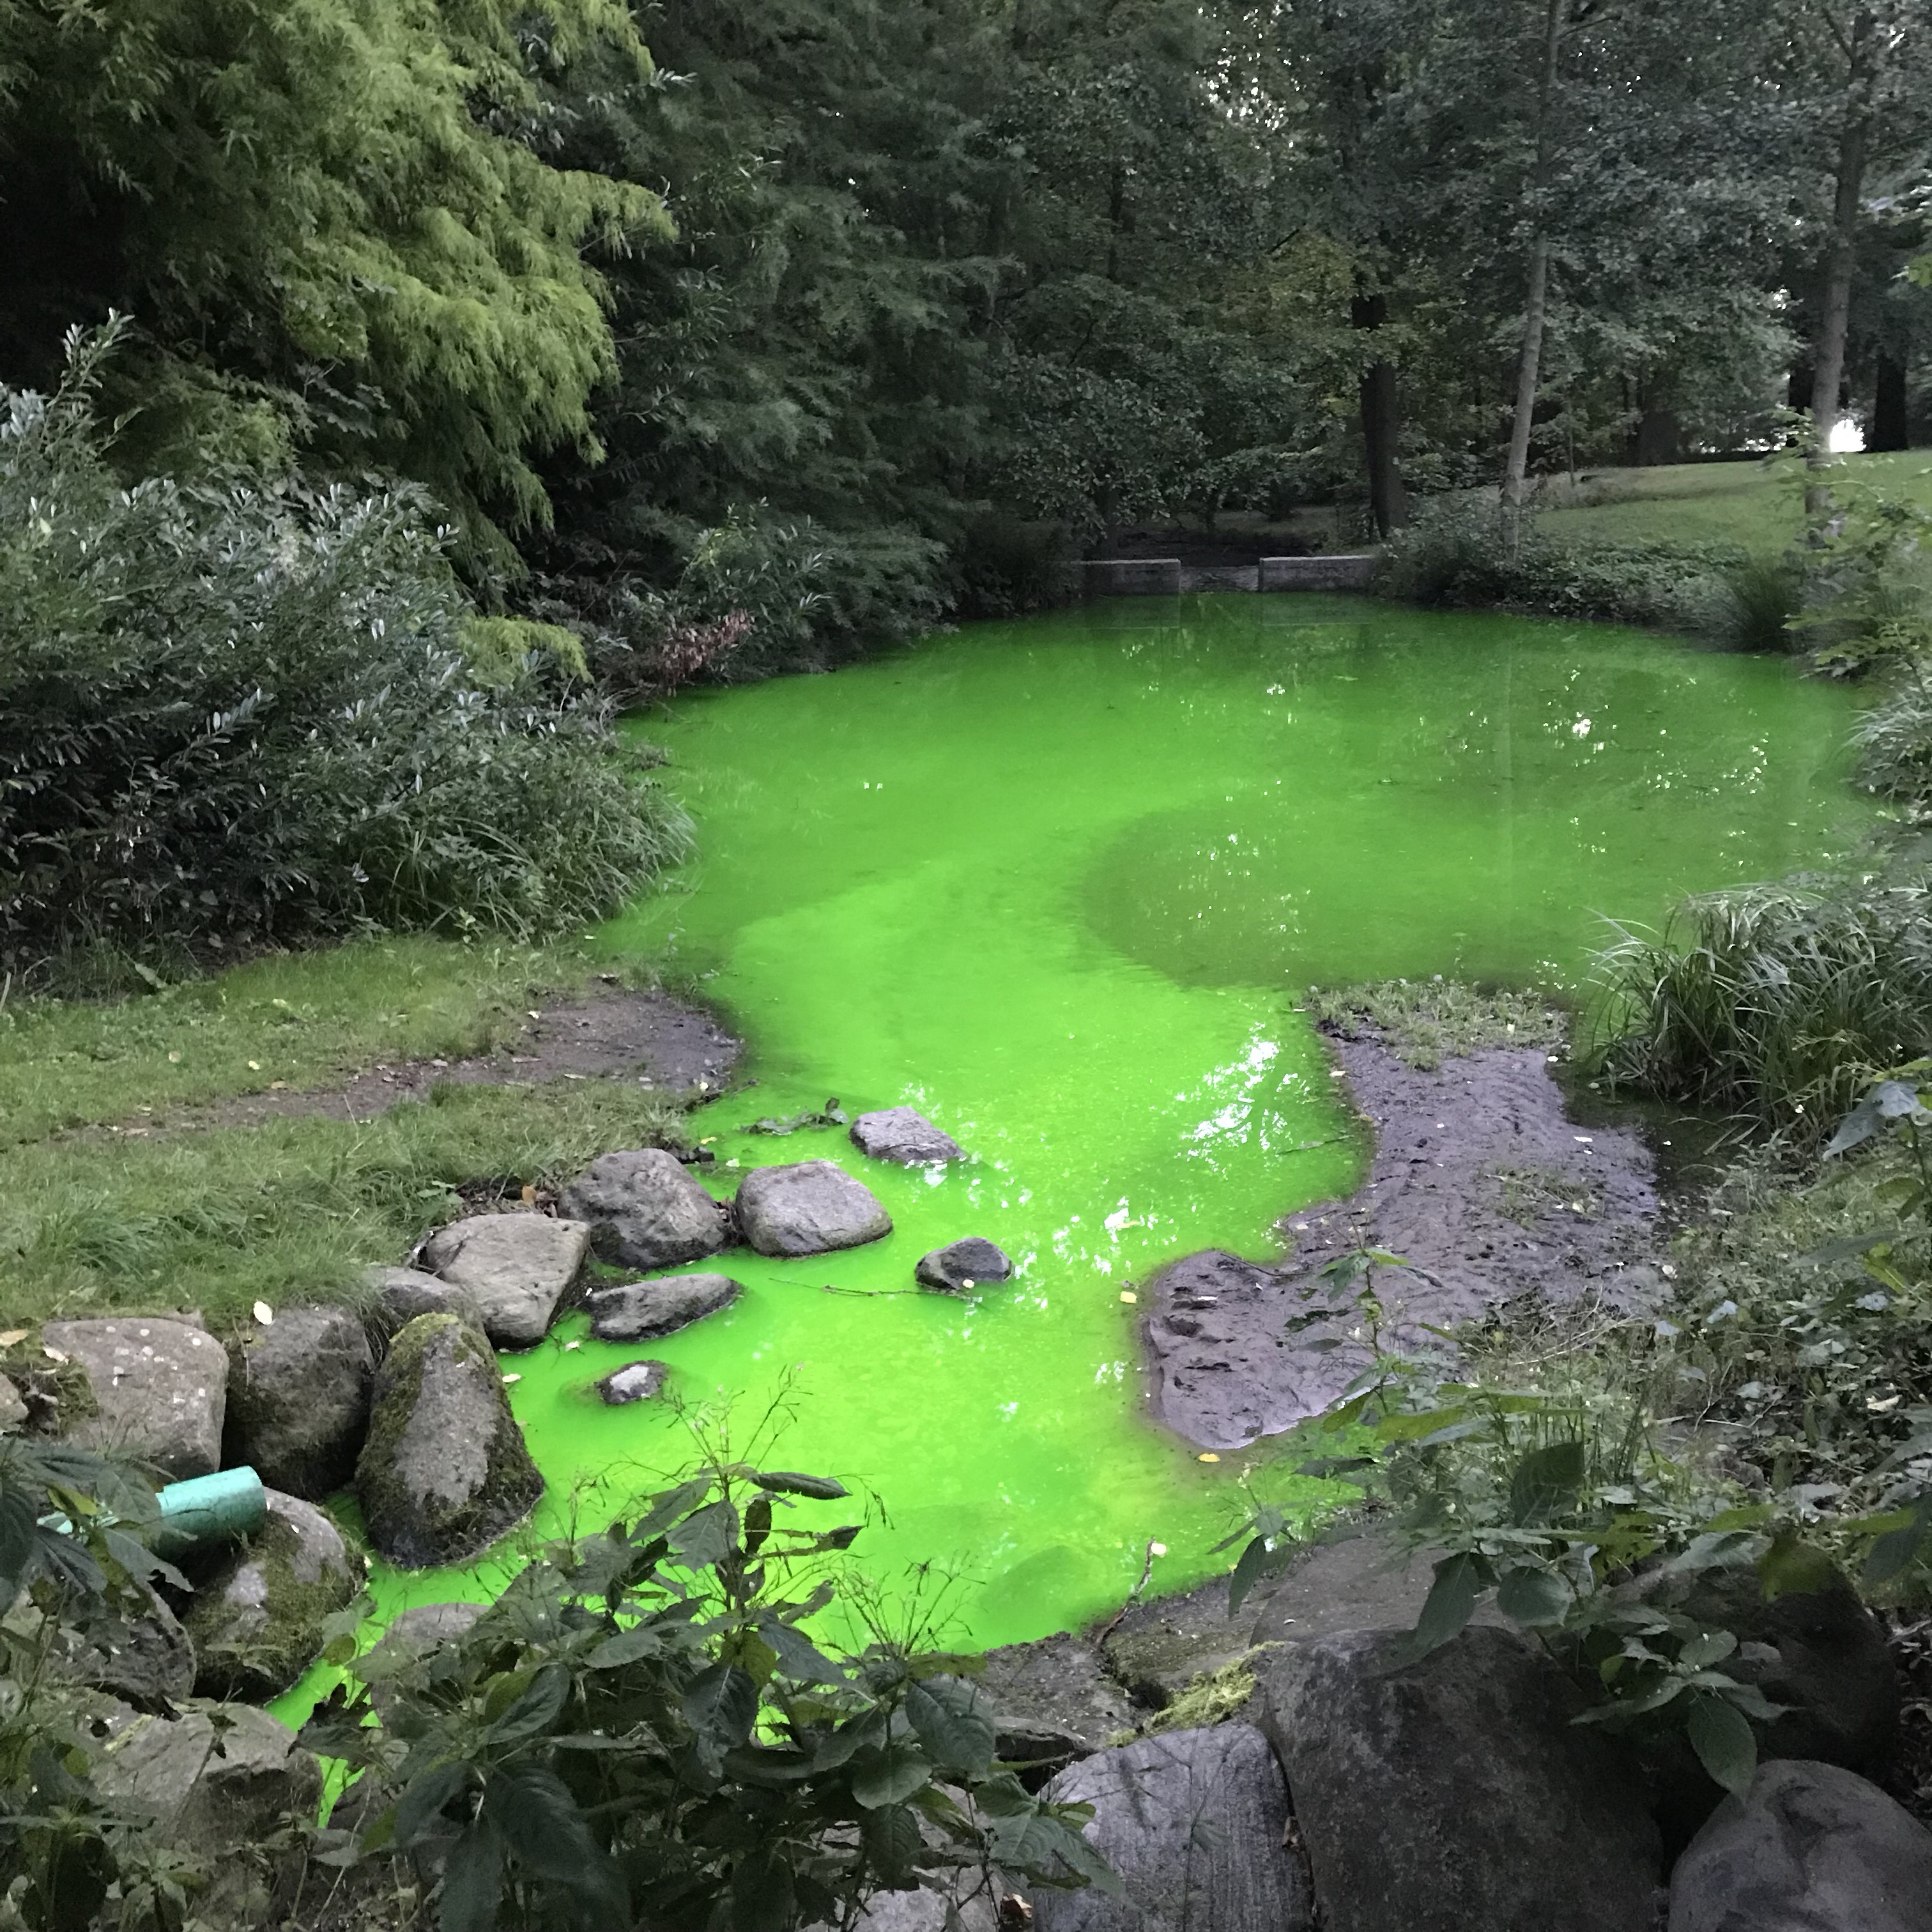
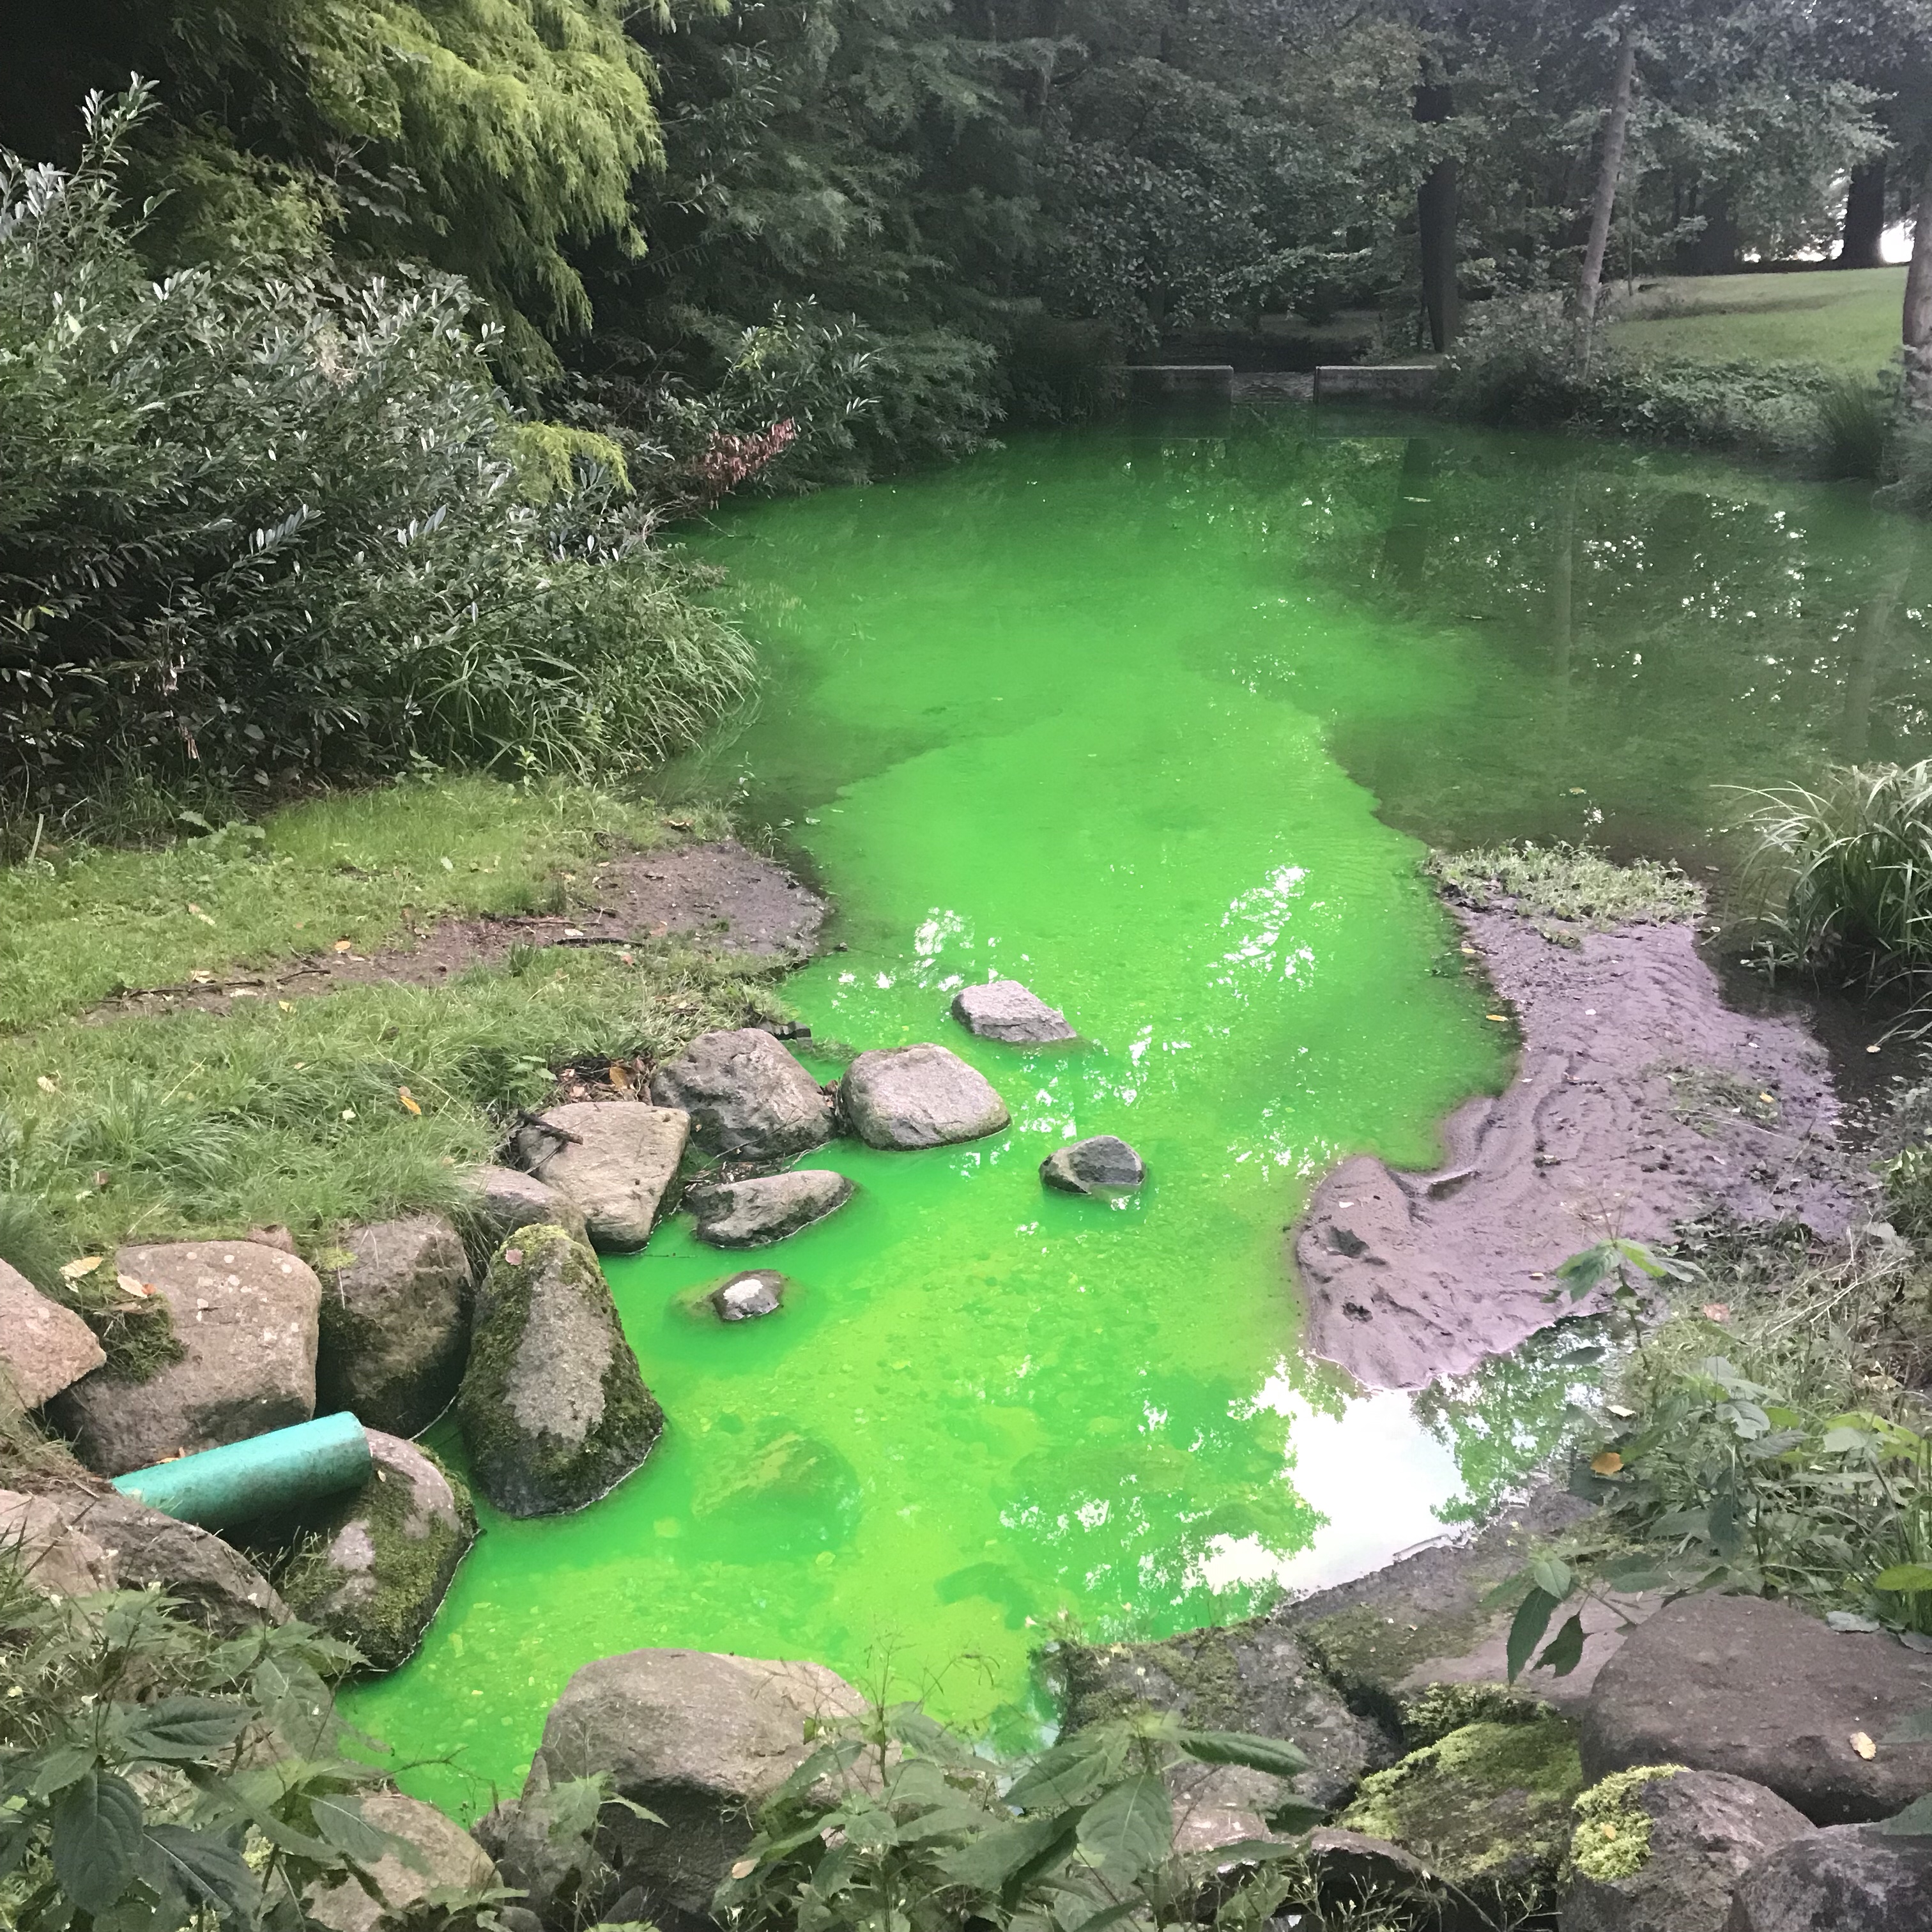
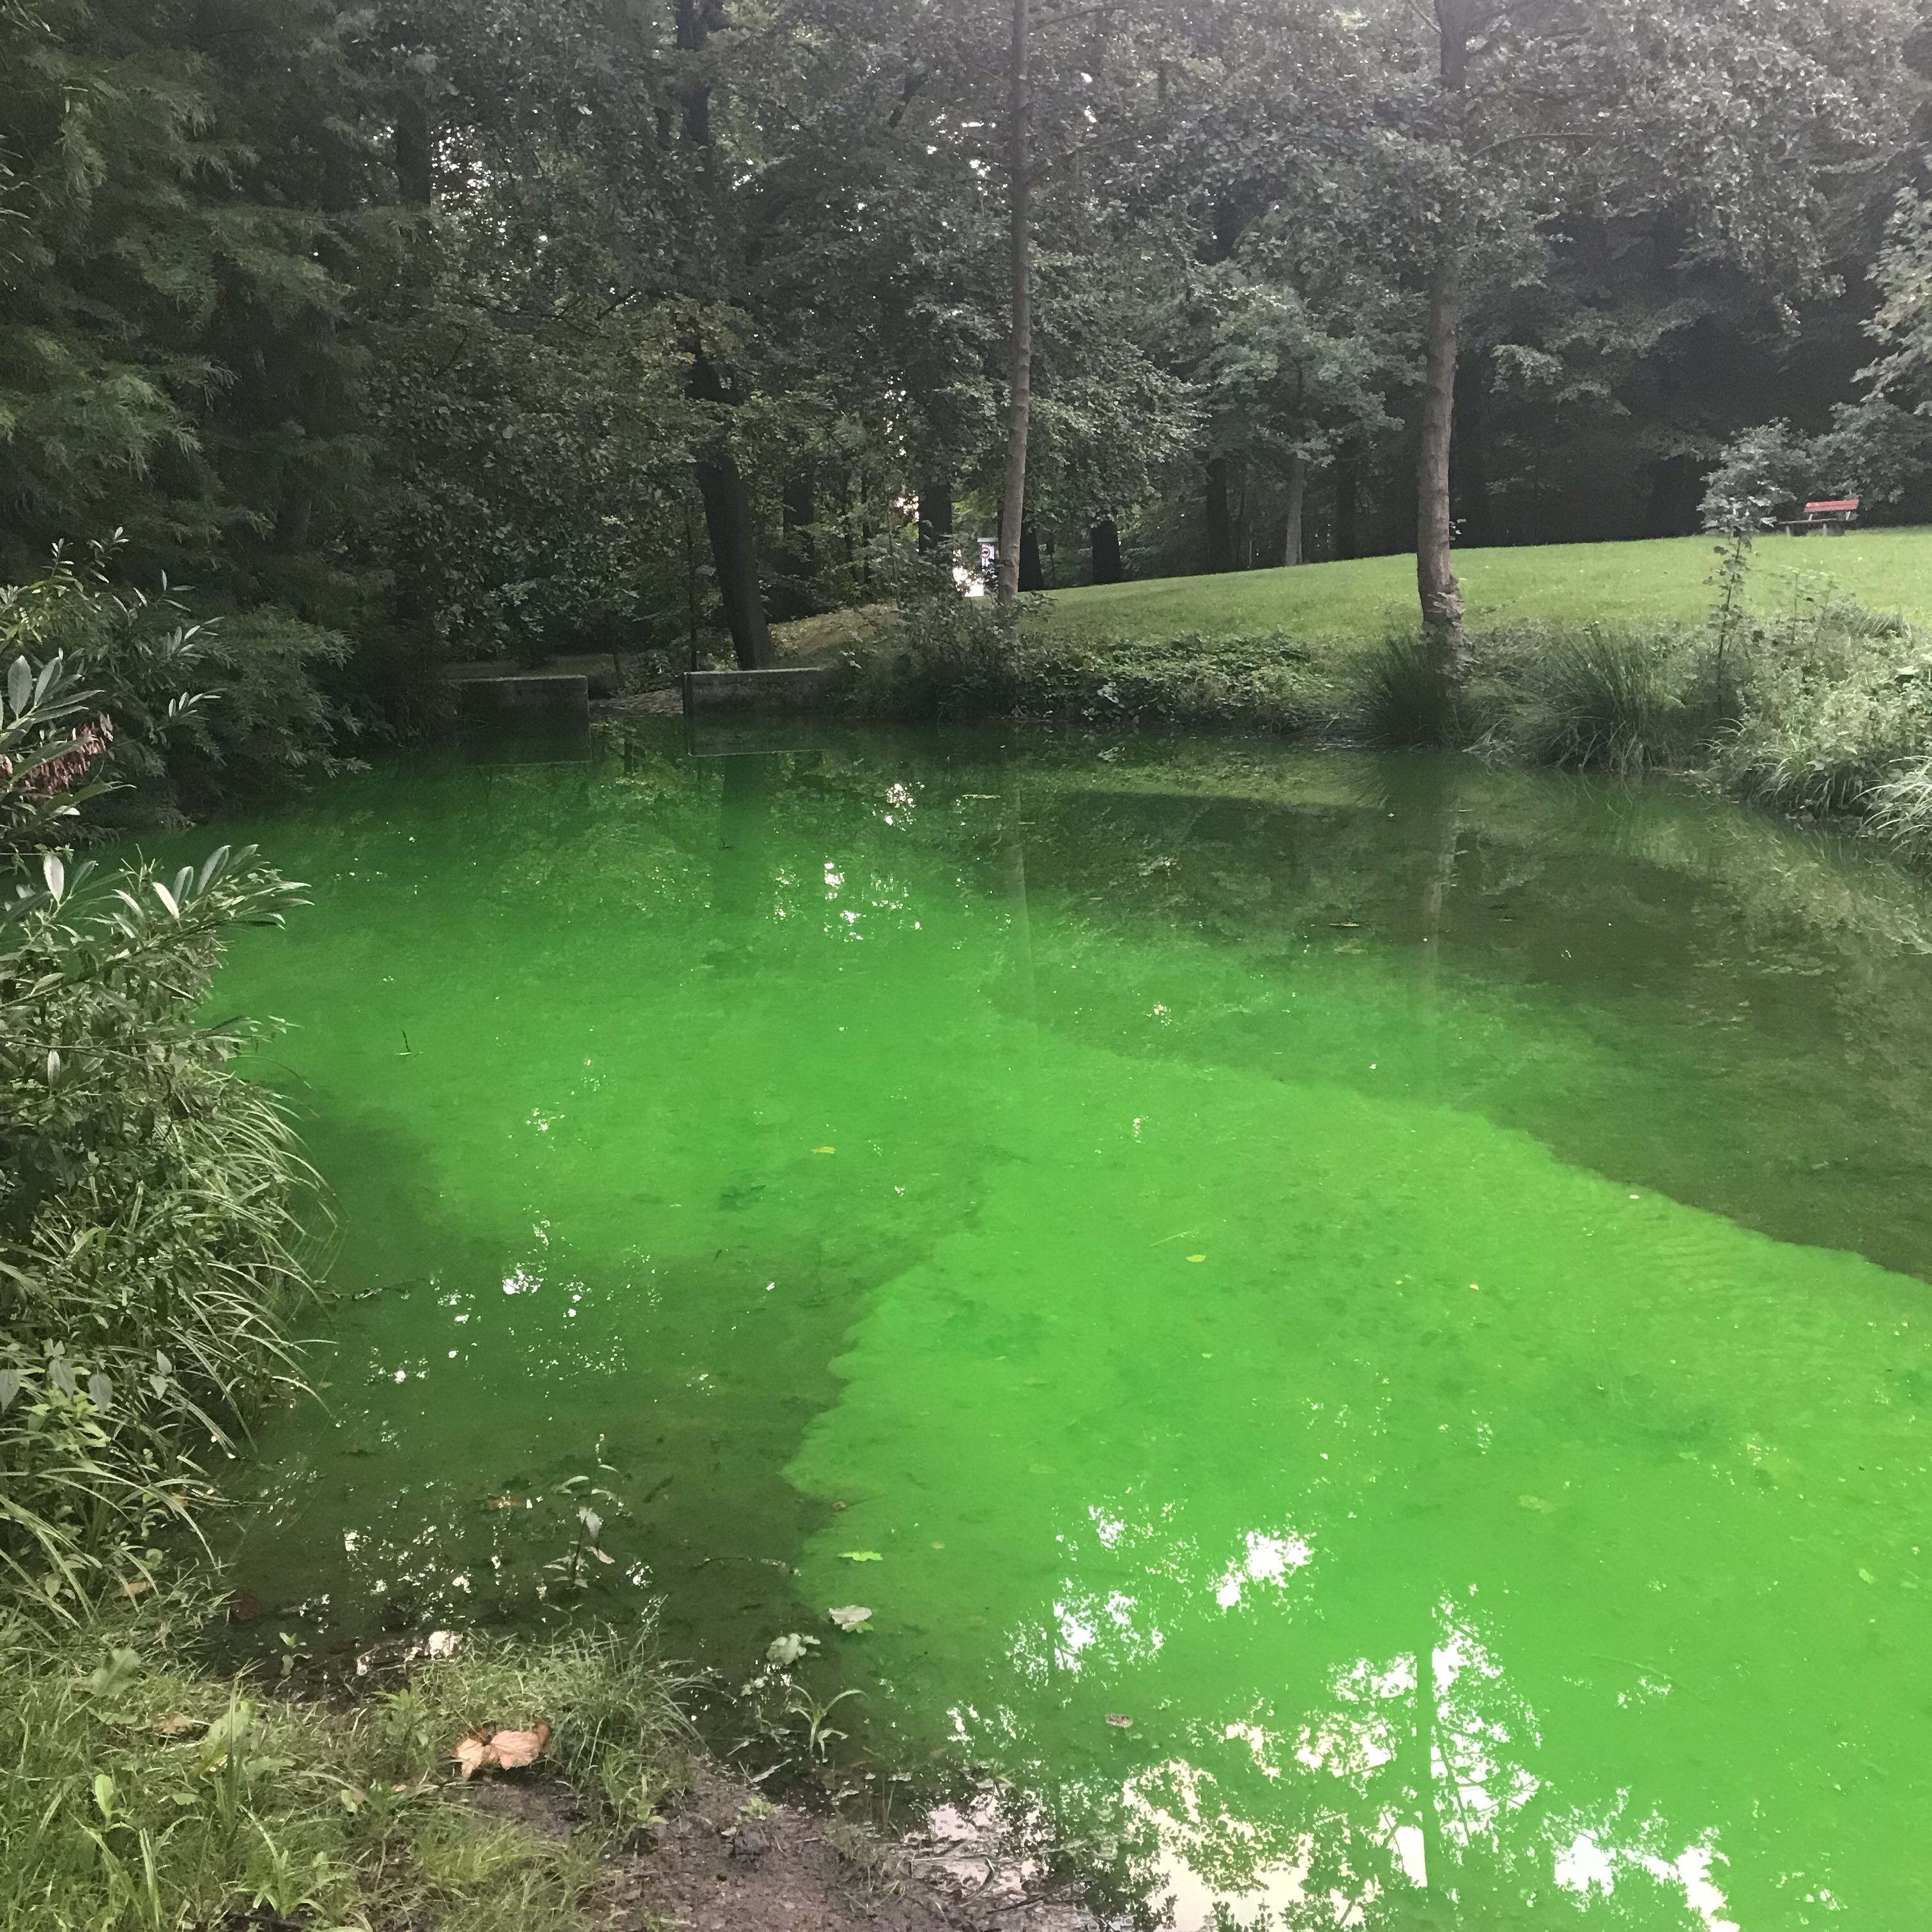
The lake is still bright green and very well mixed, similar to what it looked like in this post. But what is a lot easier to see now is the green water coming out into the Kiel fjord. It was very hard to see on the pictures I took the other day on our fluorescent night walk, and I didn’t see any by eye the first couple of days, but for the last days it has been clearly visible:

It’s still a lot clearer by eye than on the pictures, but even in these pictures you see the plume going out of the storm drain, don’t you?

In other news: my UV lamp arrived today and I am so excited!

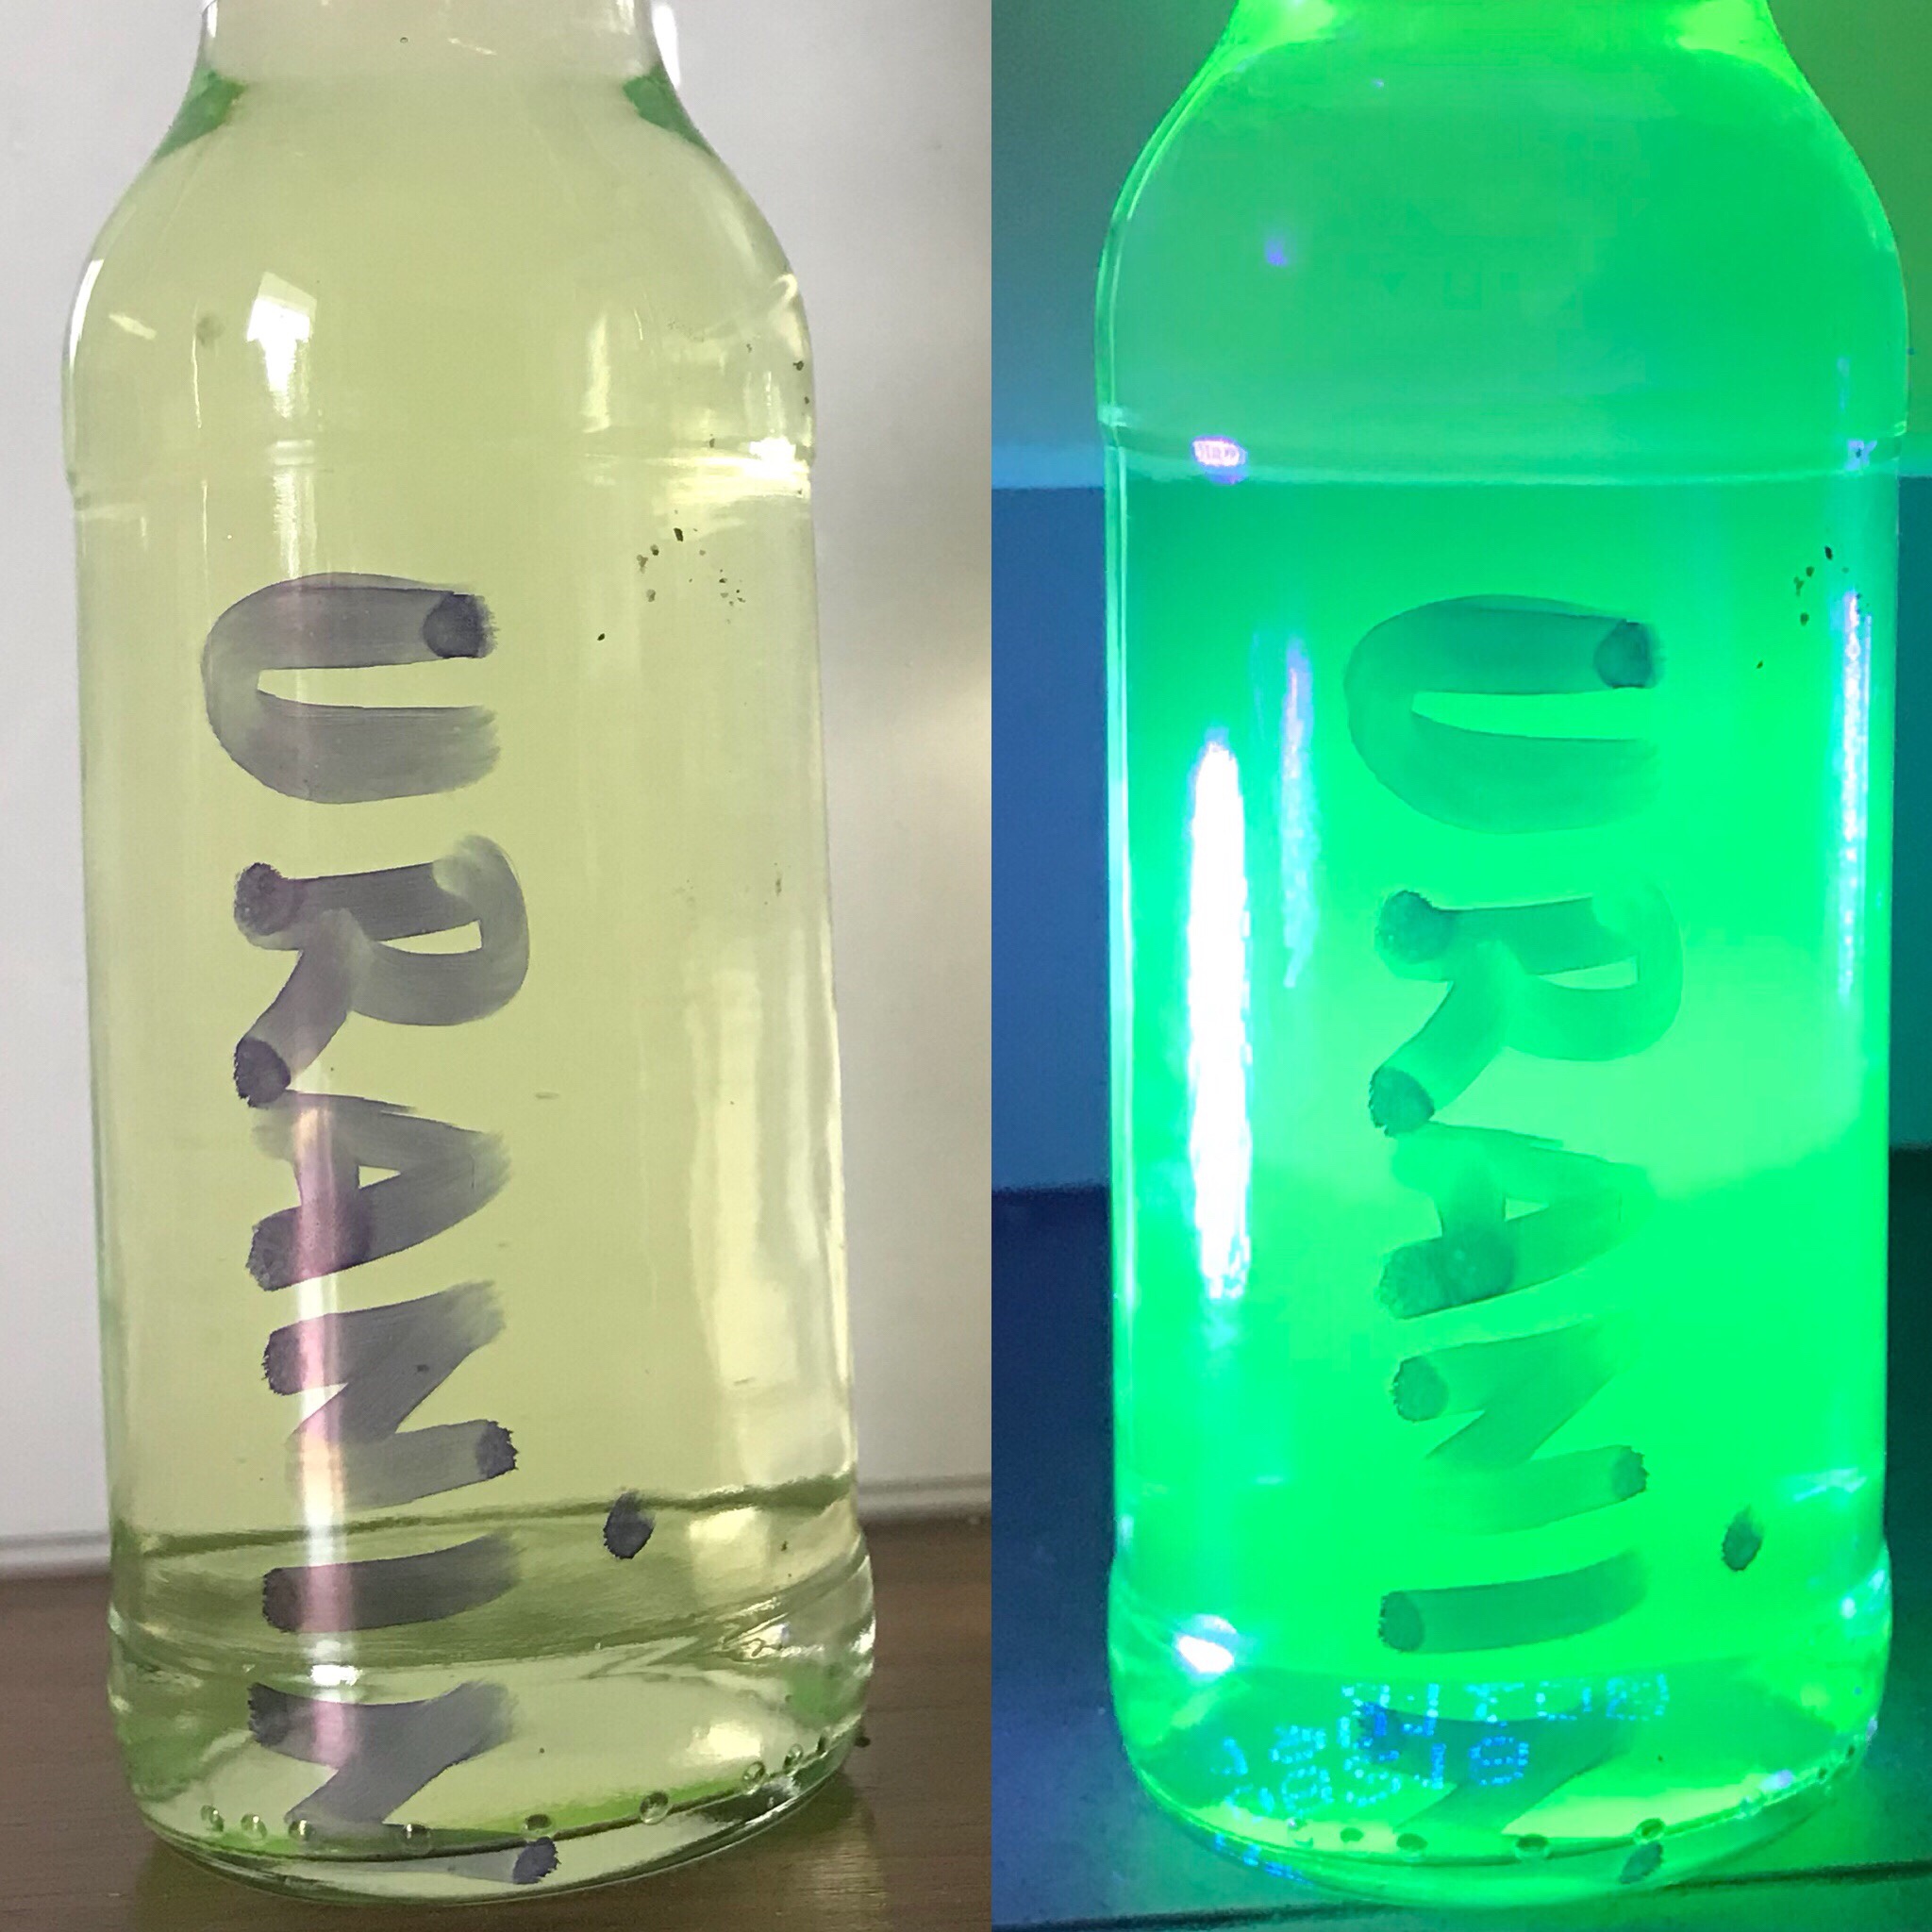
So here is a water sample I took out of the green stream, photographed in normal daylight and then lit by my UV lamp. Pretty cool, ey? :-)

Who wants to come fluorescent water-spotting with me? :-)

Fluorescent night walk — following the stream through the lake into Kiel fjord!

Luckily some of my friends are crazy enough to bring the UV lamps and go on a night walk with me, following the green fluorescent stream! (Don’t know what I am talking about? Check out the previous posts (post 1, post 2) on why there is fluorescent dye in a lake across my street and why that is exciting)

Following the water

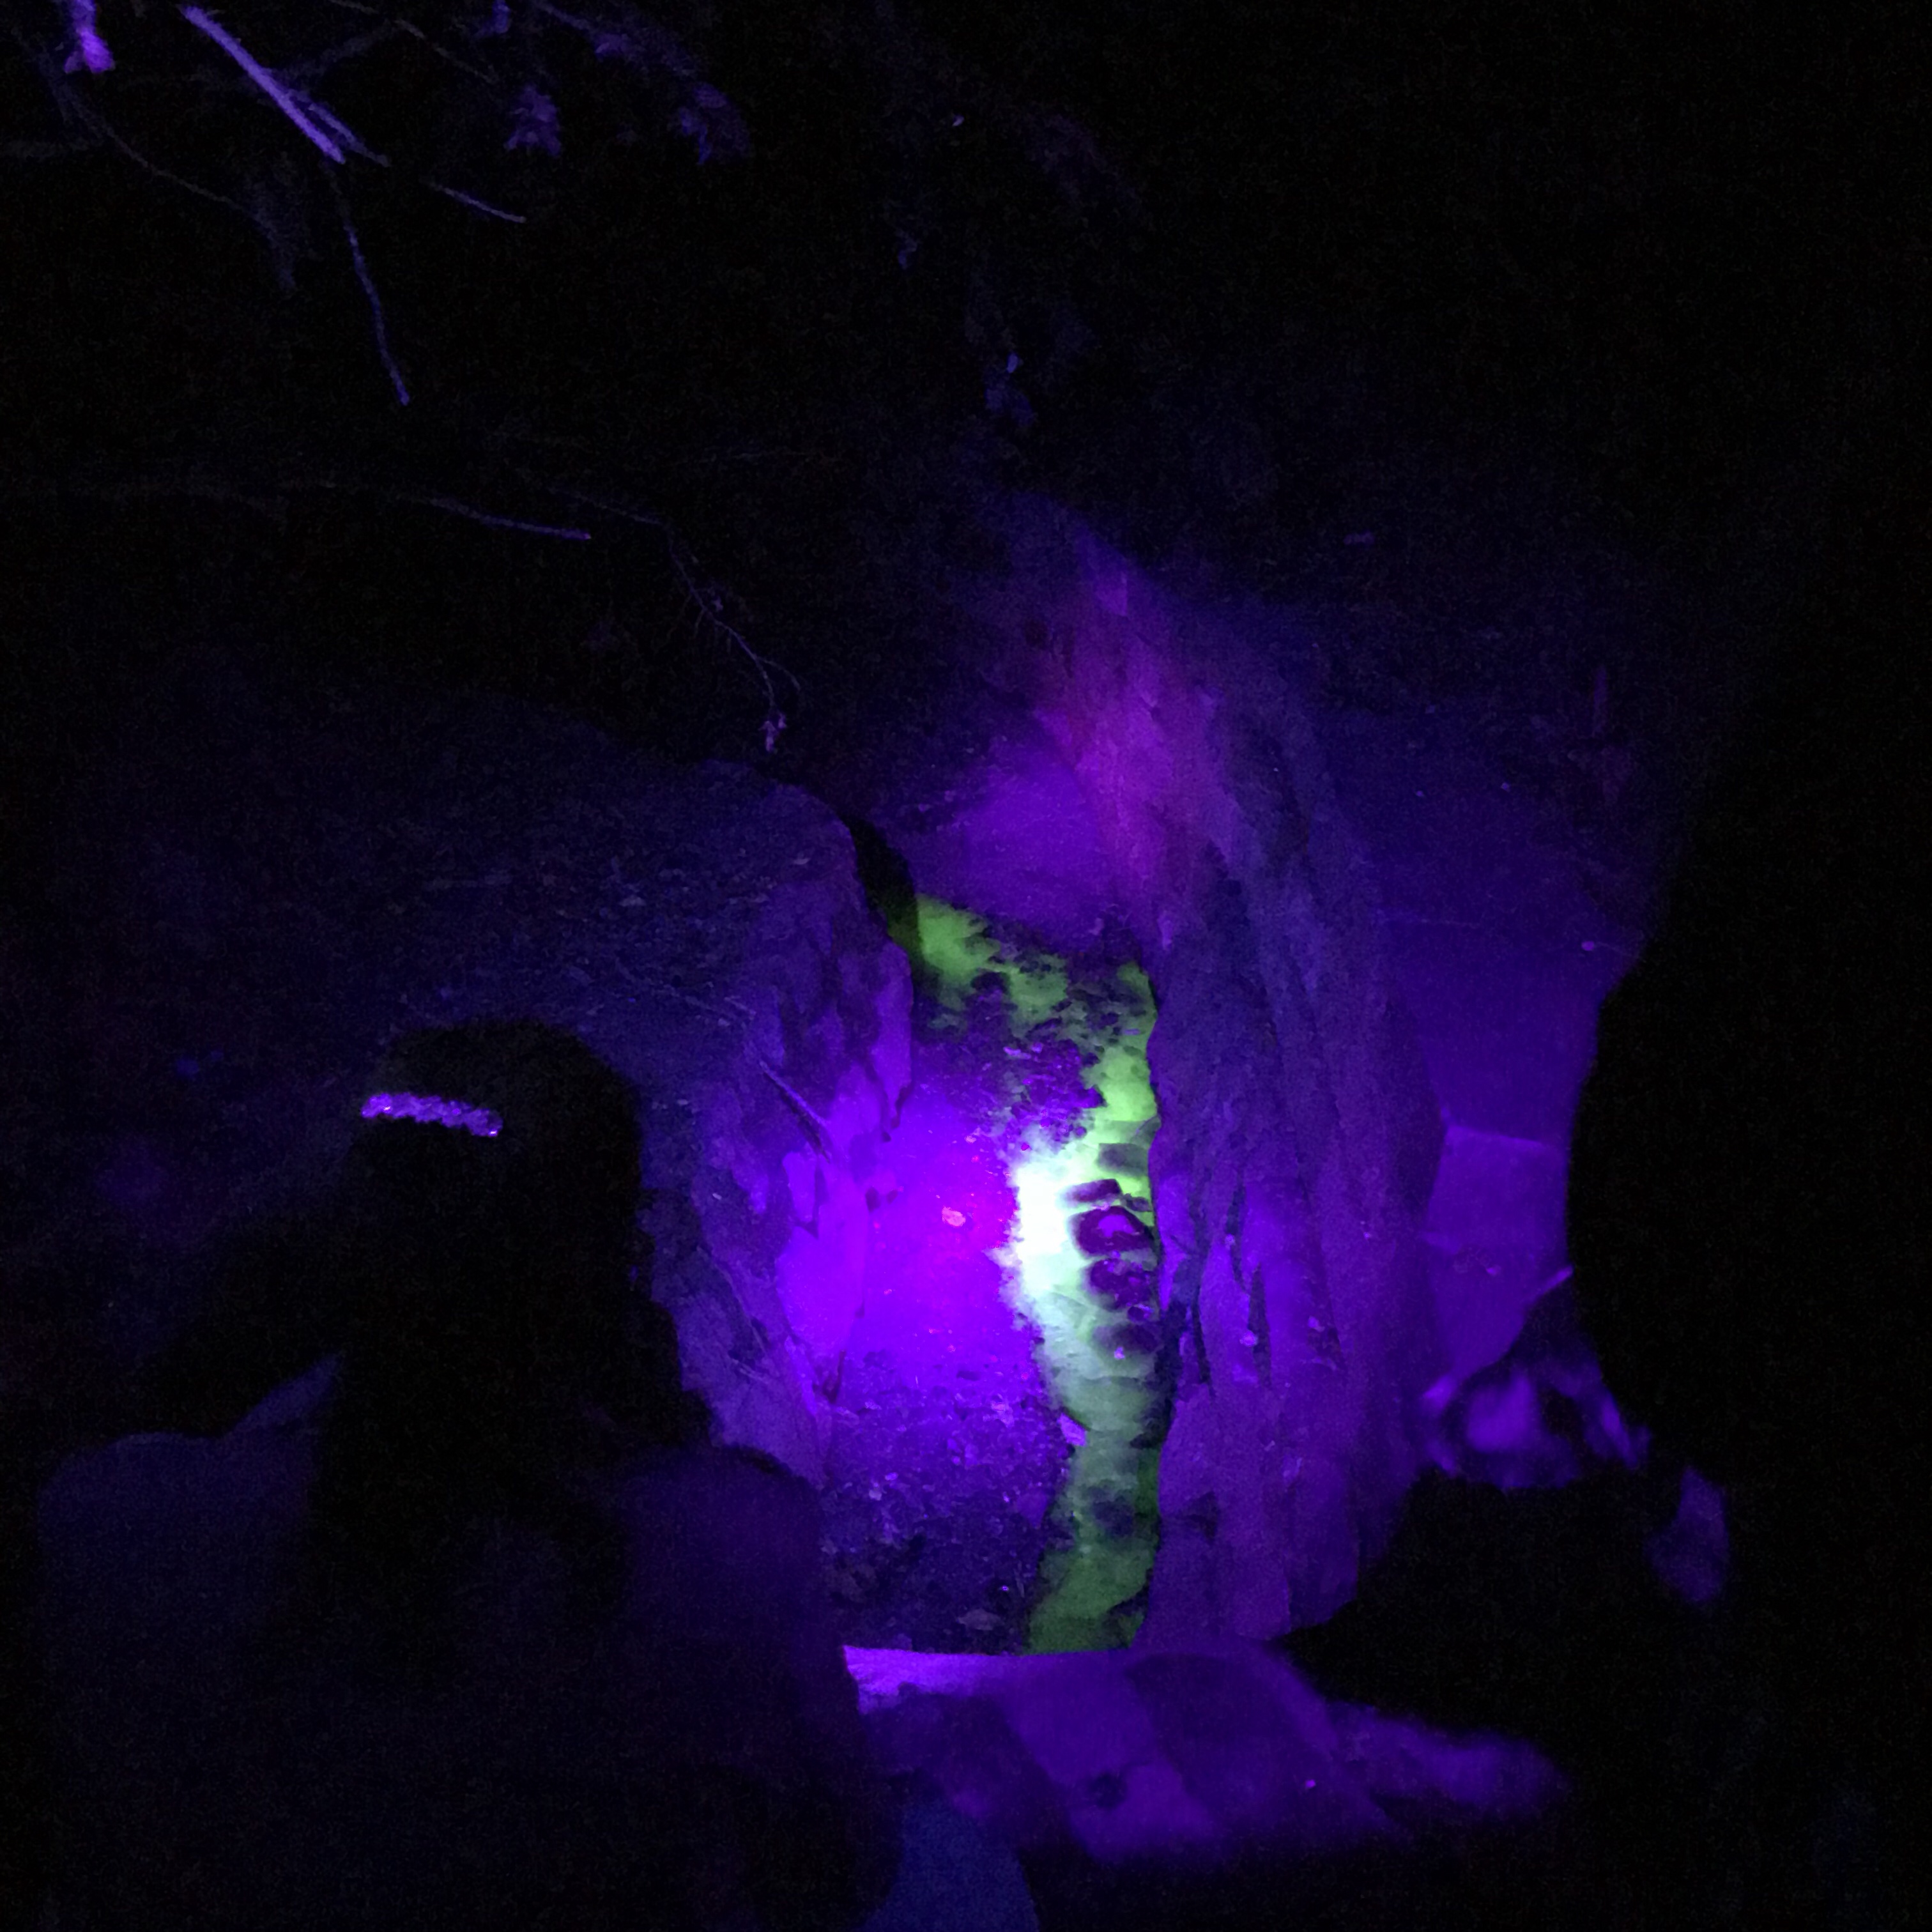
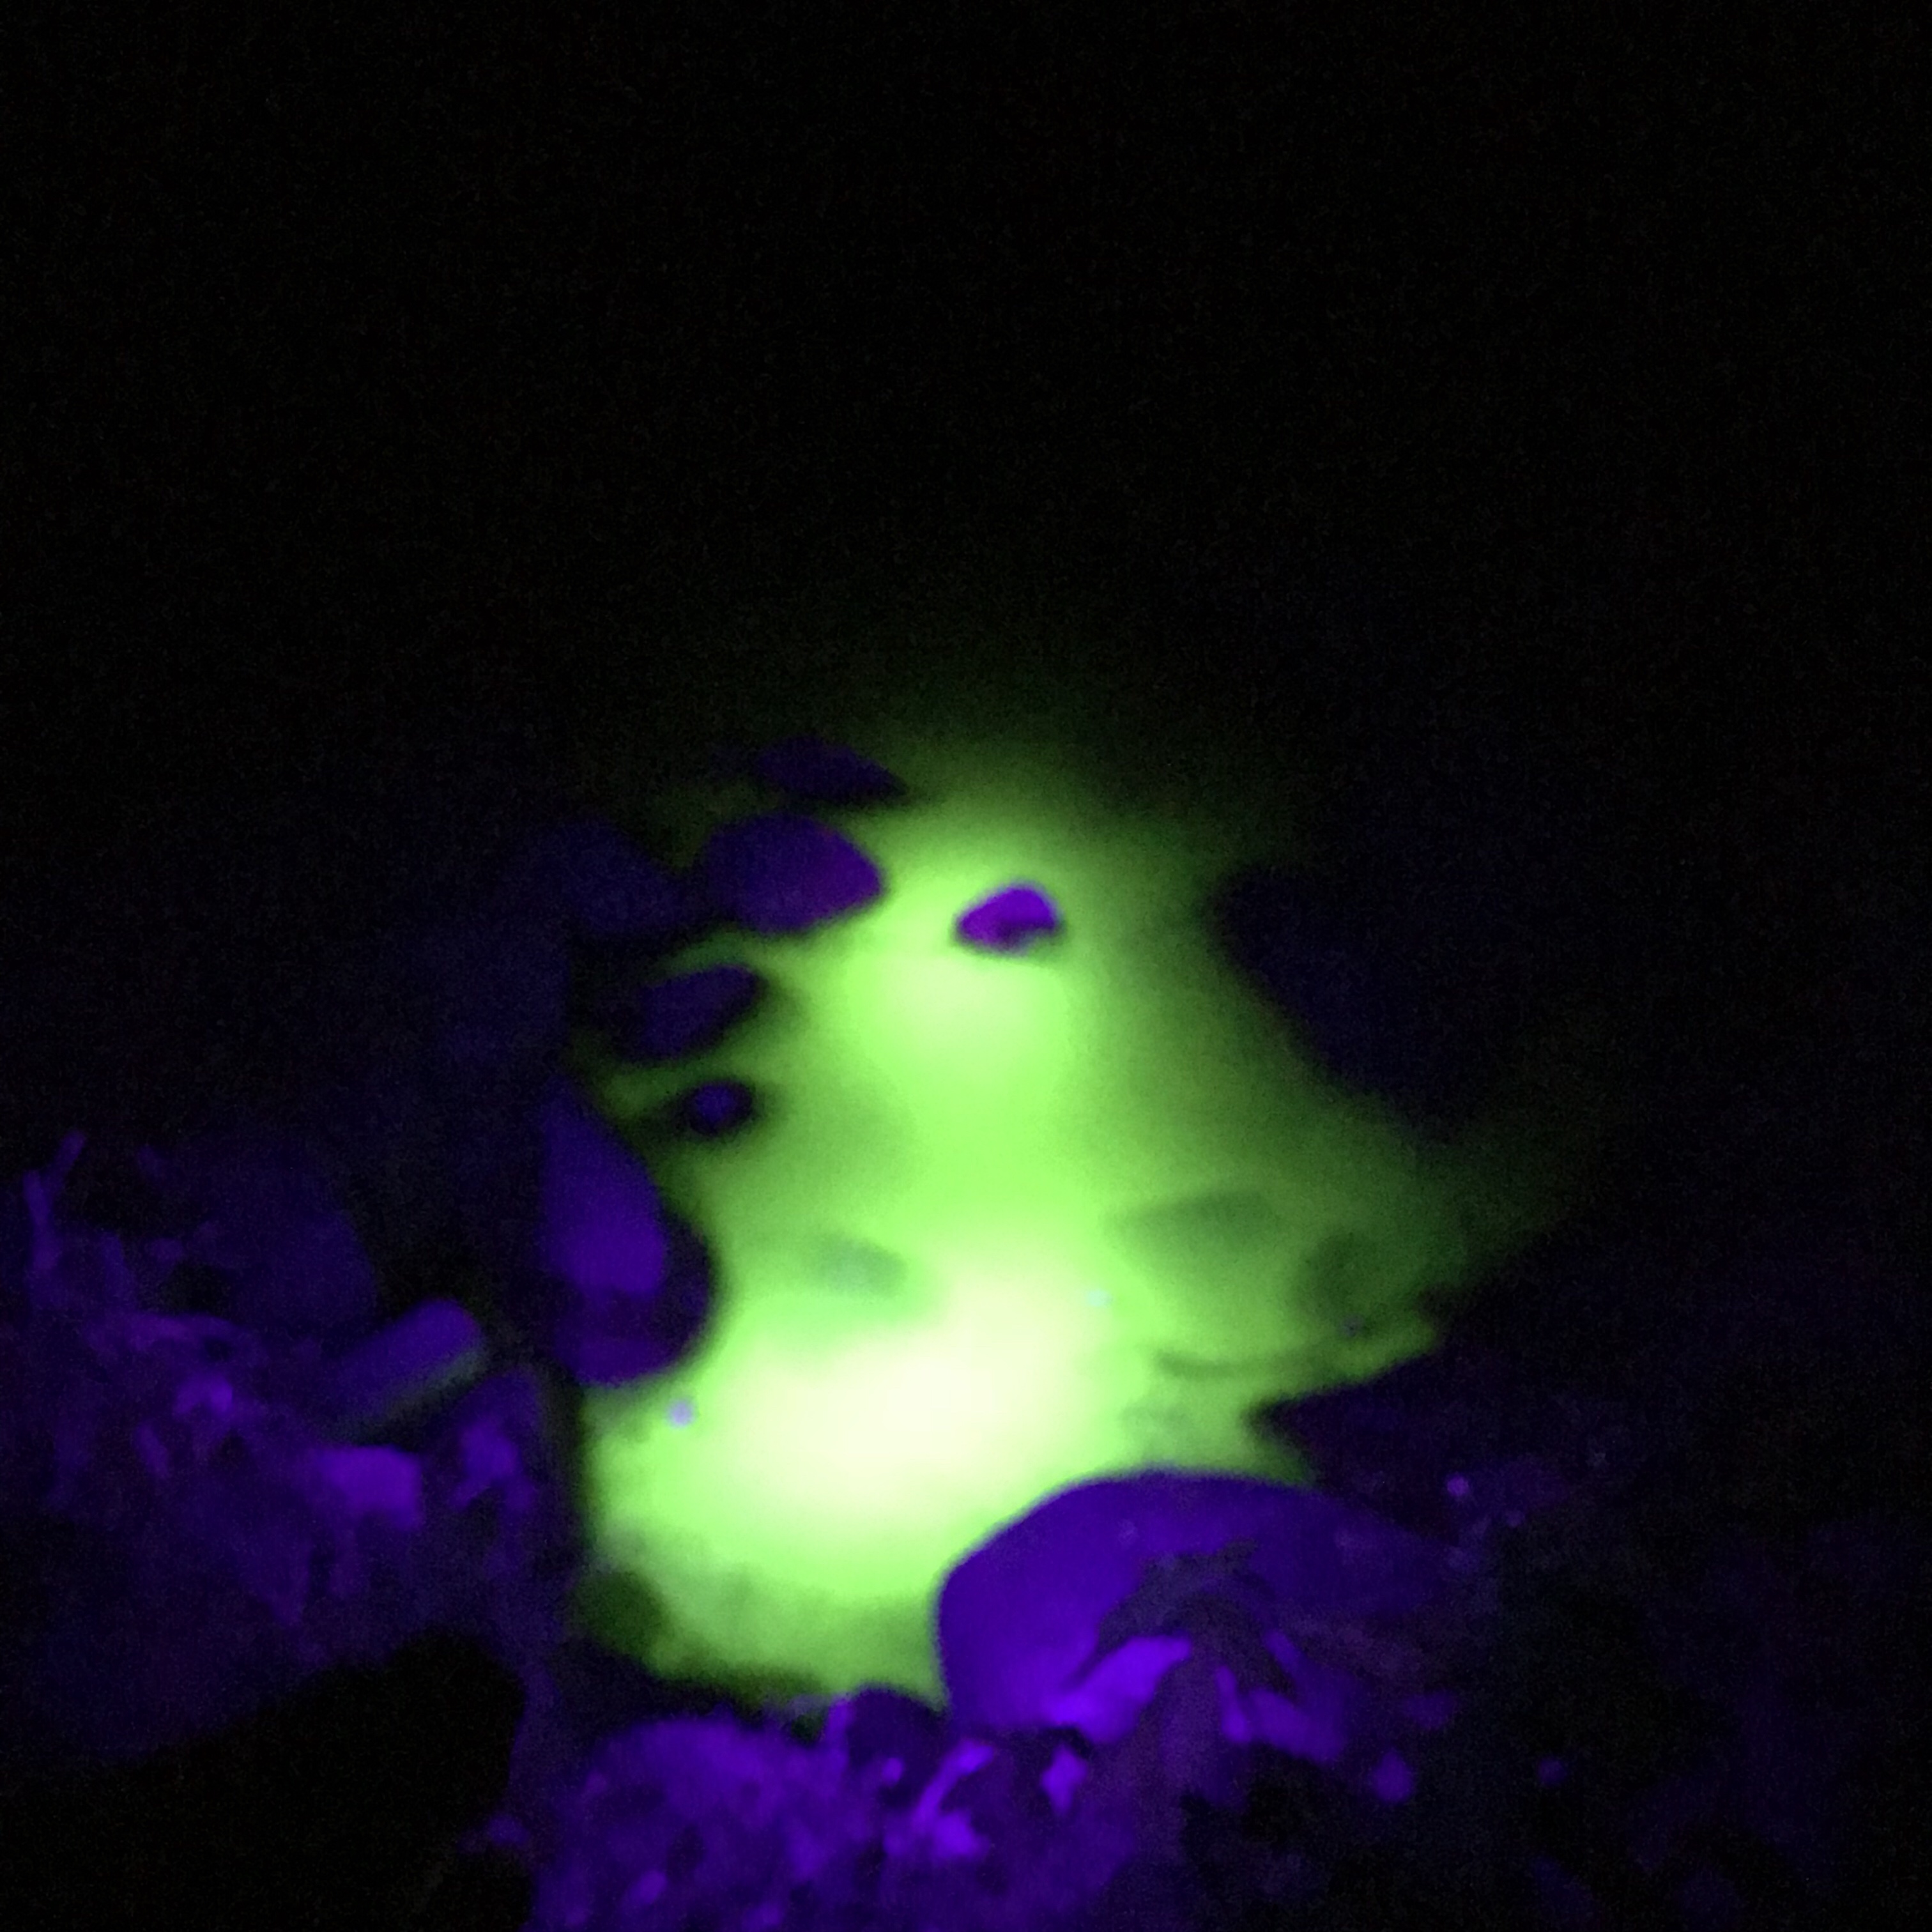
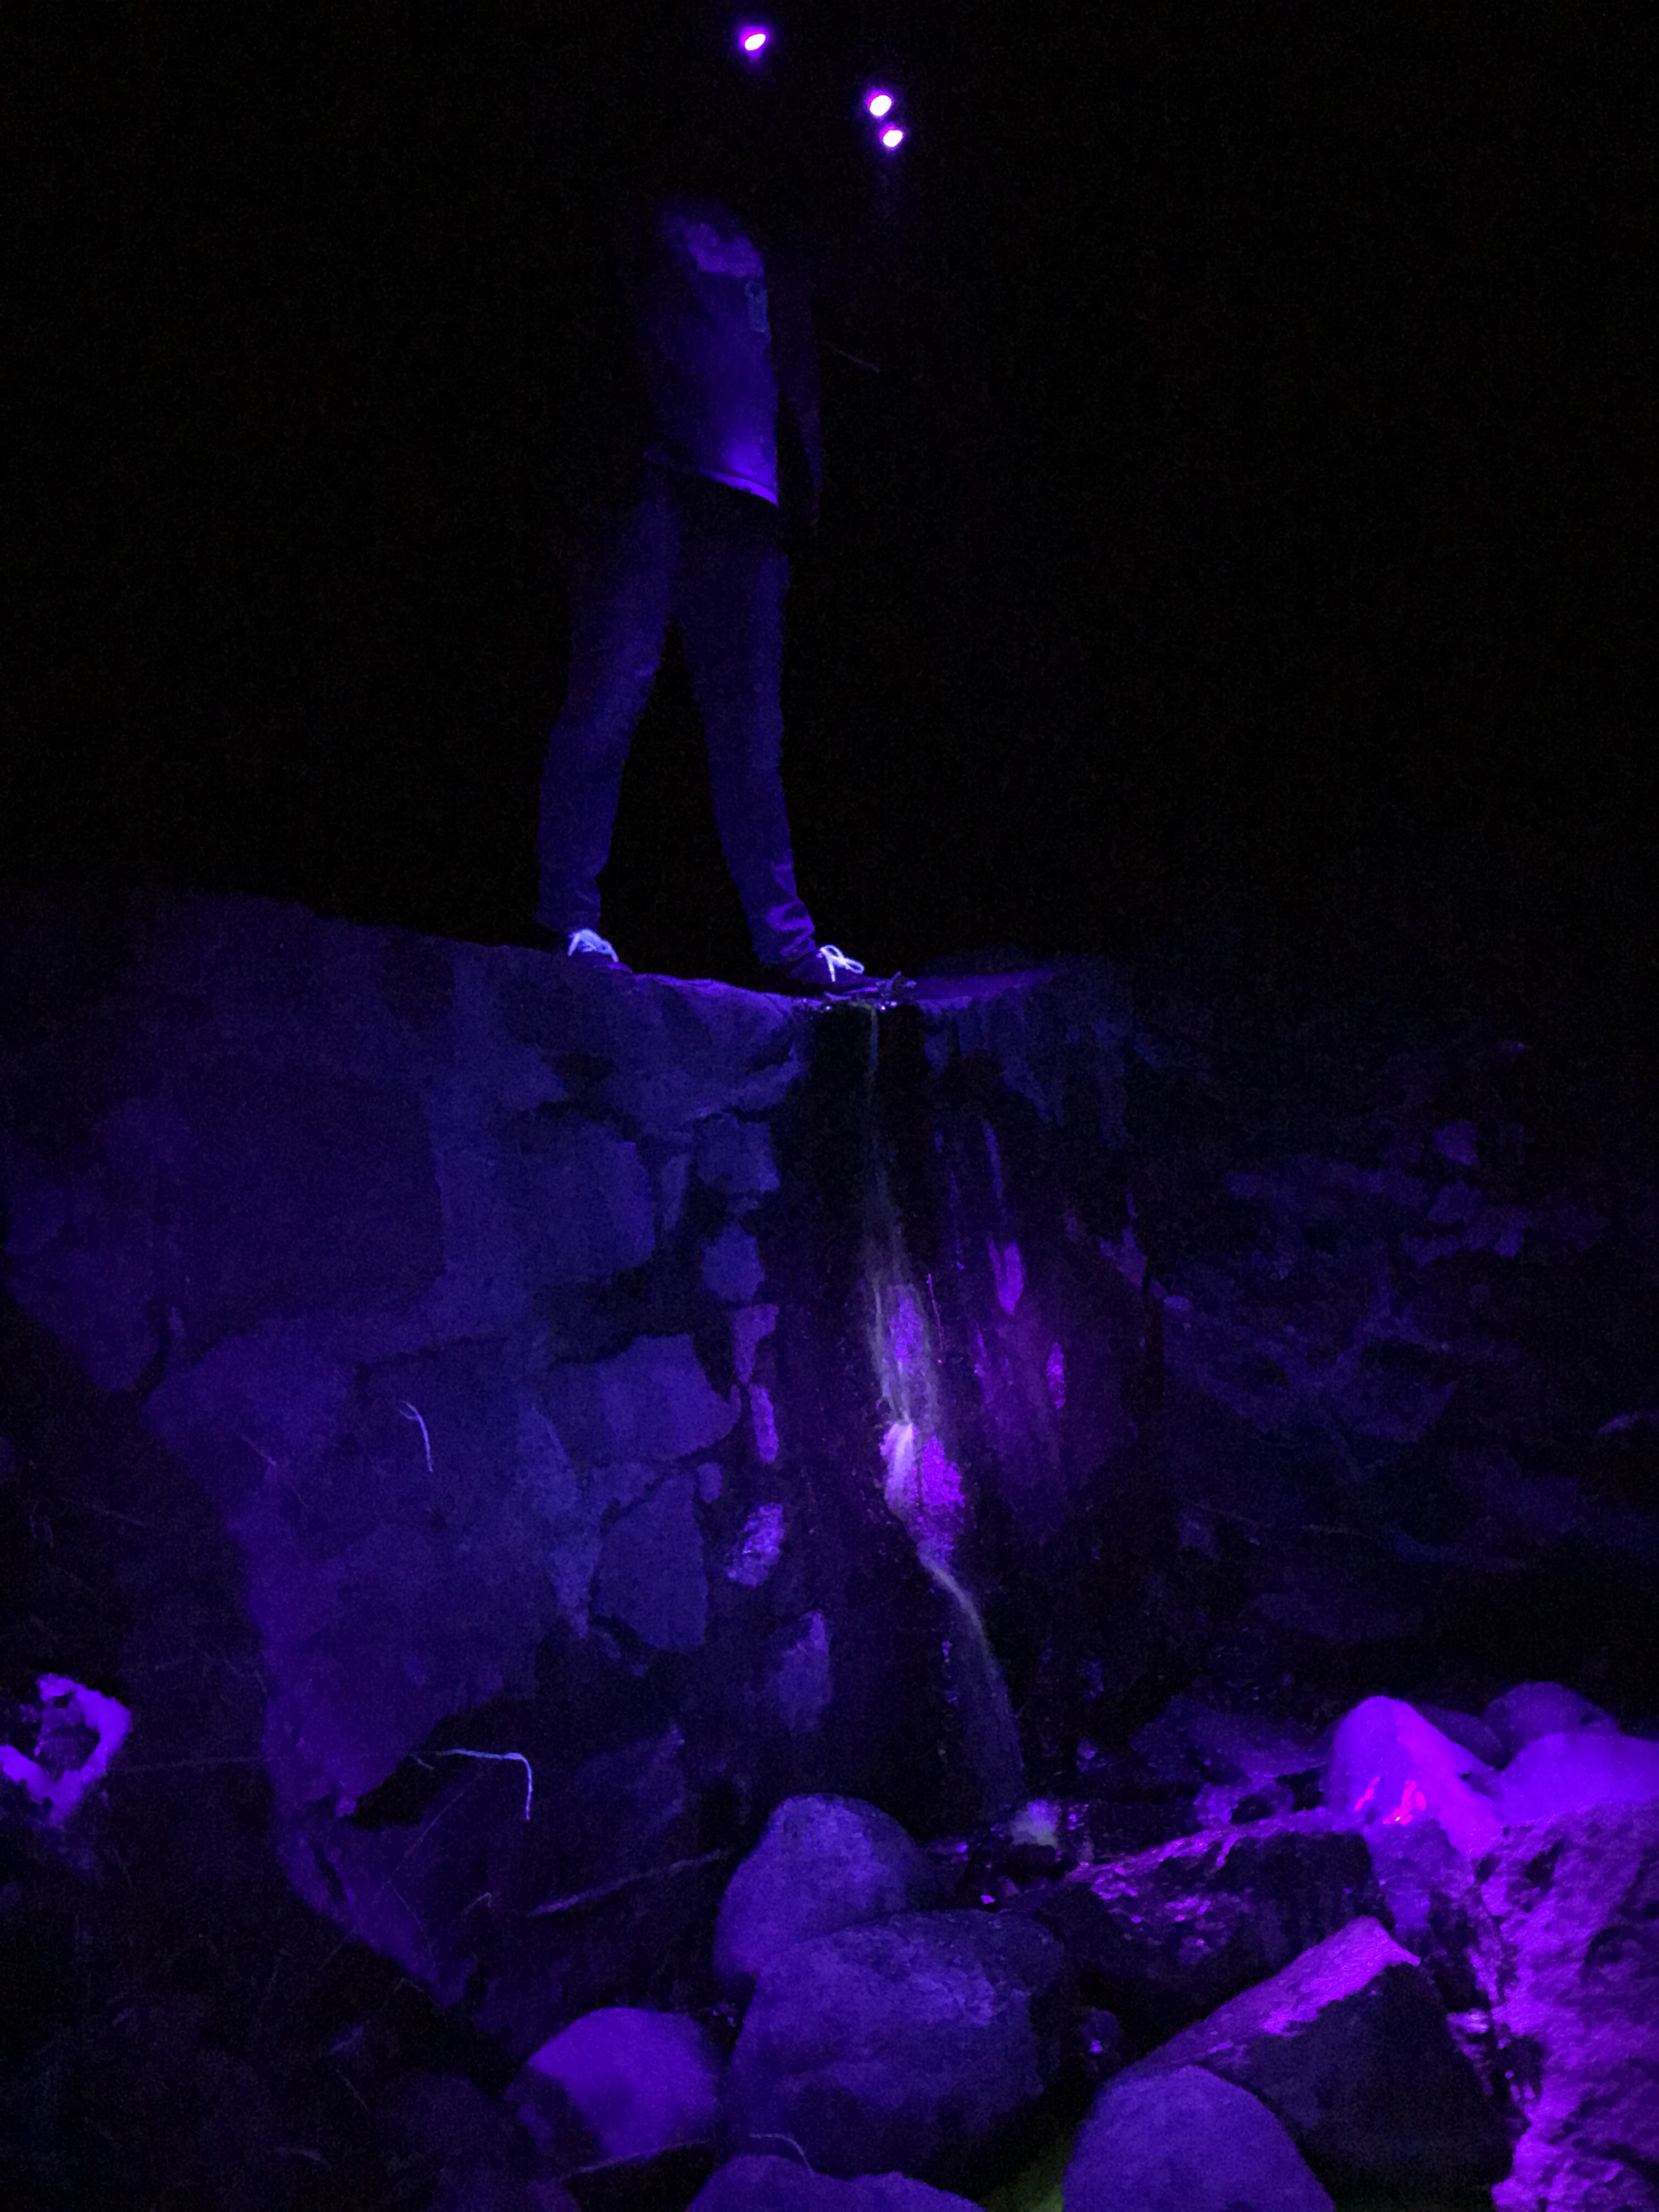
It looks very spooky when all of a sudden in the middle of a park you come across something looking like the picture below. Well, you would probably not come across it if you didn’t know where to look, but you get my point. And once you found it, you can follow it downhill.

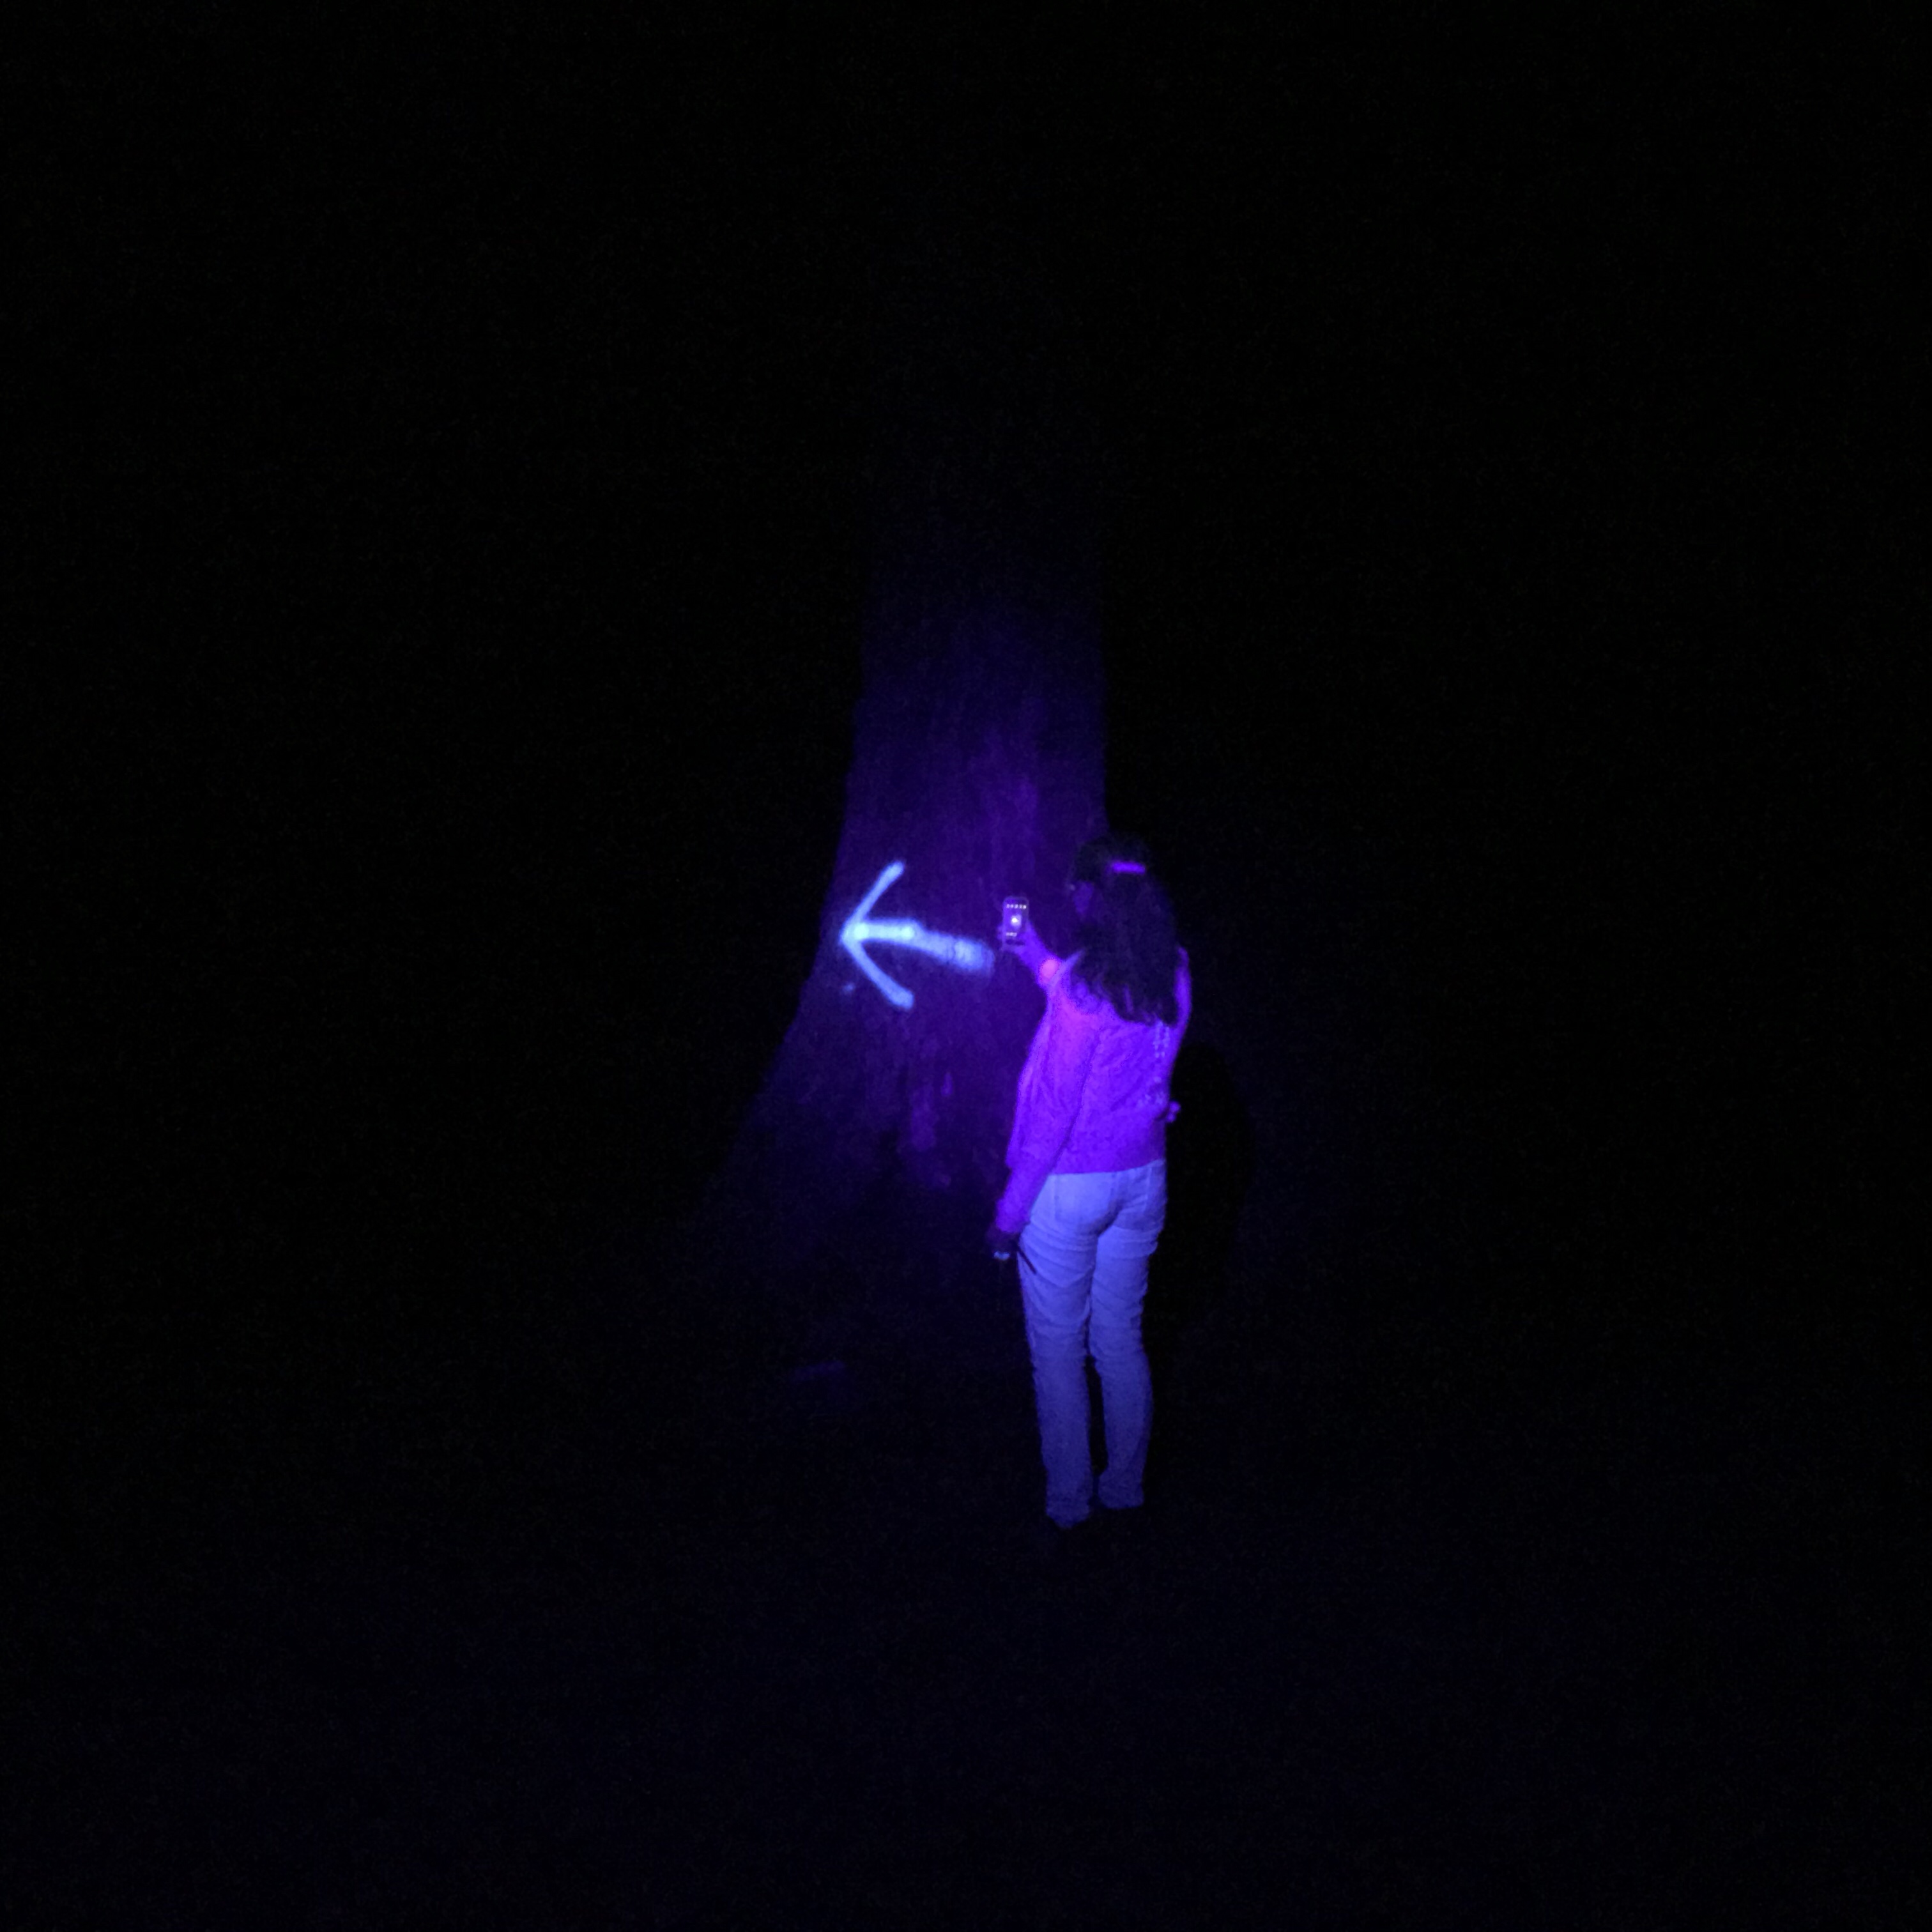
But don’t let yourself get distracted by signs on the trees, someone is trying to lead you in the wrong direction ;-)

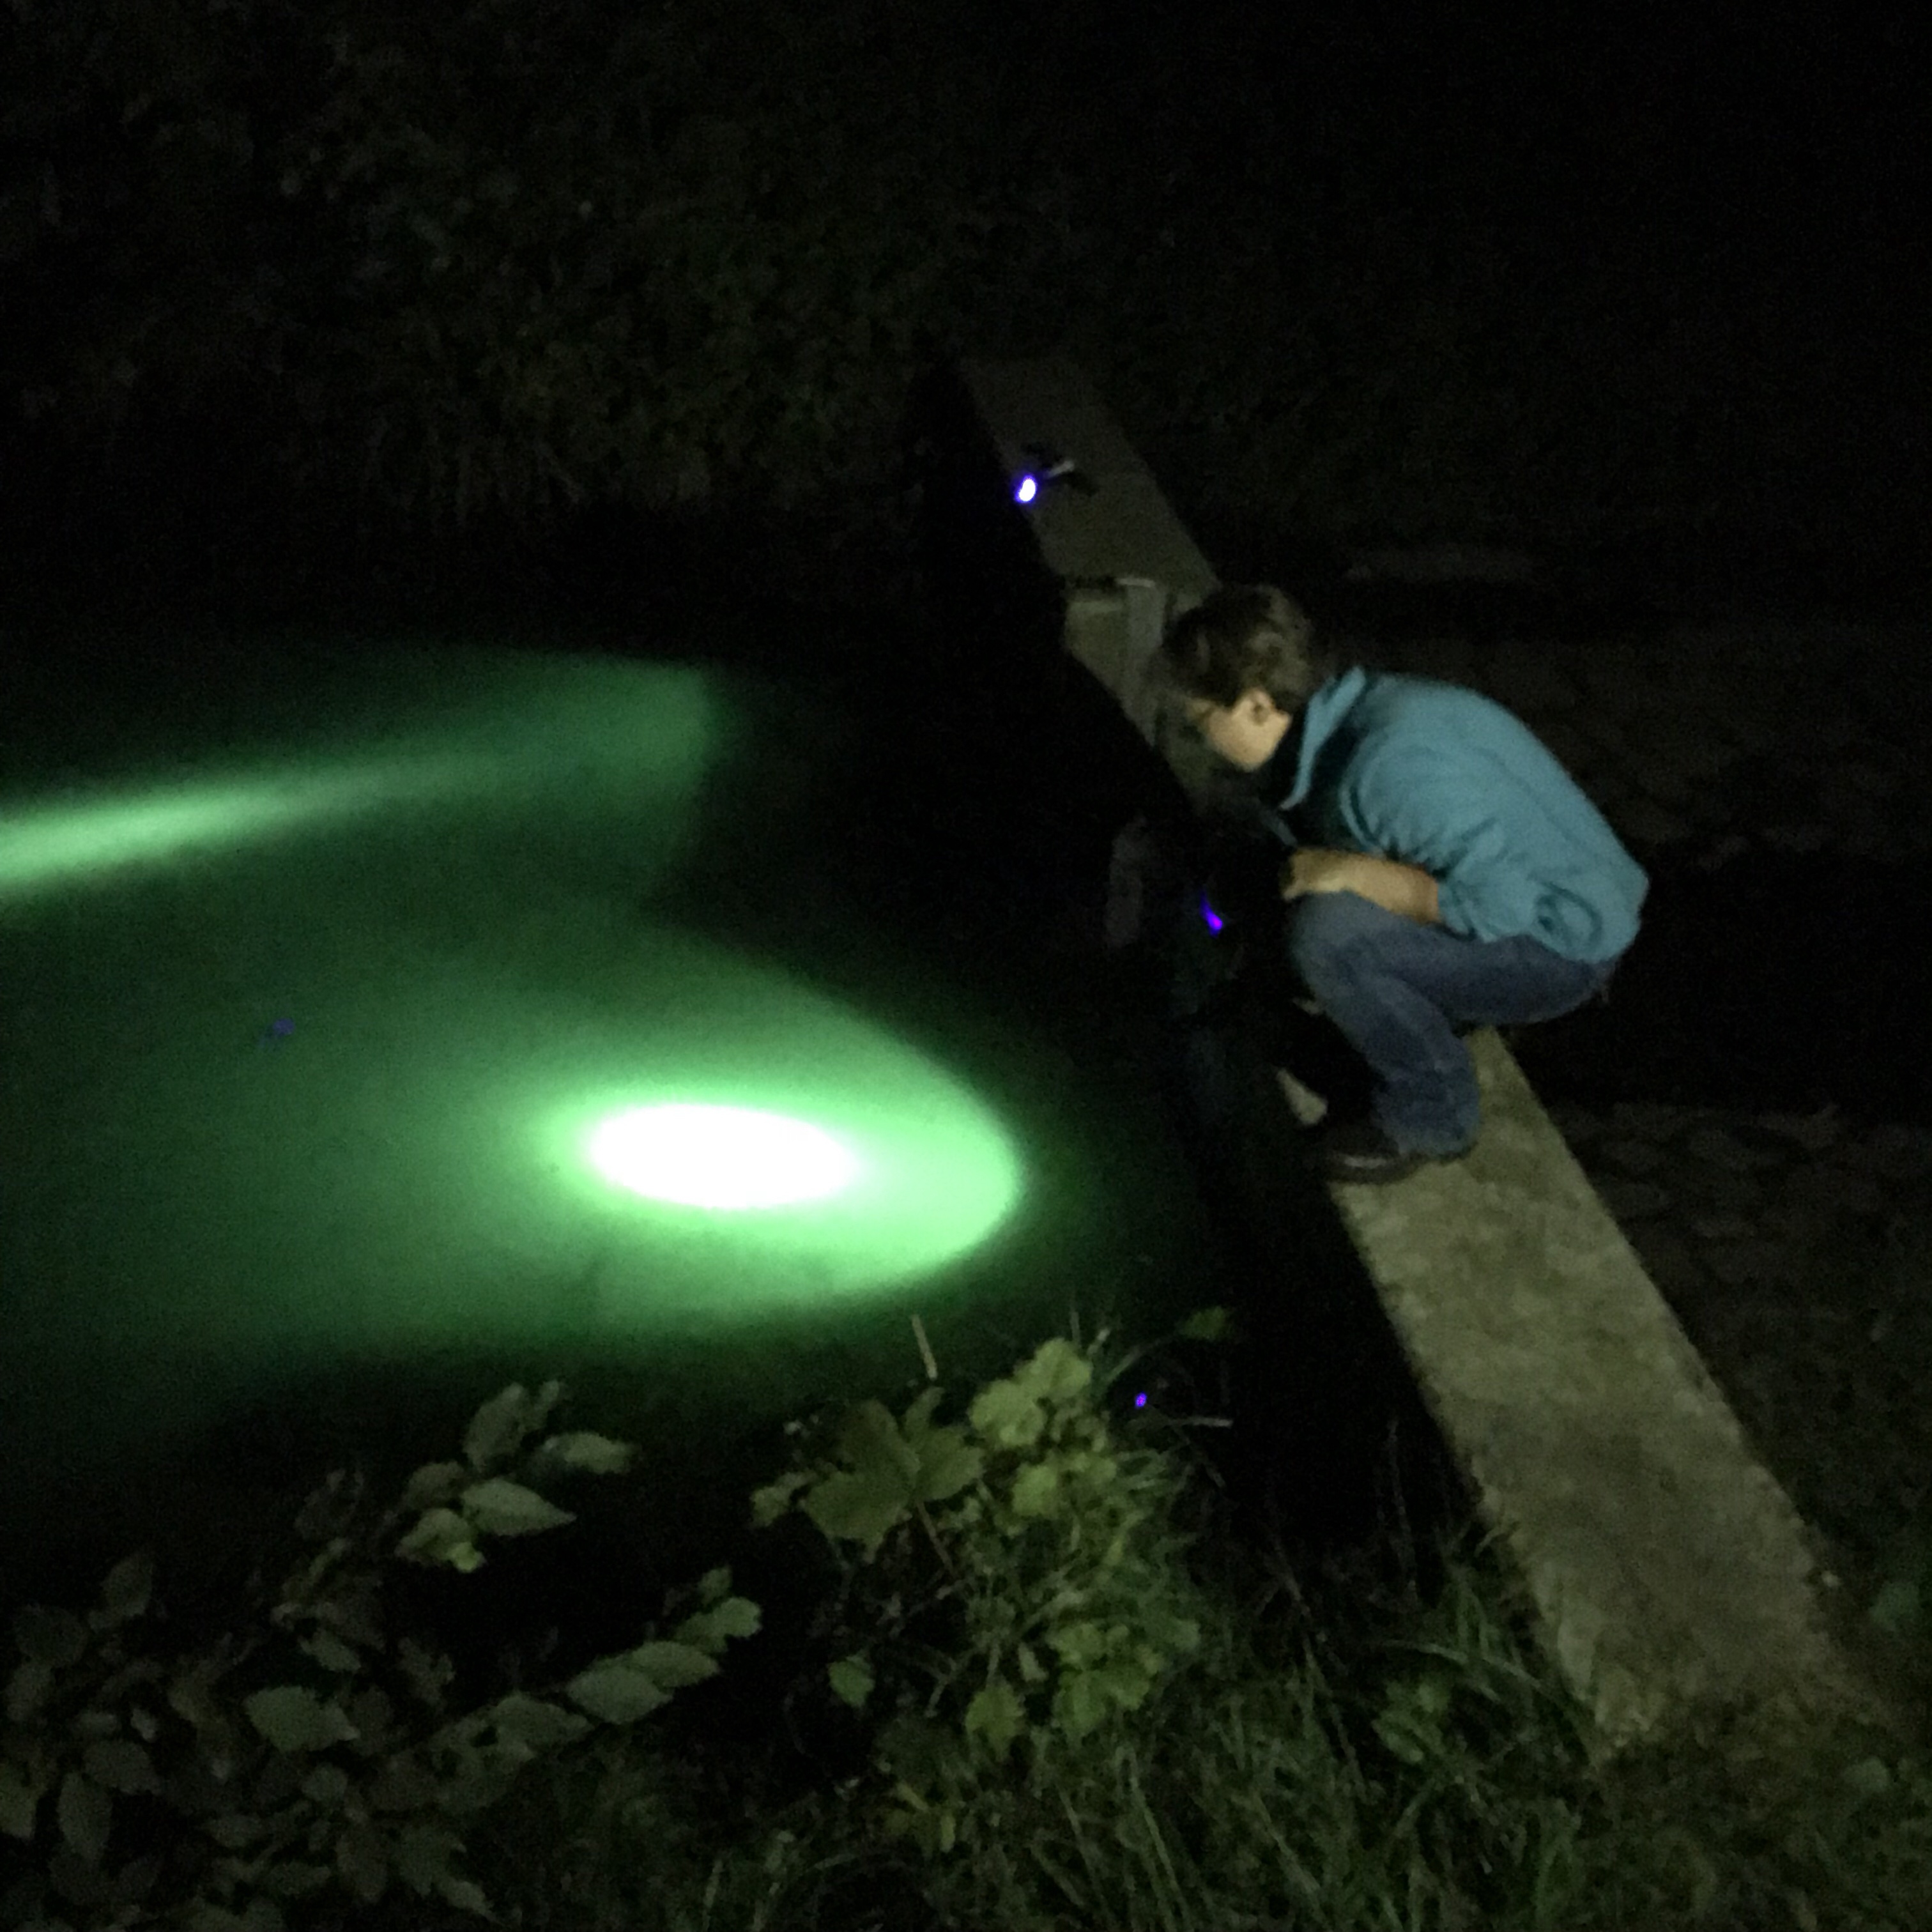
Because what we were looking for was, of course, the same lake I have been posting about today and yesterday, except now it looks like the picture below. If you thought it was creepy by day you know nothing of creepy!

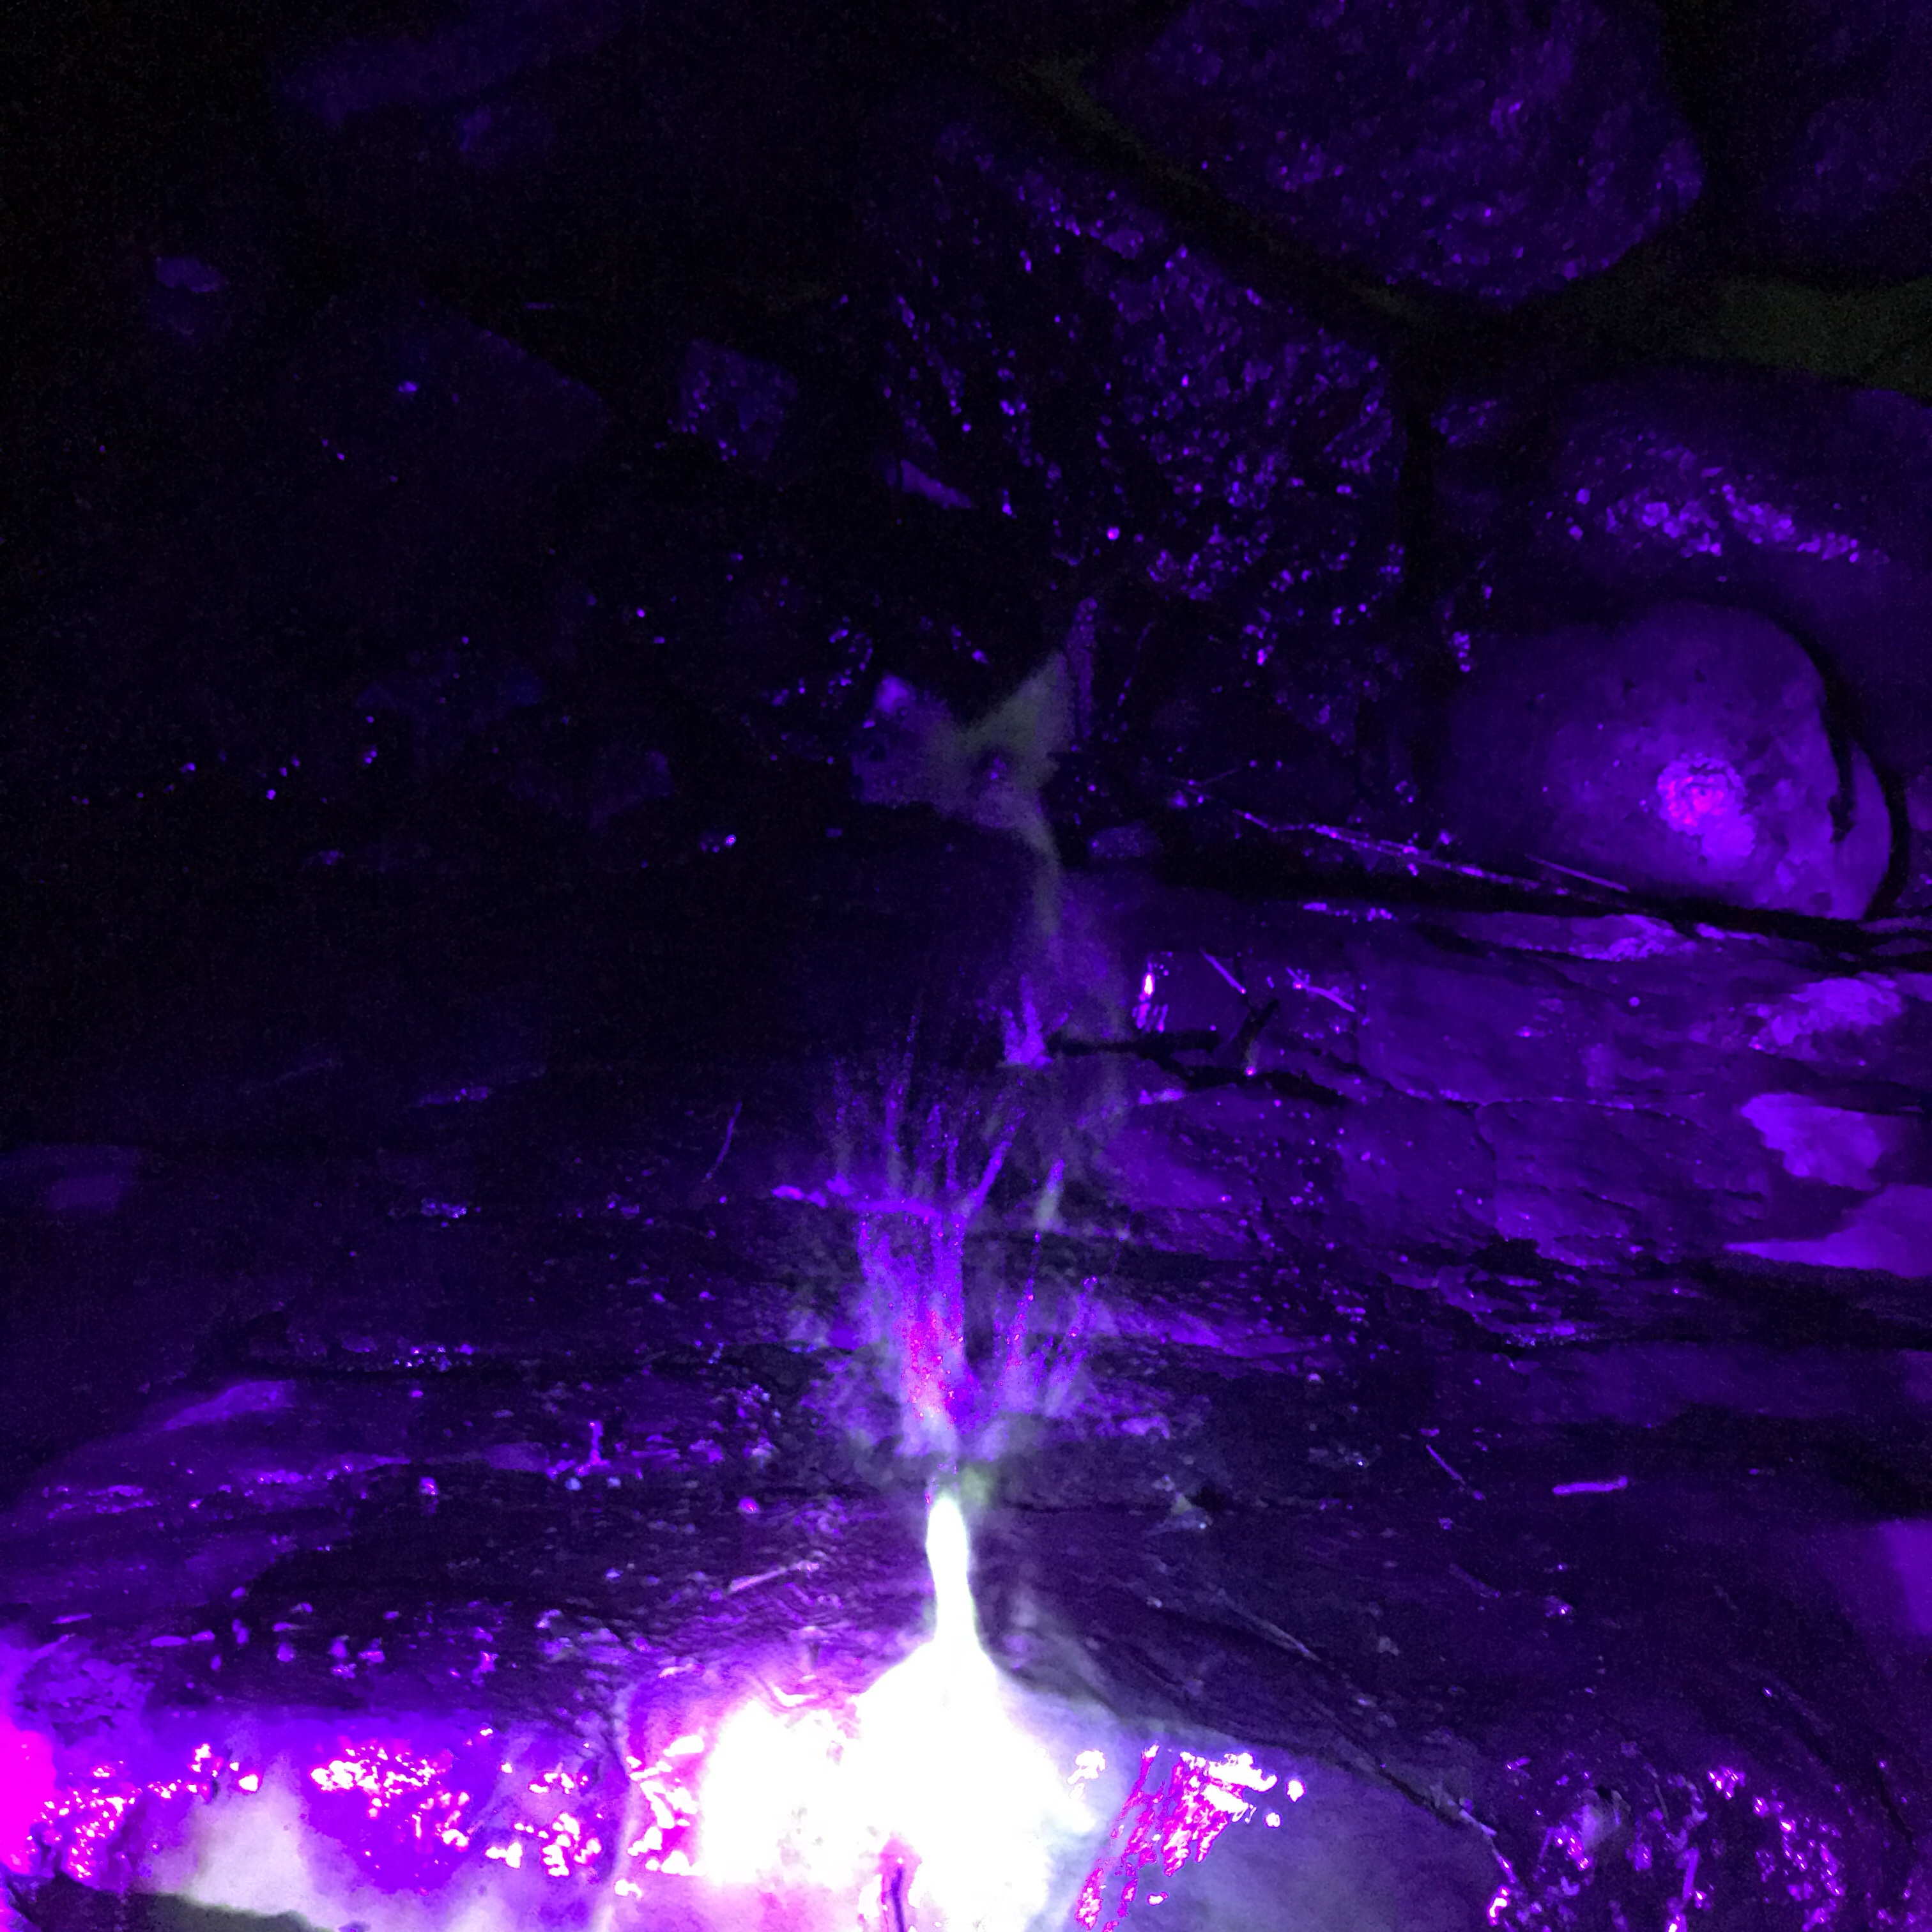
Creepy, but also fascinating! Of course I have to inspect it more closely.

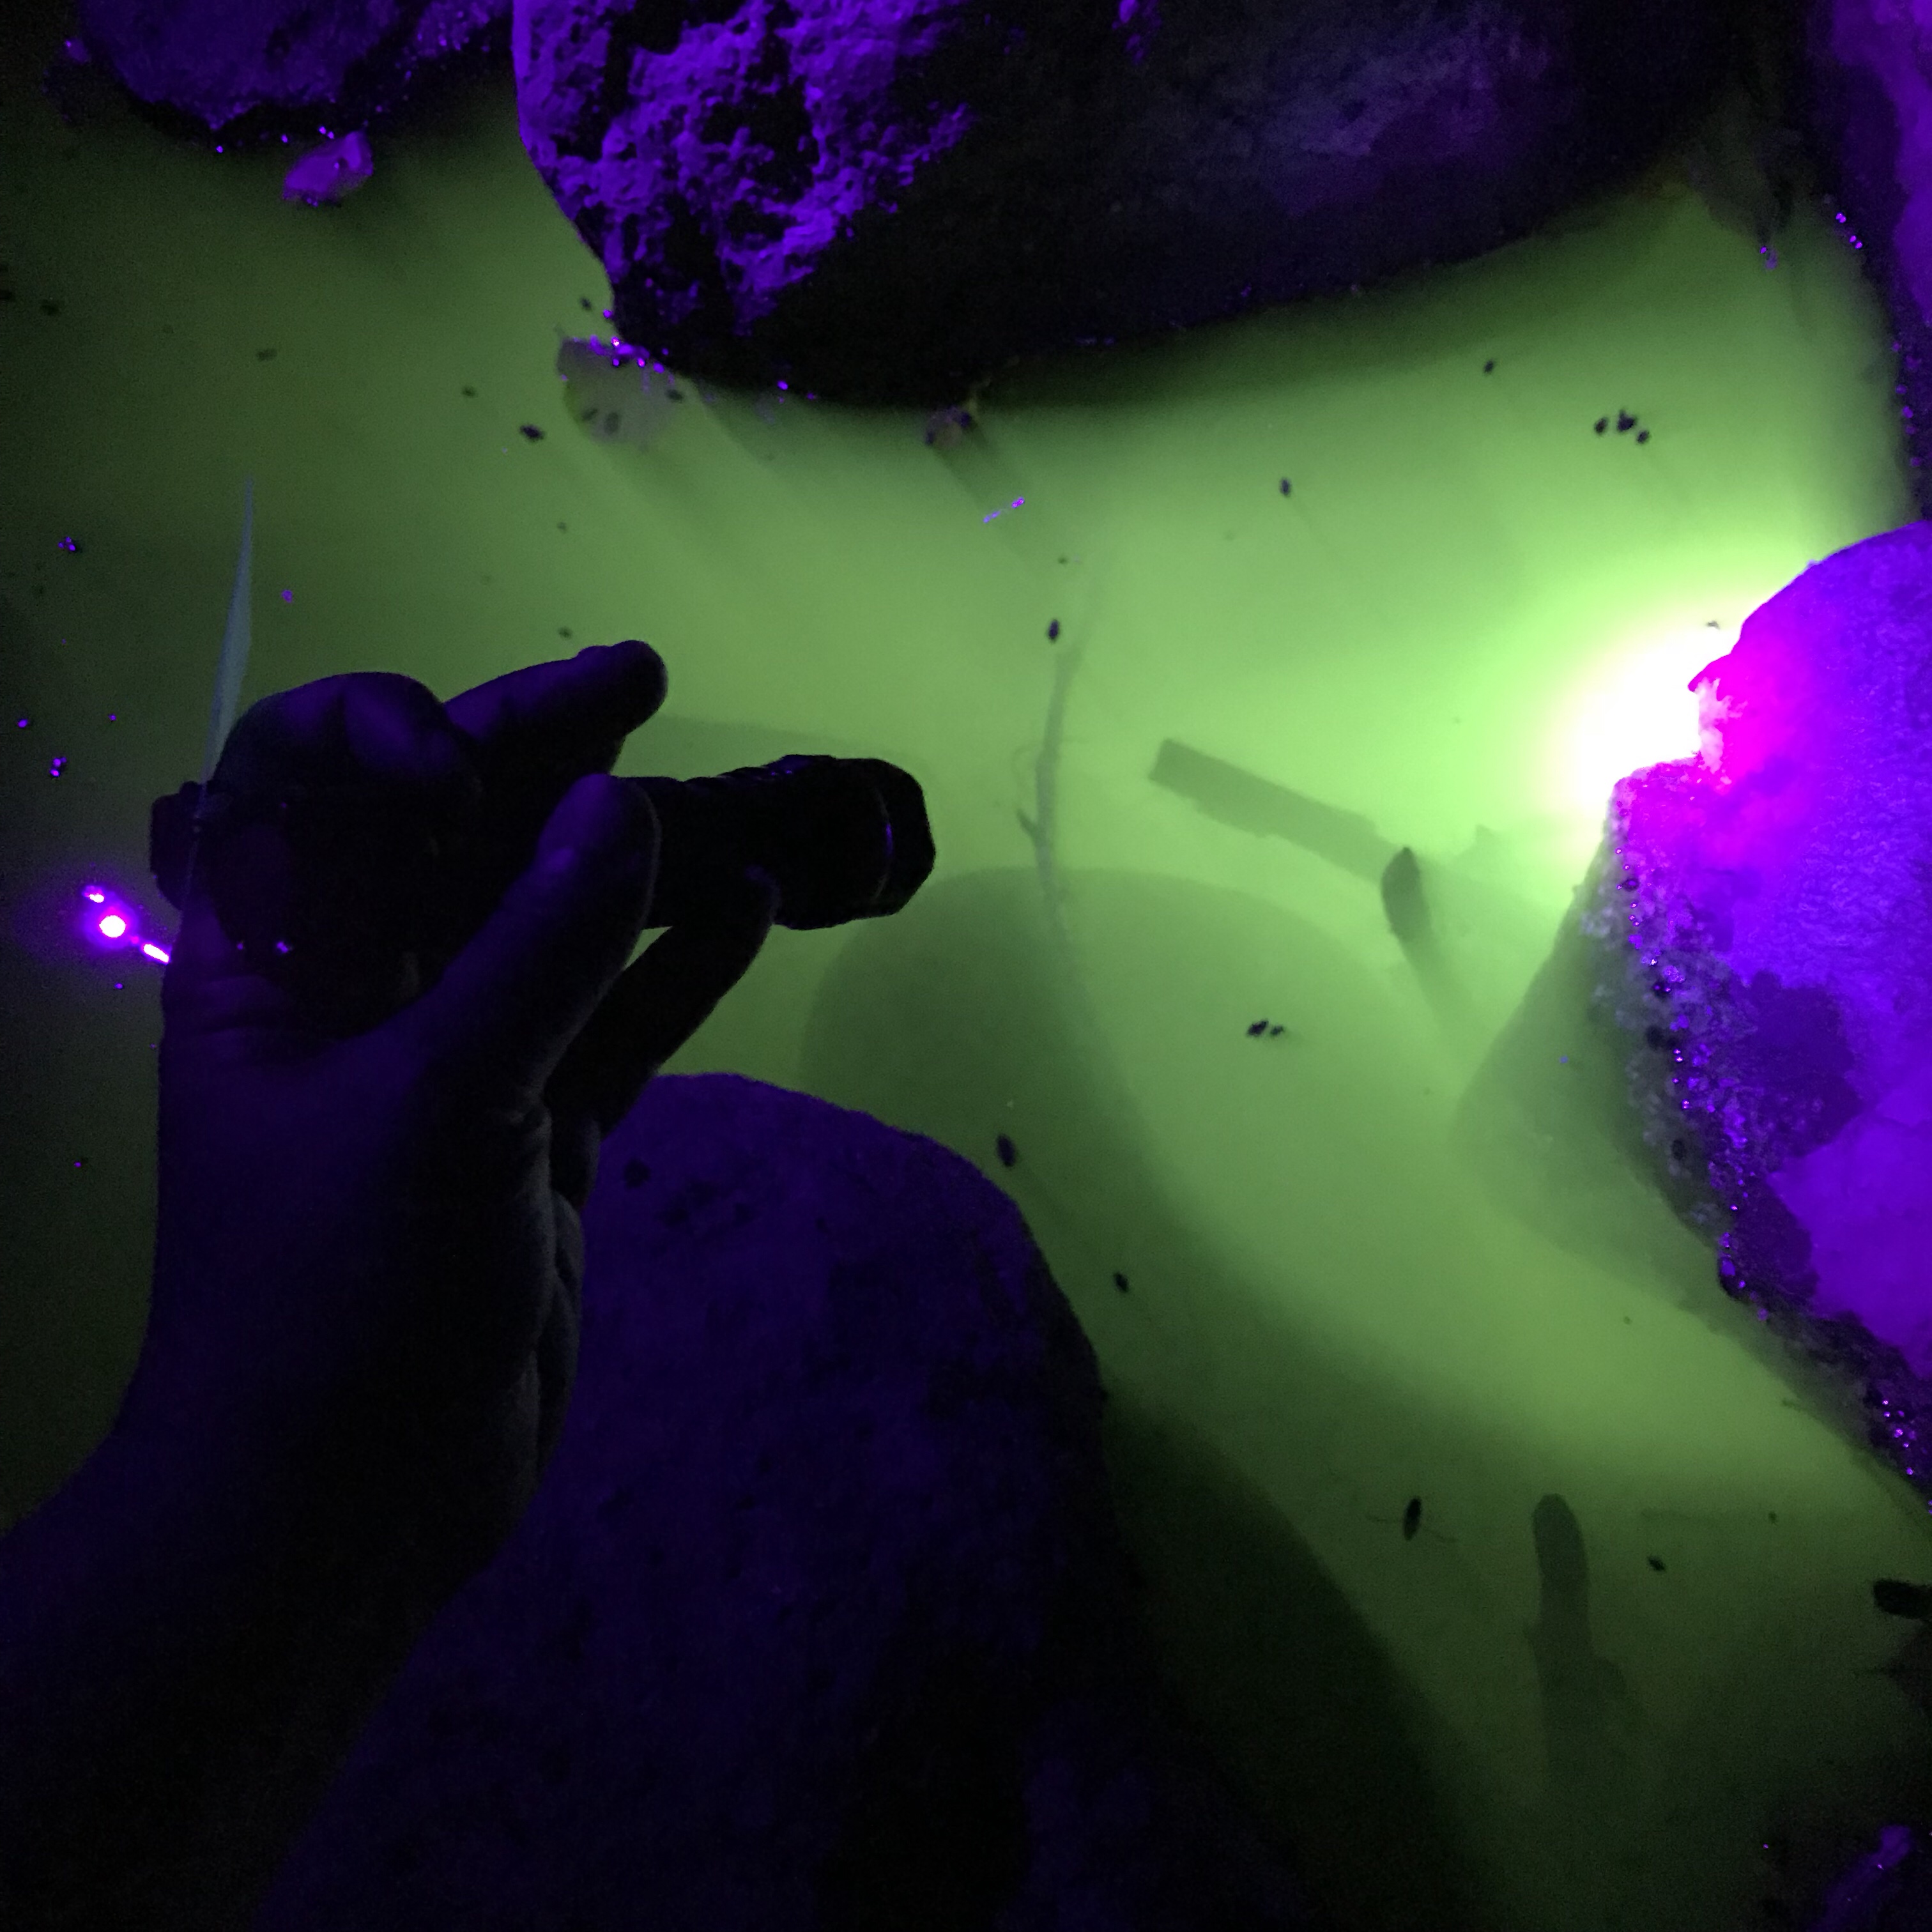
Below my hand holding the UV torch while I was looking at all kinds of critters in the water (poor things!)

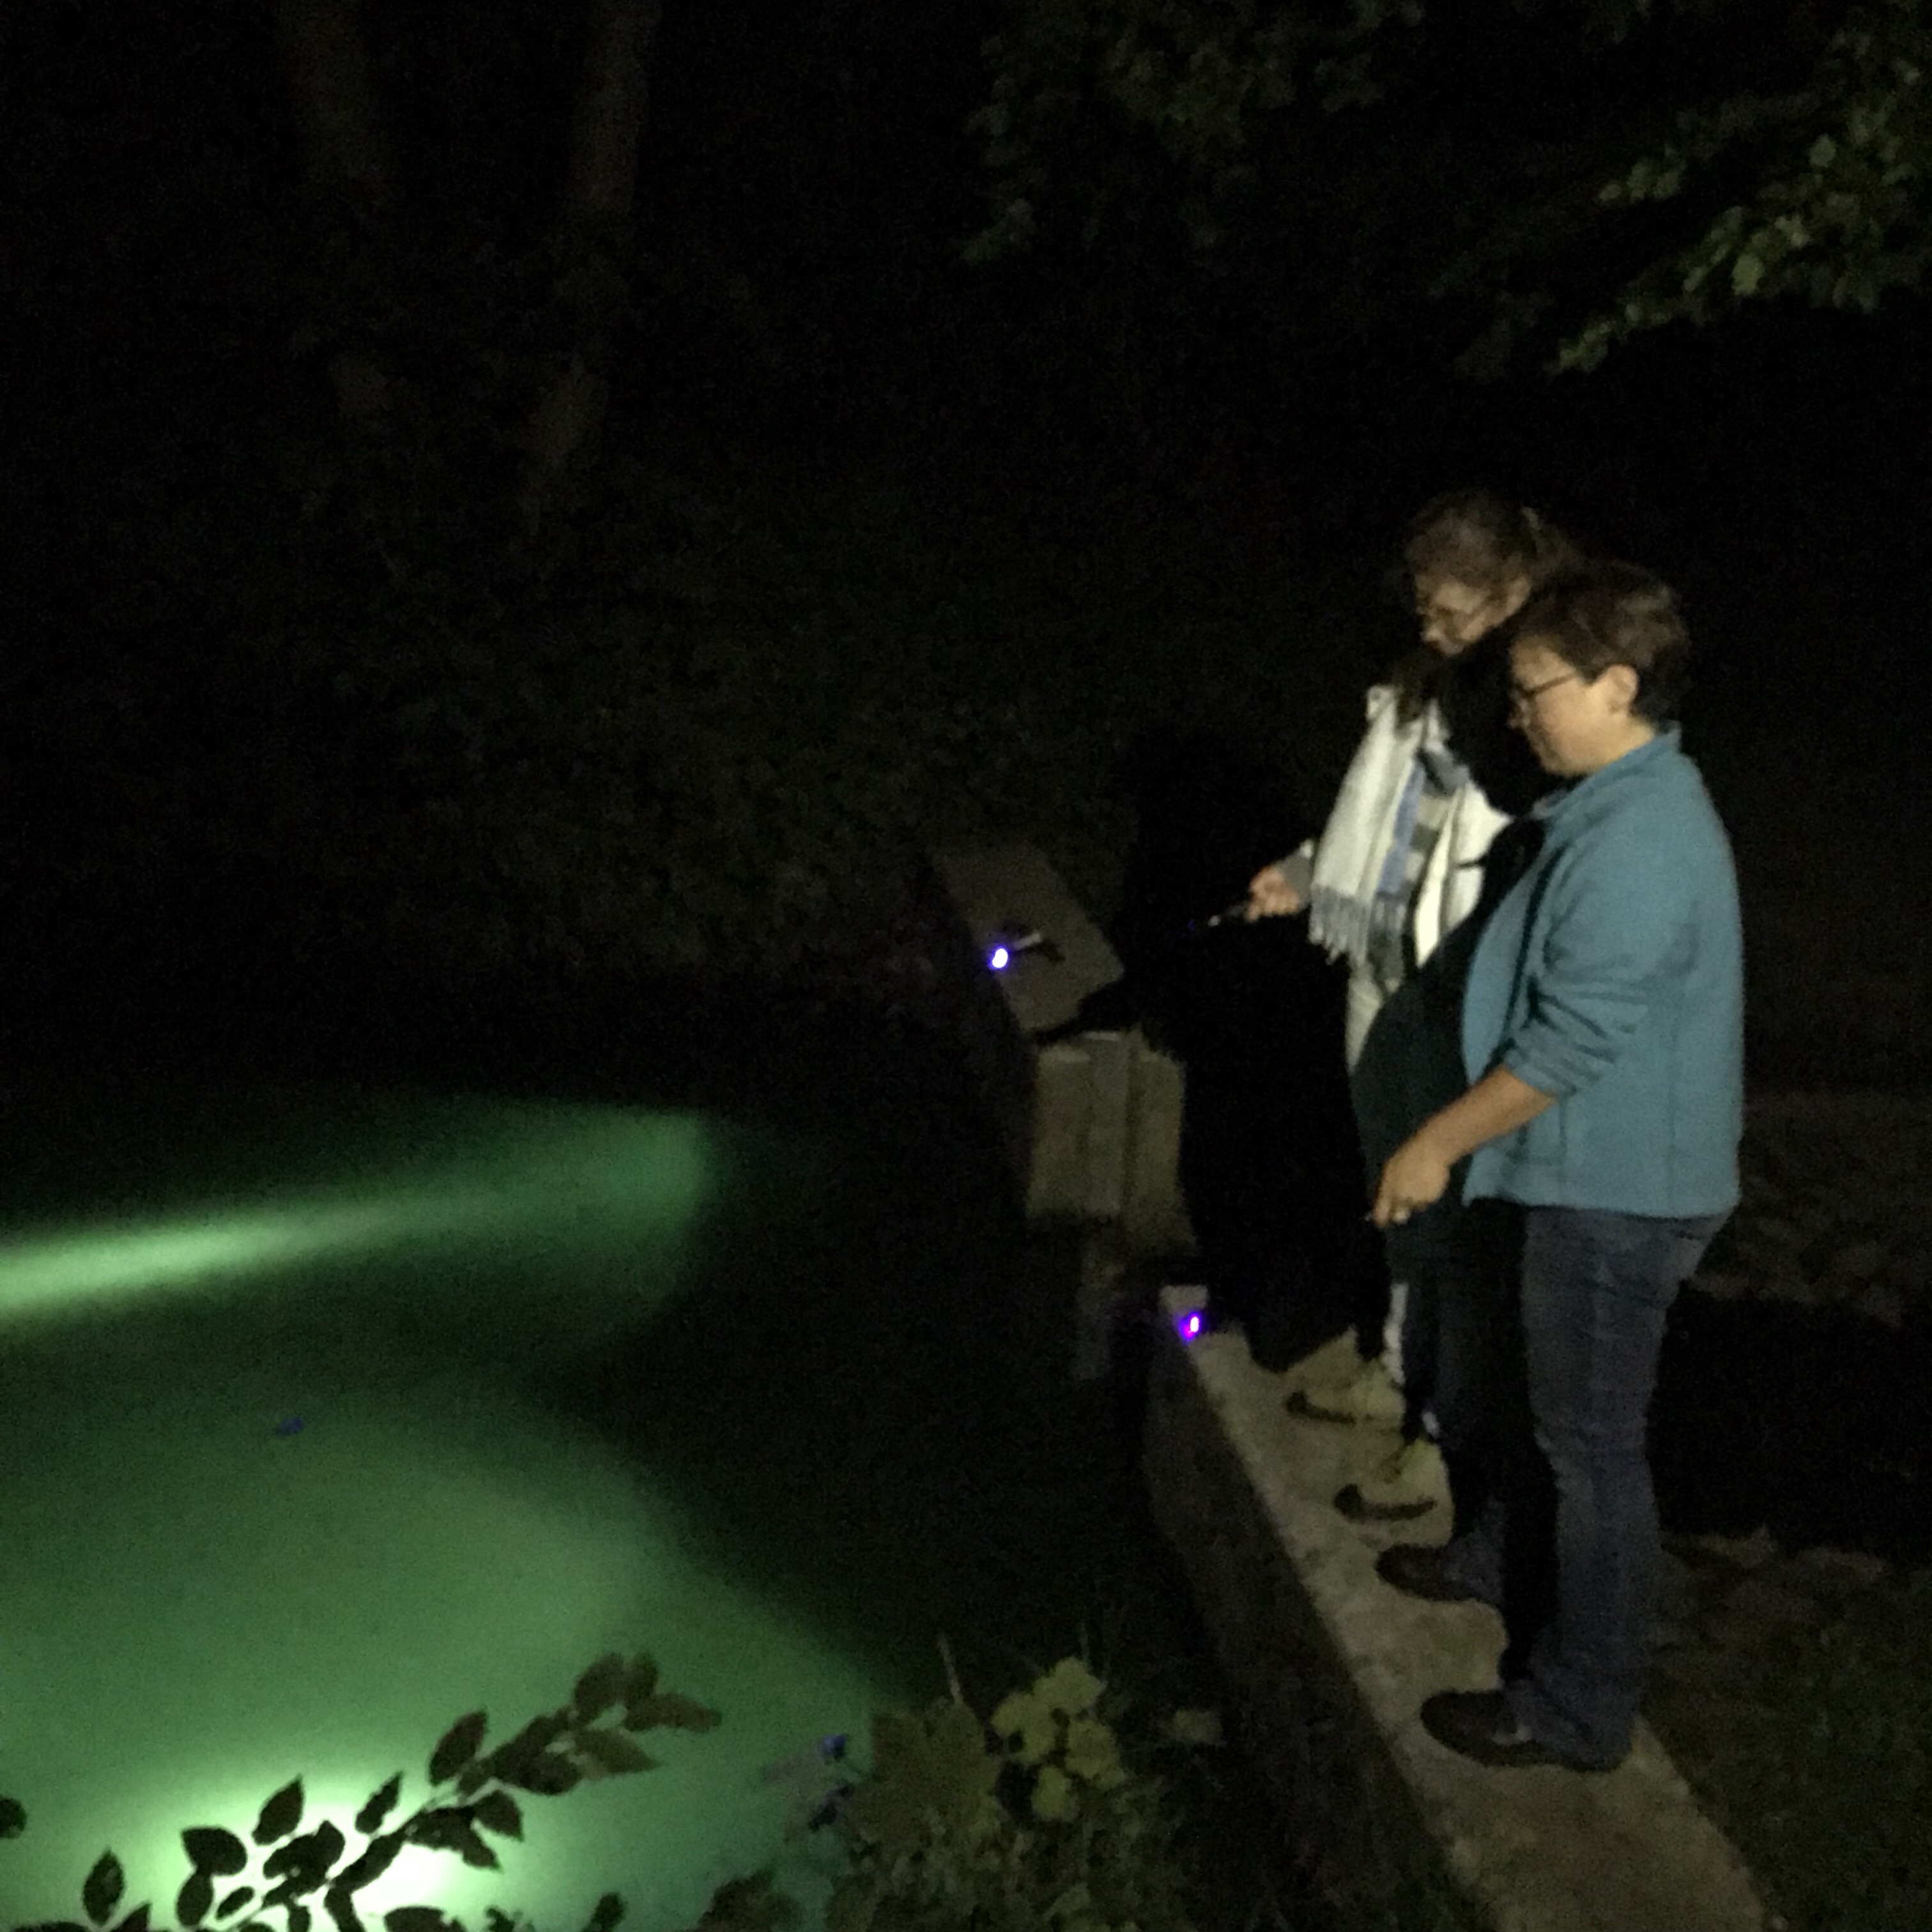
Science is, of course, team work. Especially when you want pictures, too ;-) Thanks Maria and Tom for such a spontaneous and exciting adventure!

Below, Tom is shining the UV lights down the little water fall so we can take pictures.

And here you see the view from the upper lake down the water fall into the lower reservoir. Next time I will definitely not do such a fluorescent night walk without a tripod and a better camera than my phone!

It might have been a bit of a hassle to find if you didn’t know where to look, but since I know exactly where that lake drains into Kiel fjord, we could follow the fluorescent water out the storm drain into the fjord!

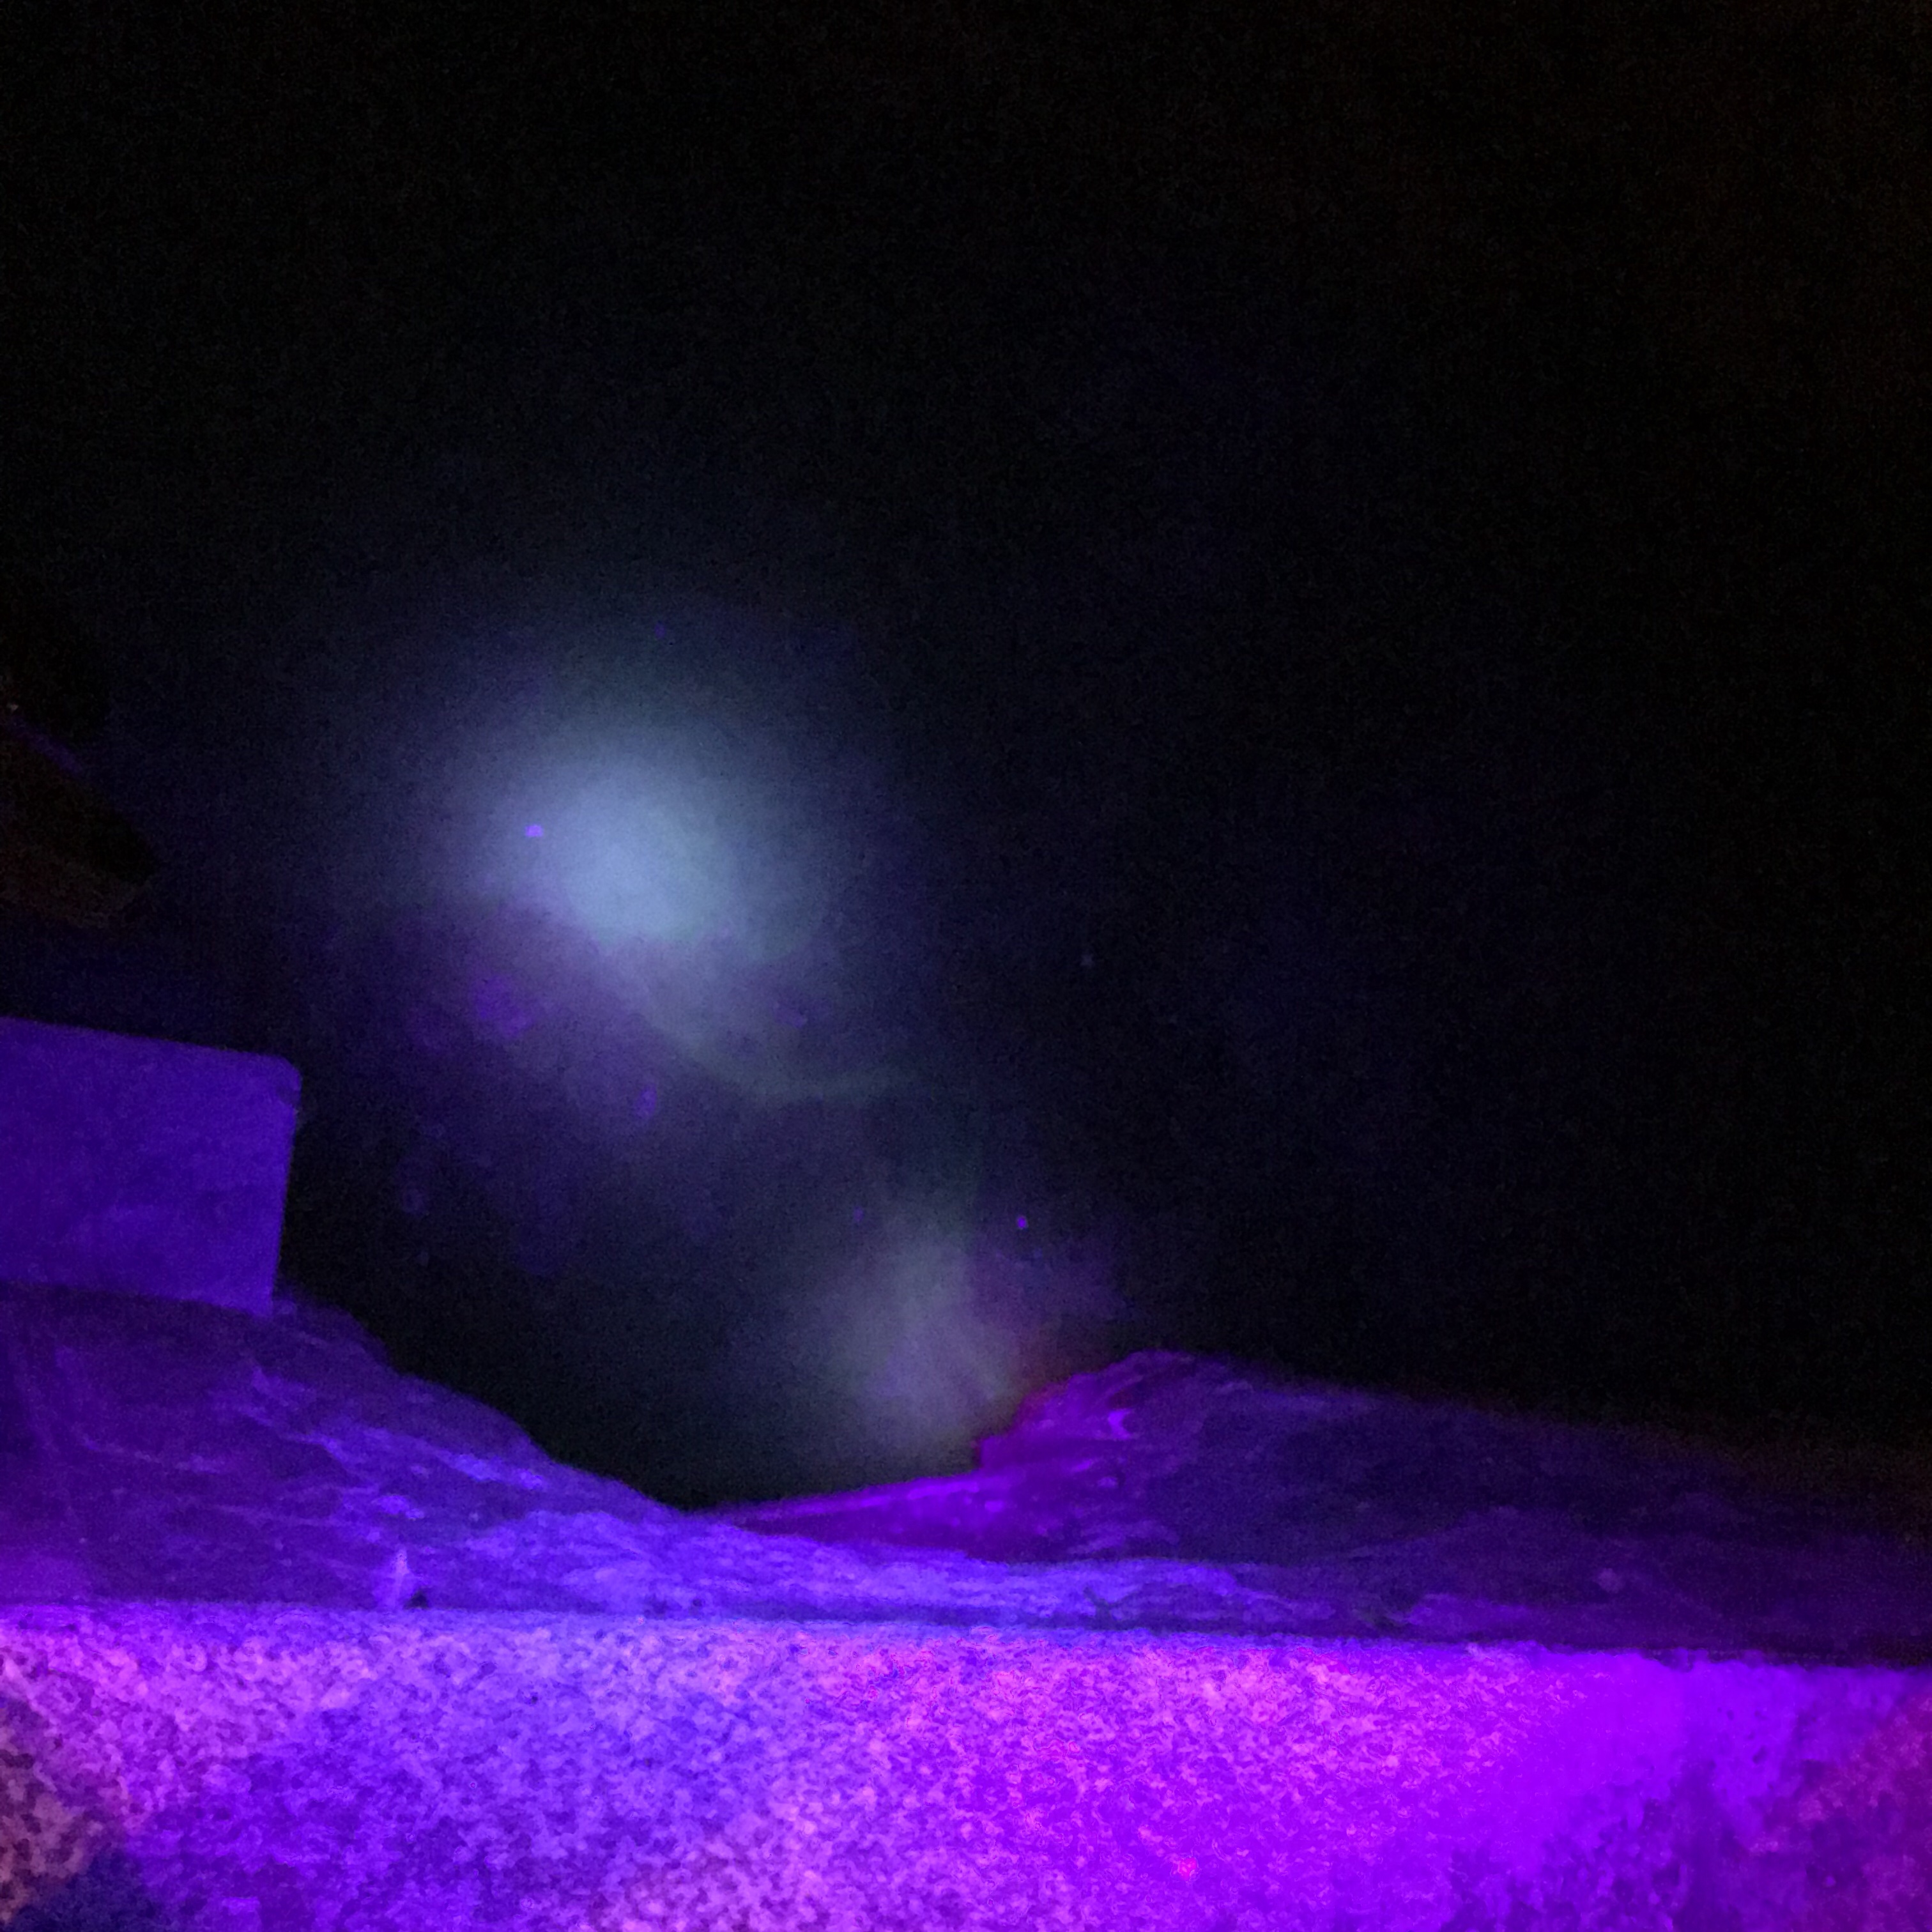
Here we are at the top of the sea wall, looking down, and you see eddies of fluorescent water coming out of the storm drain and into the fjord. Super cool to see that the flow was coming out on the edges of the drain, and that it was eddying. And that, even though there was not a large flow coming out, it could be seen quite far into the fjord, at least as far as our torches could still light the surface. Very very cool tracer oceanography! That was one exciting evening!! :-)

Dye tracer “in the wild”, day 2

This morning, the green lake looked different yet again.

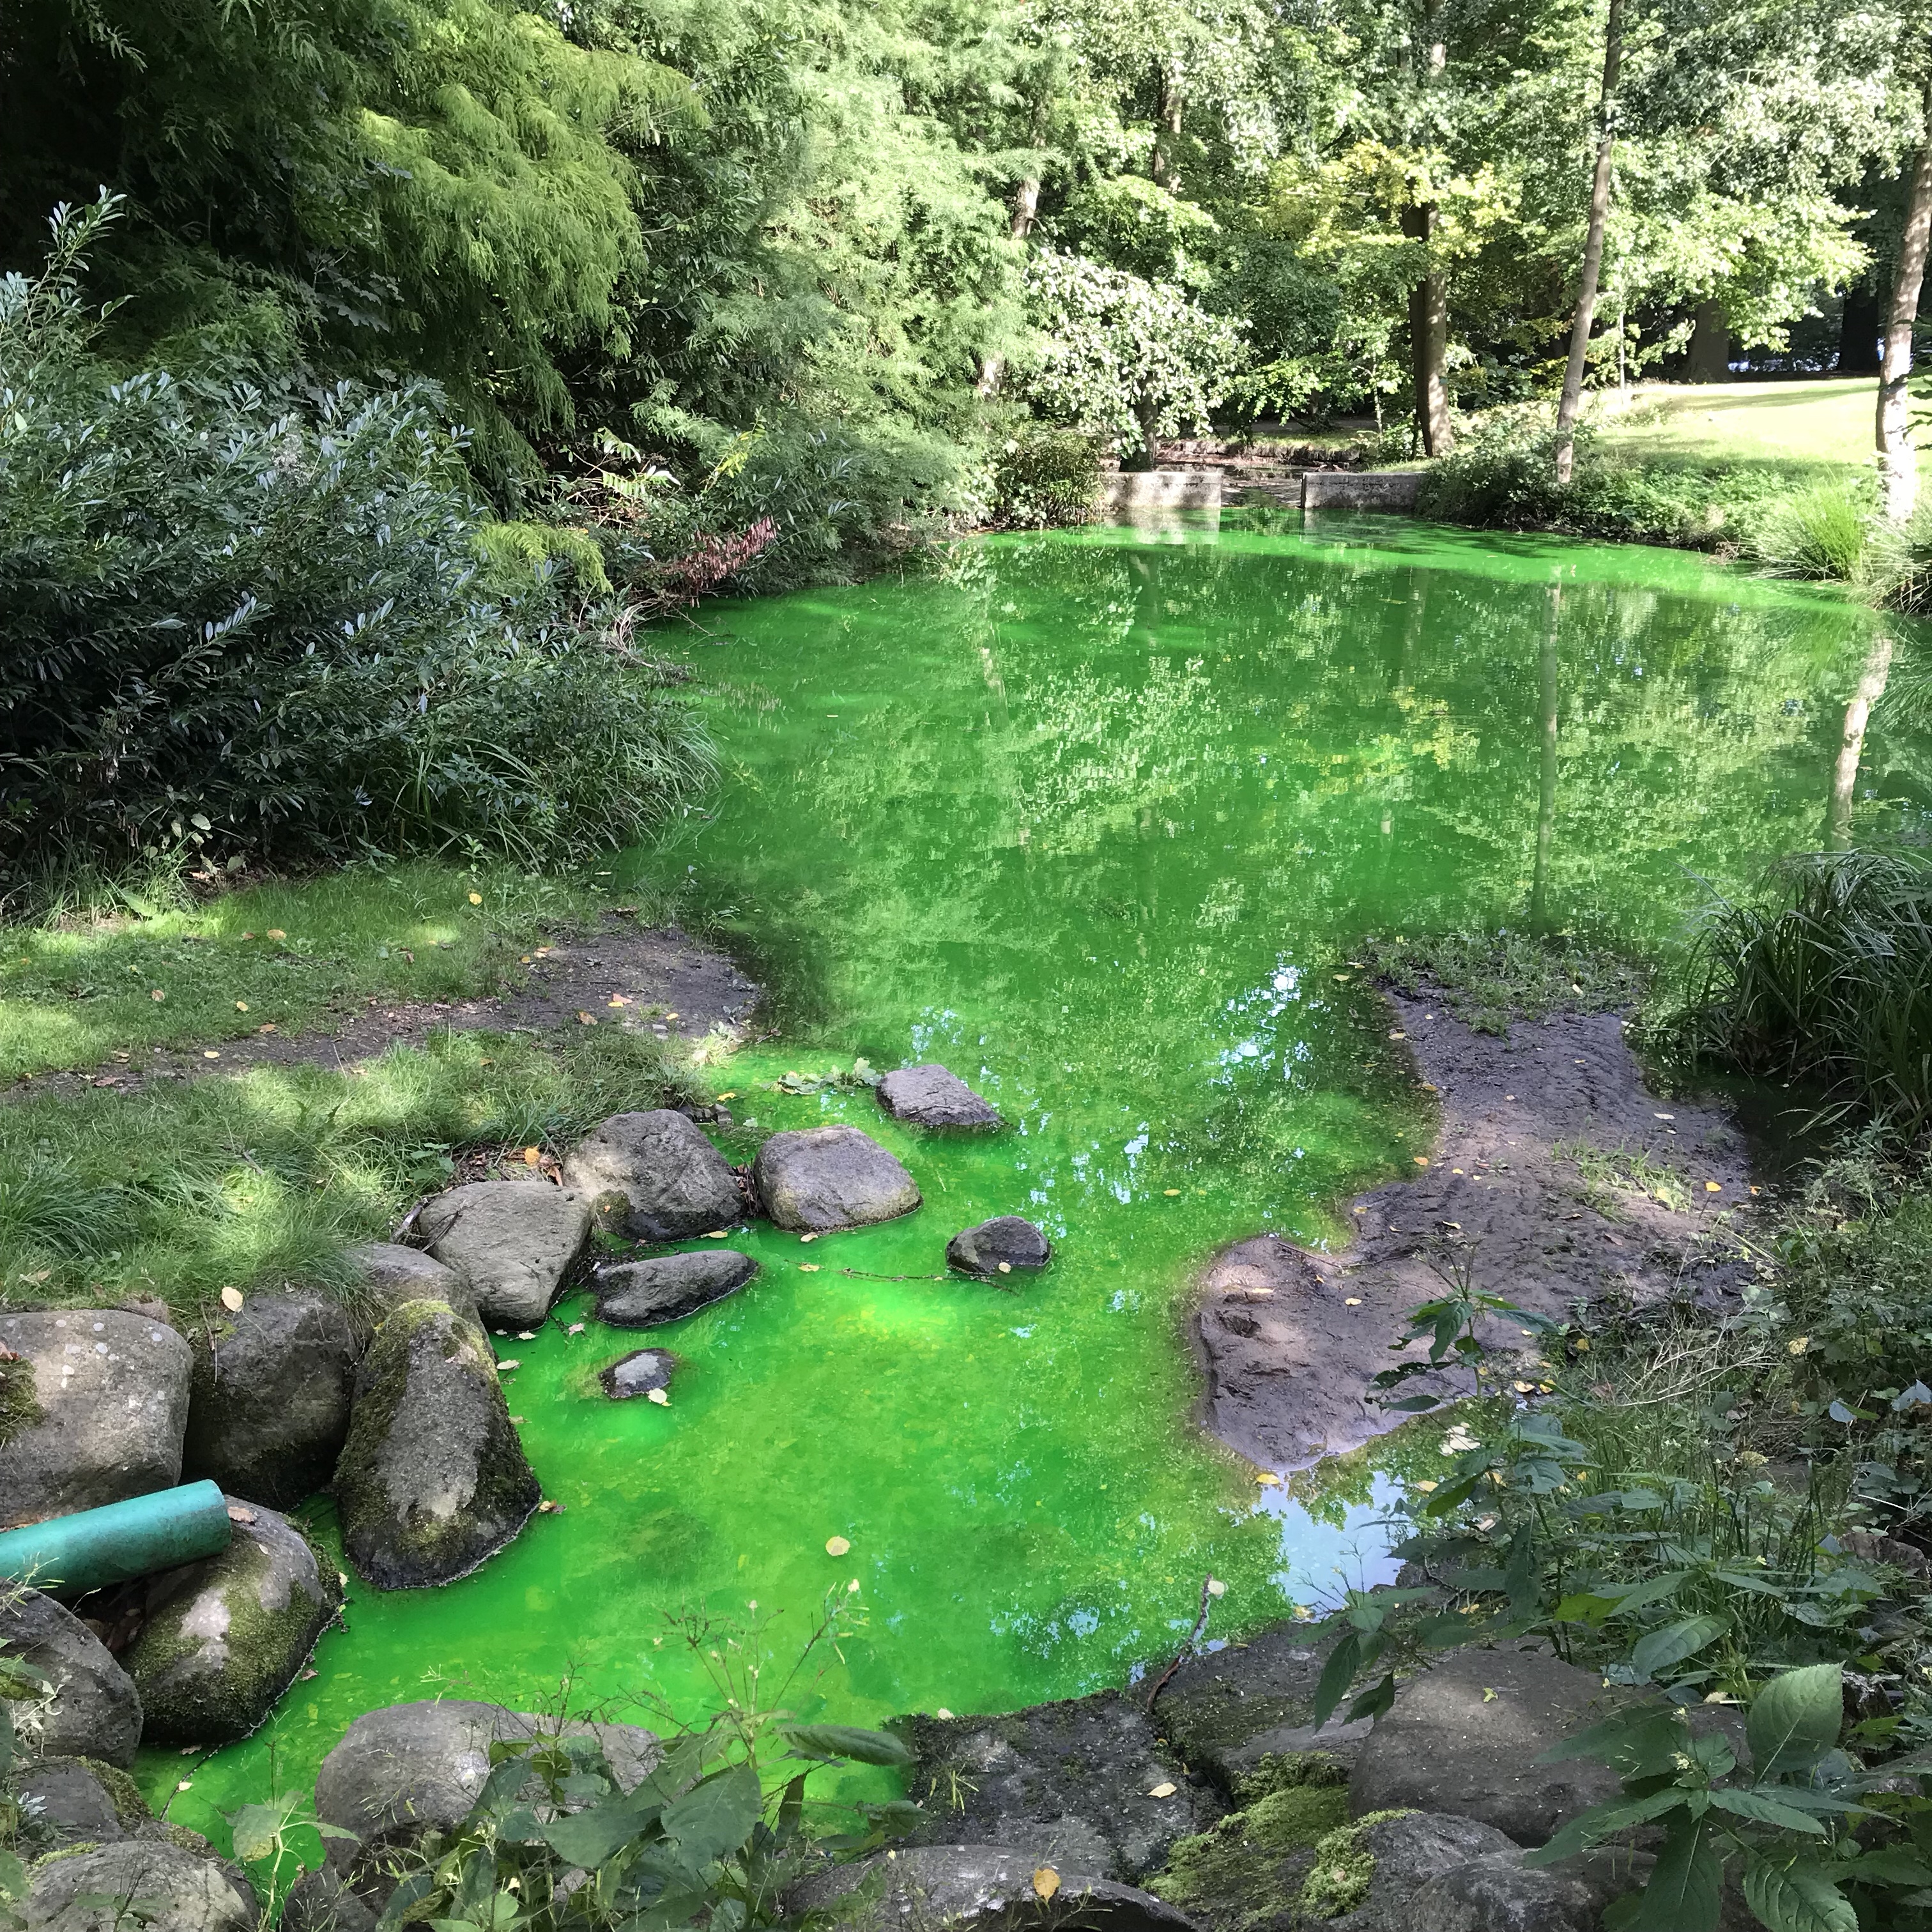
If you remember yesterday’s pictures, we ended the evening with the lake being a fairly well mixed green color (picture on the right).

Now imagine my surprise when I came back in the morning and it looked like this:

The right side of the lake is still green, but the direct connection between inflow and outflow is an even brighter green! And the green inflow detaches once more at the tip of that little island (which it only did during the first observation yesterday, and two hours later the mixing had progressed around the tip).

There are only two ways I can think of how that could have happened:

a) During the night, there was a lot of un-dyed water added to the lake. Maybe through rainfall? But the effect would have been that the green color in the lake would have gotten diluted and, when the rain stopped, the inflowing water appears a lot greener than the surrounding lake water. Possible, even though I didn’t notice any rain during the night.

The other option is this:

b) Someone added more dye to the leaking pipes. This is the more probable explanation to me. The effect would be the same as above: A more intense inflow into a less intense lake.

In any case, the plume we are seeing now can only have been flowing with that intense a coloring into less green water for a couple of hours, otherwise the whole lake would have been mixed through and through.

I guess the easiest way to know which explanation is right would be (well, in addition to asking them directly) to have an objective measure of how green the water is, so that we would know if that changed over night or if the plume is really more intense now than yesterday. But with light that is always changing that is really not possible to say.

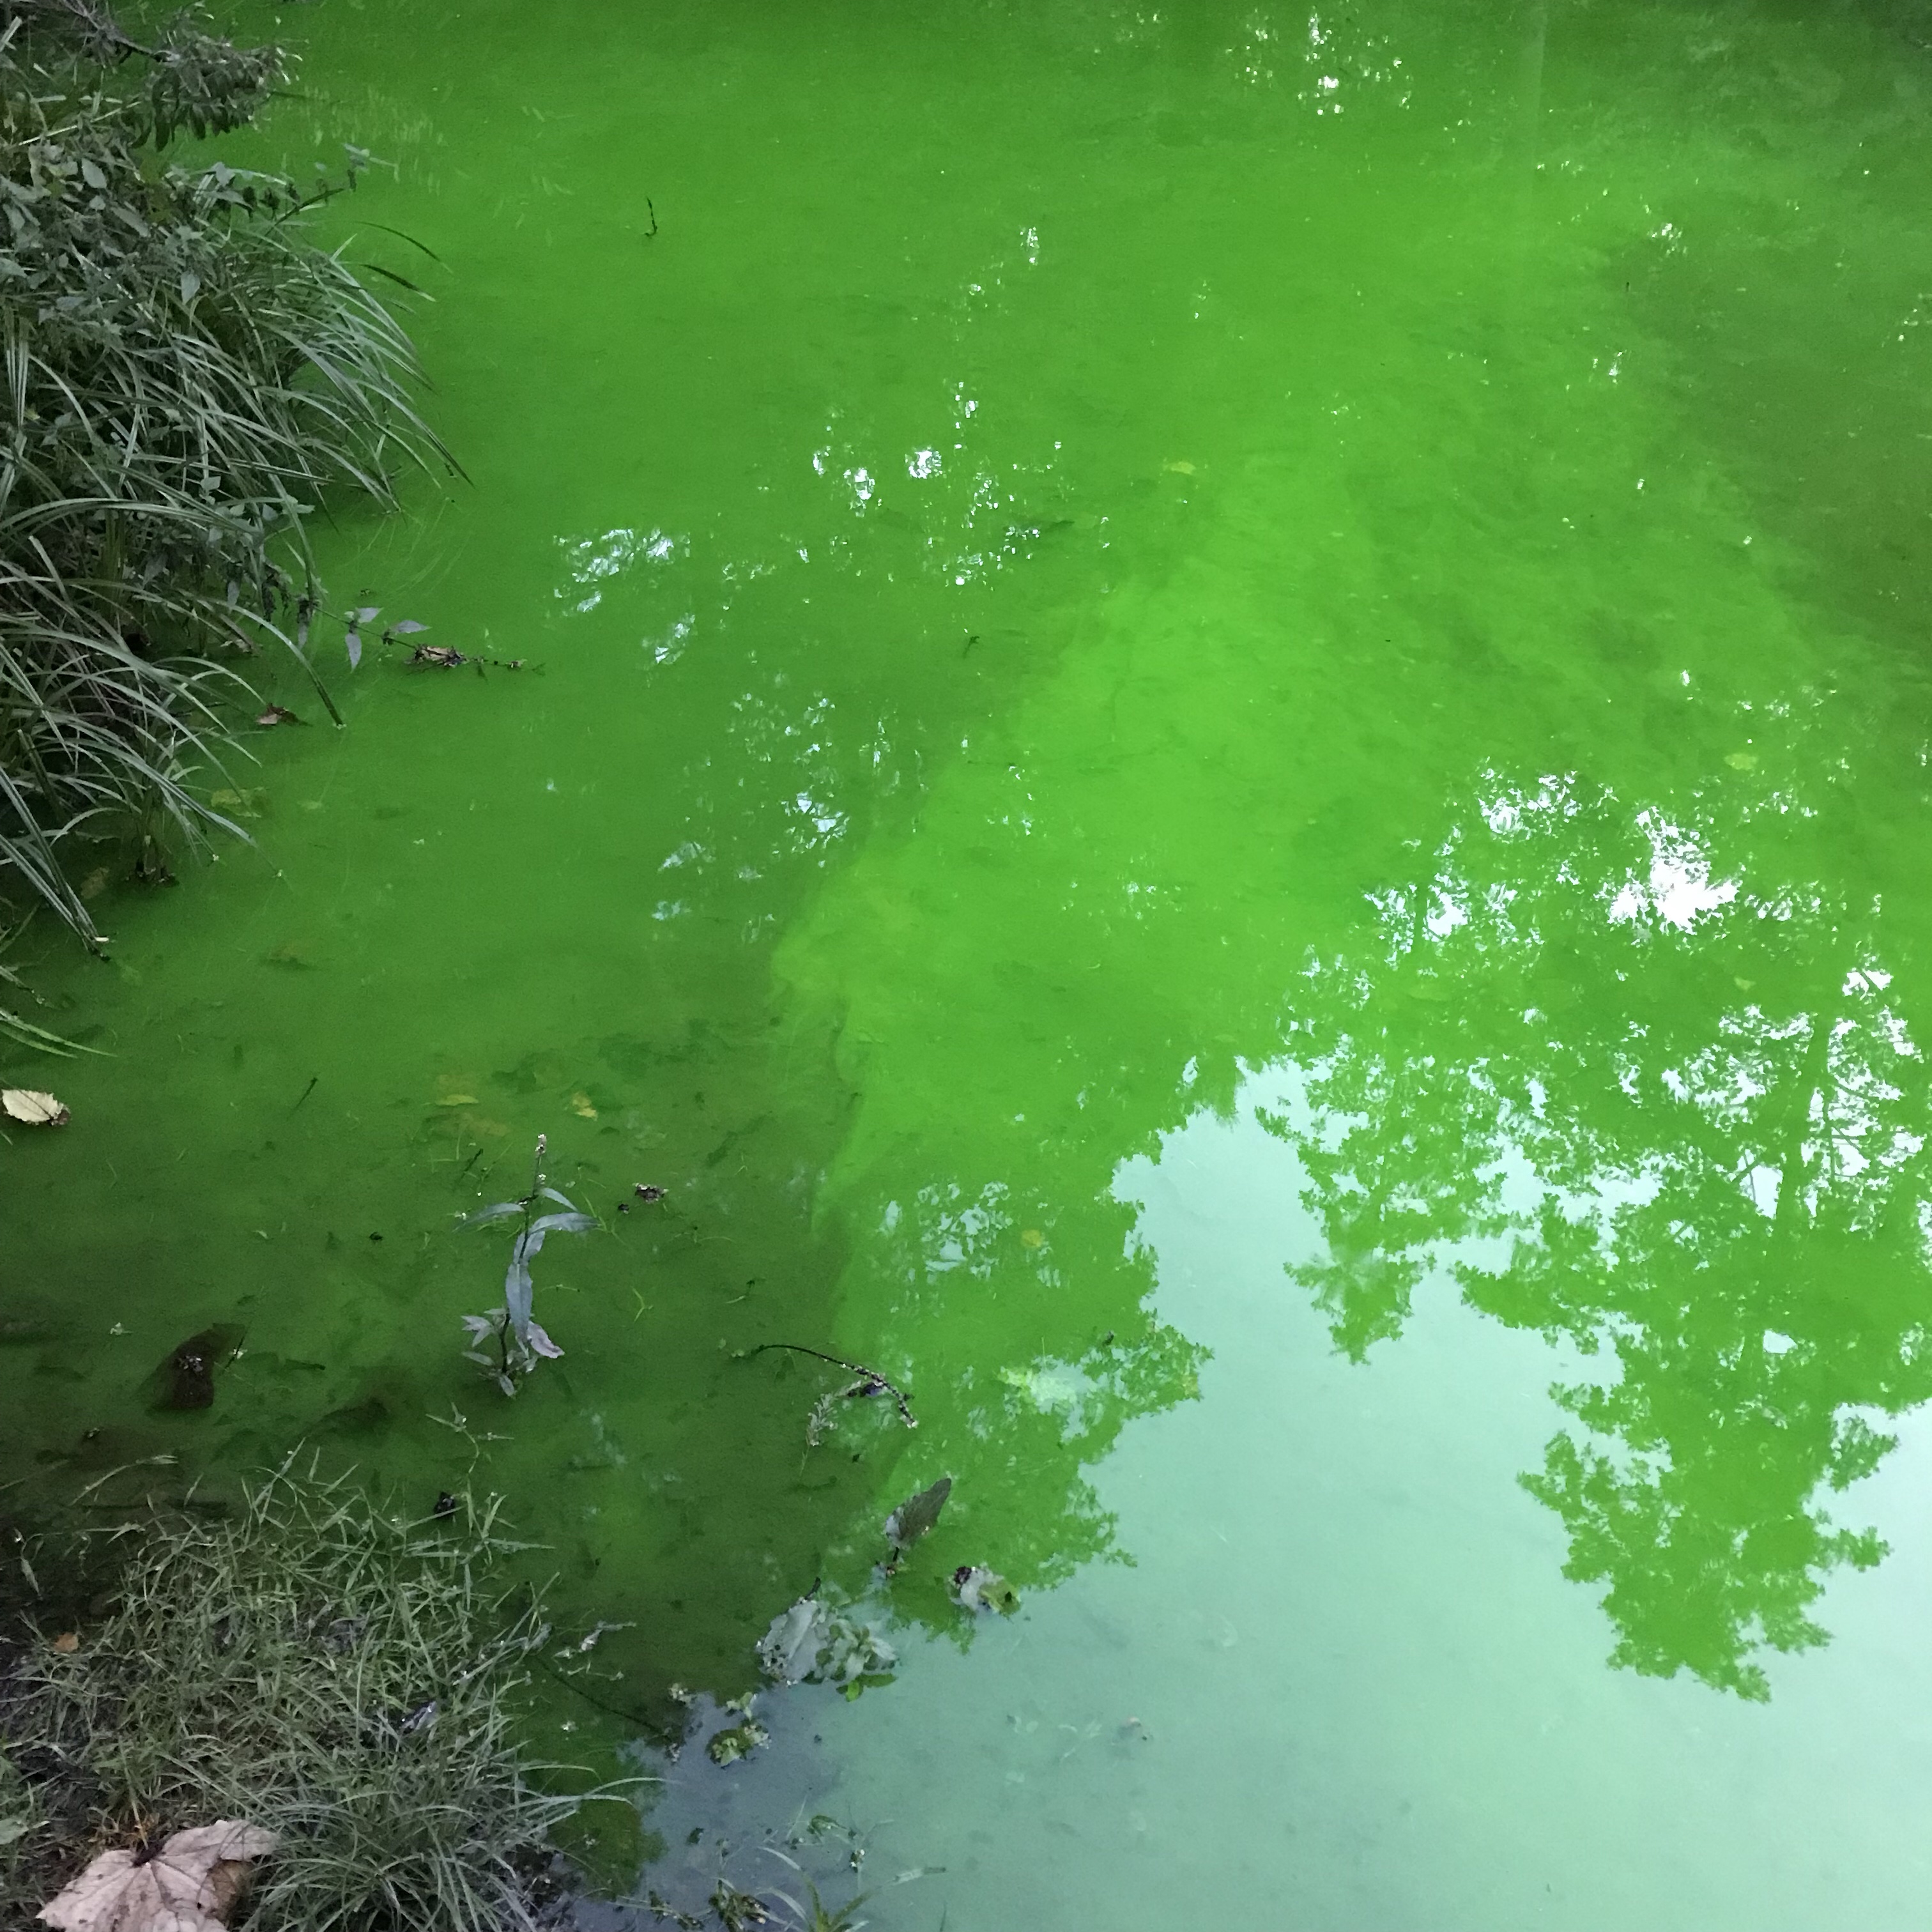
But this new green inflow is definitely beautiful: Look at the instabilities where it meets the stagnant lake water!

And more instabilities on the other side.

So those pictures were taken at around 7 in the morning. When I came back in the afternoon, the lake looked like this (sorry about the confusing lighting with the shadows and directly lit spots, can you ignore those and imagine what the color would look like under better light?):

Completely mixed and very very green! Interesting, isn’t it? So apparently the inflow stayed as intensely green as in the morning and, over the course of the day, mixed the whole thing.

P.S.: The company that puts the dye tracer in said on my Instagram @fascinocean_kiel that they are using uranine as dye, and that it’s completely safe for the environment. And, interestingly, that’s what we use in tank experiments under the name fluorescin, and that means that it is a fluorescent dye! I really need your UV light, Uta!! :-)

Dye tracers “in the wild”

You know I love dye tracers (remember the beautiful fluorescent green we used in the 2017 experiments in Grenoble, when we got to play with the 13m diameter rotating tank?) but today I found some “in the wild” again — on the way back from my morning run & swim no less, in Kiel’s Forstbaumschule.

I’ve seen a dye tracer here several times before, and it’s basically just an indicator for a leak in the district heating (and everybody claims that it isn’t harmful to the environment despite its color).

Dye as a flow tracer

Spotting leaks would be very difficult if you just had normal water running into places where there is other normal water. Last winter you could clearly see that the dyed water was quite a lot warmer than the rest because it melted ice away where it went, but at temperatures like to day you might be able to see a thermal signature with thermal imaging equipment, but it is nowhere near as obvious as during winter.

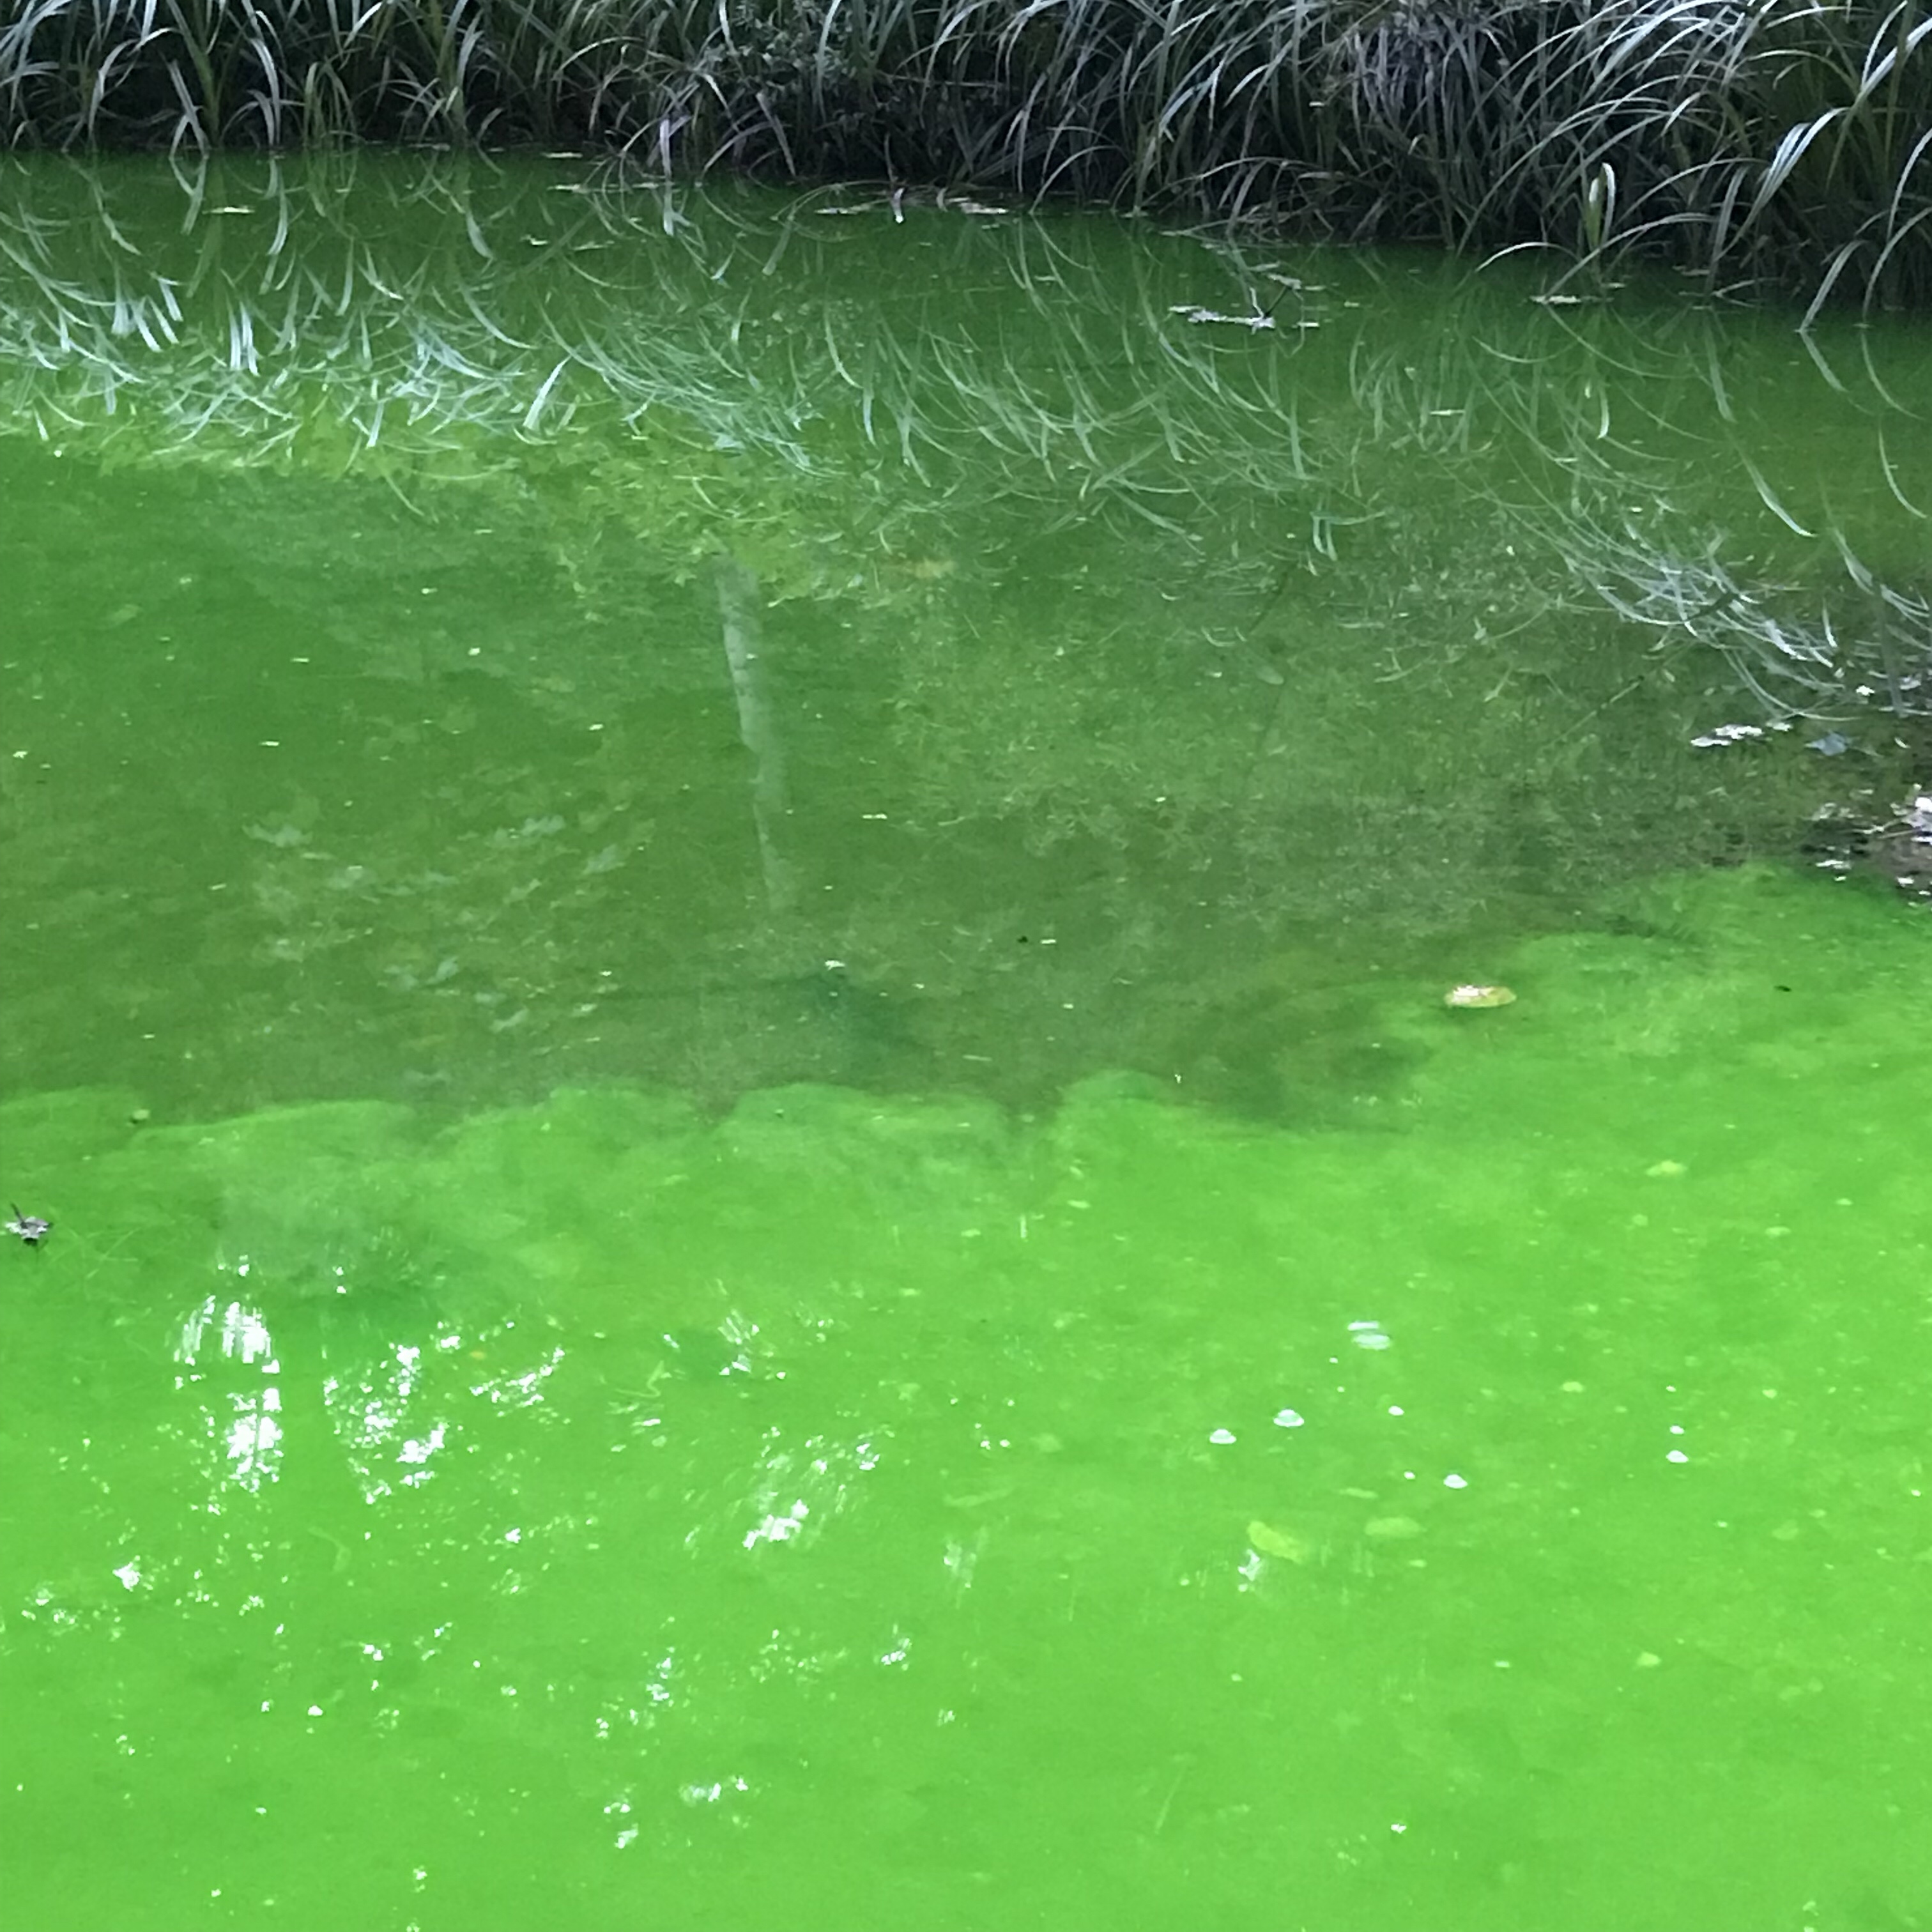
But today my timing was lucky: The pipes can’t have been leaking for very long yet, because there were clear boundaries visible between the “old” lake water that wasn’t dyed yet, and the plume of dyed water entering into the lake and leaving it on the other side.

Dye as age tracer

So in a way the dye also acts as age tracer (since there are currently no other inflows into that lake. It would obviously be different if there were): the “old” water is still dye-free, whereas the “young” water is bright green. And then there are the regions where older and younger water mix and the color isn’t quite as intense.

Dye to visualize mixing

On the boundaries between the dyed water and the old lake water you see mixing in form of tiny eddies, and I’m pretty sure that when I go back this afternoon, the whole lake will be this awesome fluorescent color. And I am curious to see if there will still be flow structures visible or if it’ll all just be bright green :-)

Update: 2 hours and 11 hours later

And I went back. Twice.

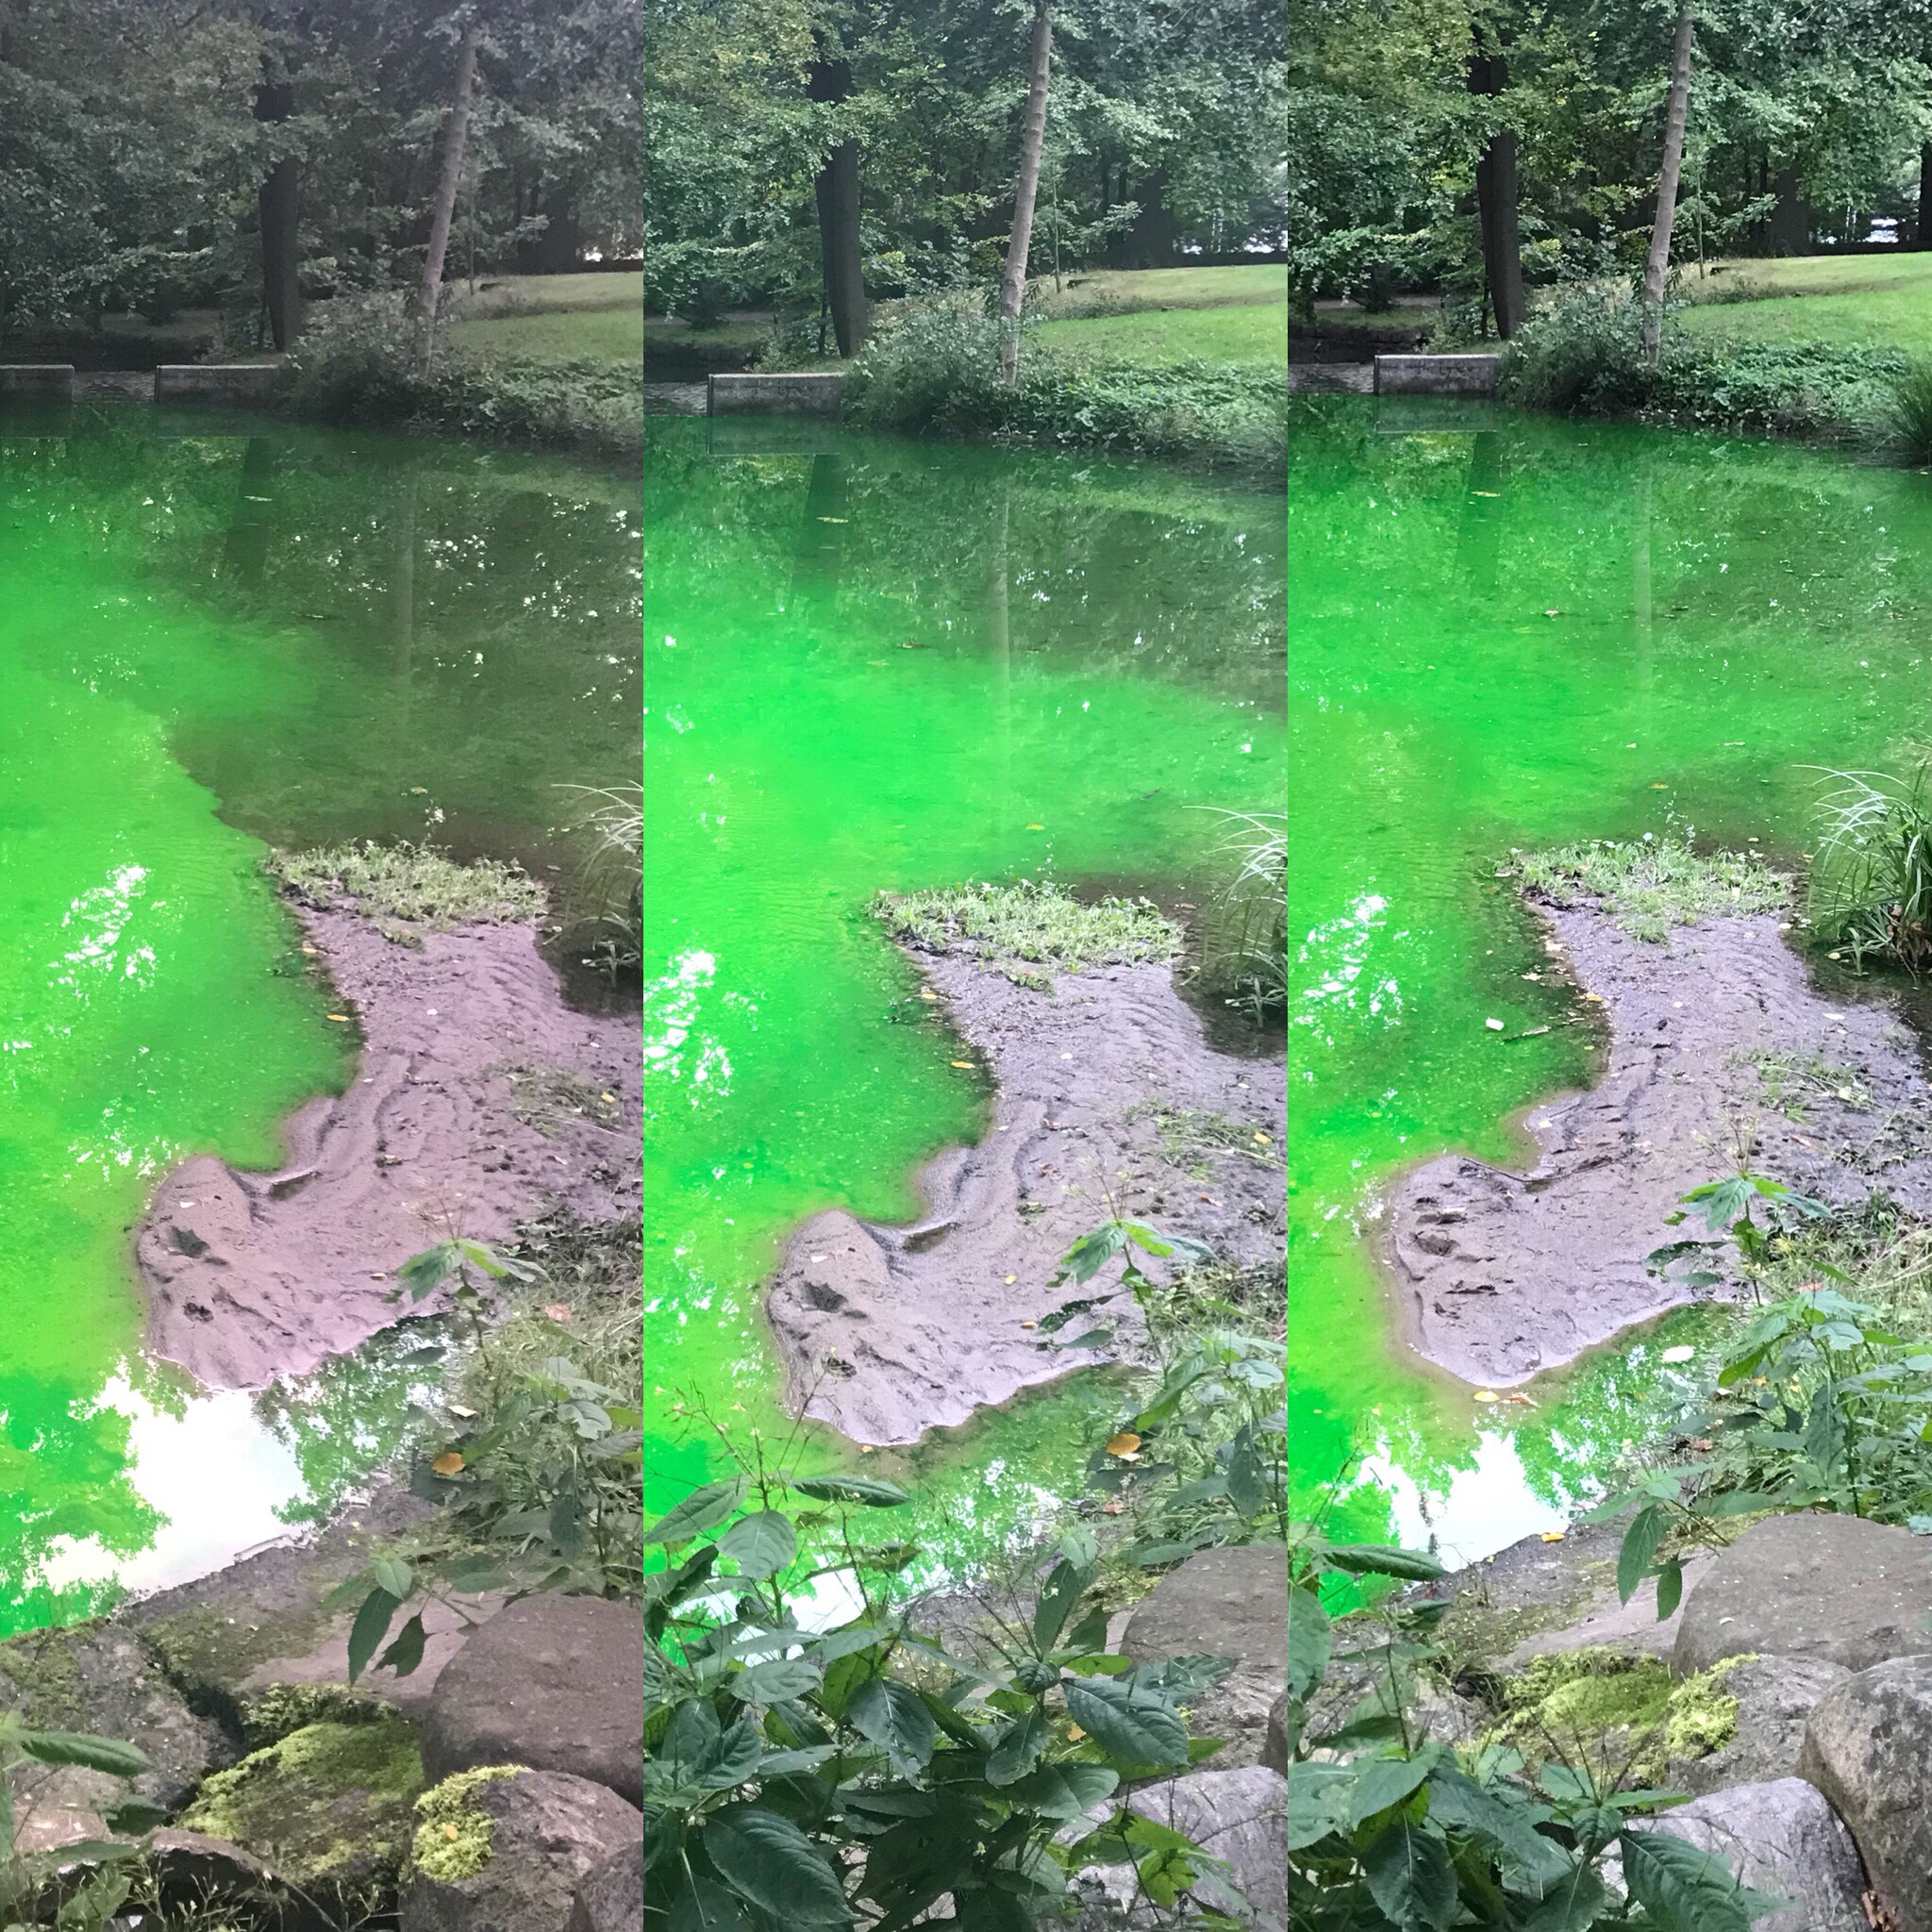
Below you see how the coloring changes at the inflow mixes more and more with the lake water: left the picture taken at 7:15 am, then 9:15 am, then 7 pm. Fascinating! :)

“Liquid art” by Wlodek Brühl, and how it could be used in physics teaching

Do you sometimes feel that wherever you go, you just happen to observe something that makes you think about physics? I definitely do, and that’s what happened to me again this Sunday.

#diwokiel — one week full of exciting events related to digitalization of the world

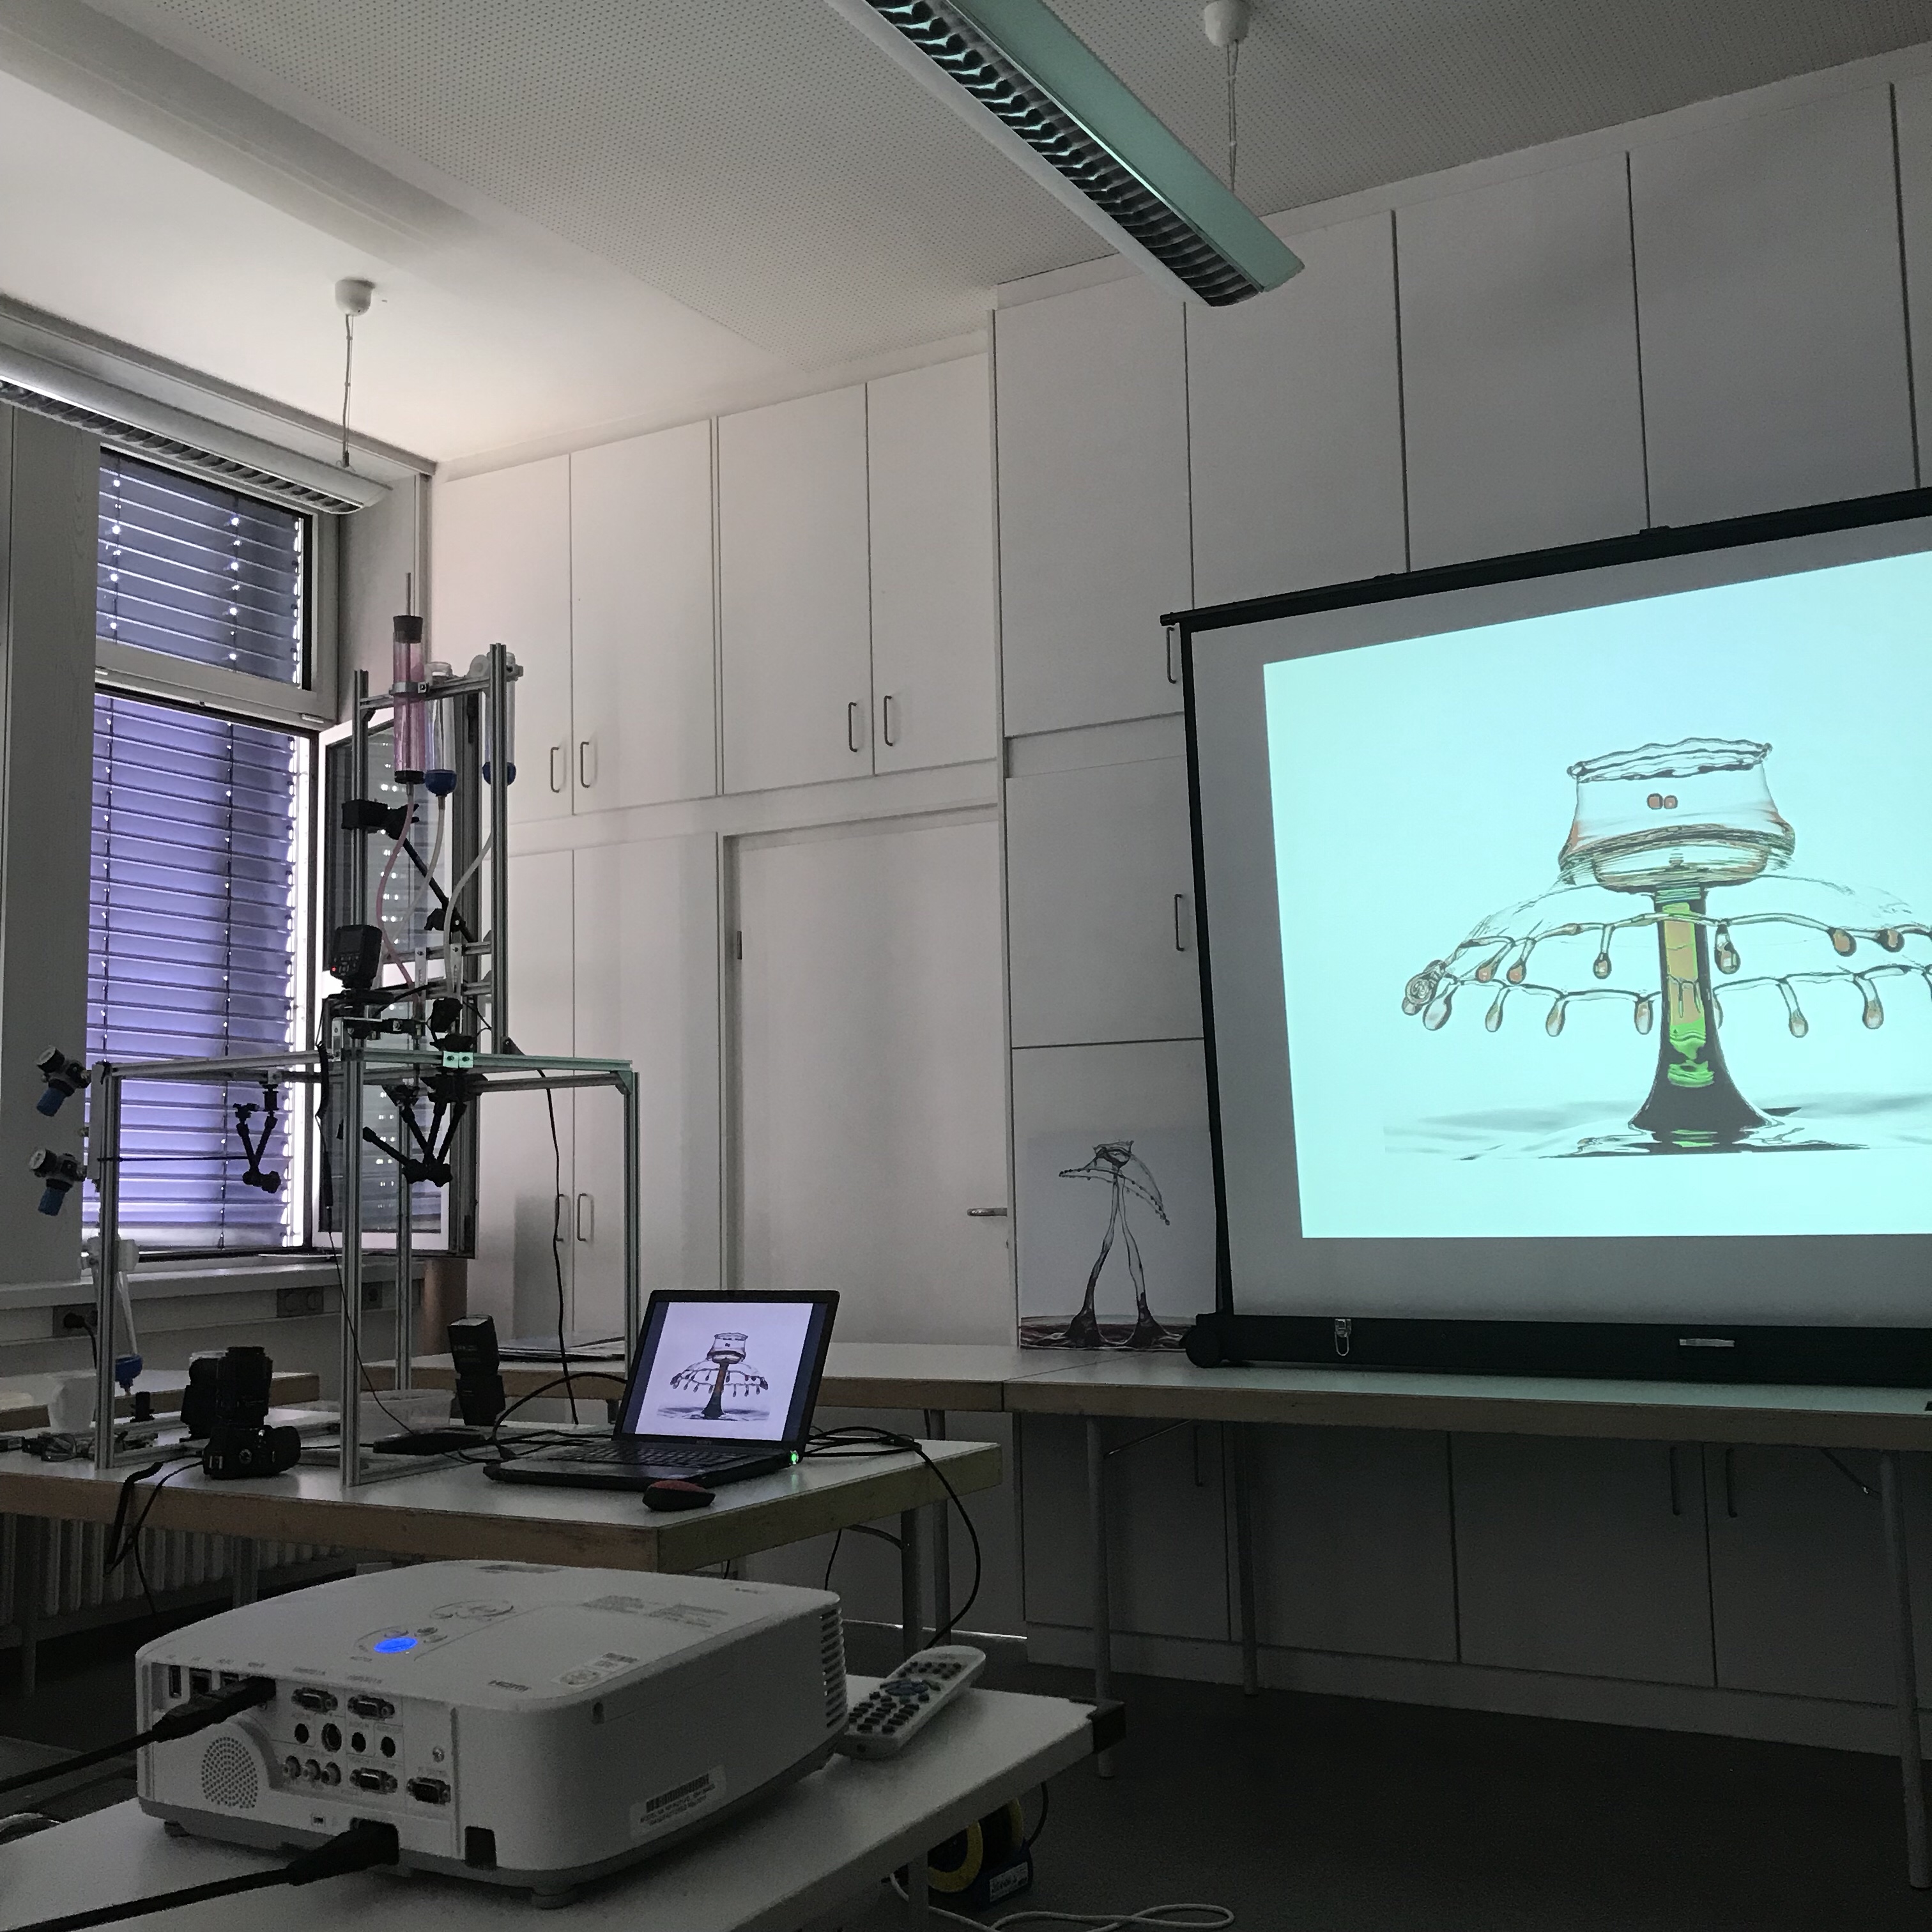
It’s currently #diwokiel, a week-long event on all kinds of aspects of digitalization. I went to a talk on his “liquid art” by Wlodek Brühl. Mr. Brühl forms sculptures out of water drops and documents those sculptures through photography. But “forming sculptures” really doesn’t begin to convey  the process through which this happens and the level of expertise and precission that is needed. Below, you see an example of one of his sculptures on the projection (for more of his absolutely breath-taking art, check out the portfolio on his website!), and the apparatus with which this kind of art is generated on the left.

As you might been guessing from the kind of setup already, there is an enormous amount of physics that goes into creating this kind of sculptures!

Using art as a hook to talk about physics

And we are back to a favorite topic of mine: How to use art in science communication!

One challenge that science communiction faces is how to reach audiences that aren’t already interested in what you want to talk about. Yes, school kids are often exposed to all kinds of topics in science communication events whether they are interested in them or not, just because their teacher decided they had to go there. But what about adults? There are a lot of people that would never knowingly attend an event that will deal with physics. Attracting them with something they are interested in — art, in this case — might be a great way to spark their interest in physics topics!

What’s the physics behind “liquid art”?

But where exactly is the physics that can be talked about? There are two main areas that jump at me: The physics of the water that is used to form the sculptures, and then the physics of capturing pictures and everything related to that.

Physics of water

As you might have guessed, my main interest lies in the physics of the water. How do you manipulate water to design exactly the kind of sculpture you want? This is not only about the exact size of drops, falling from the correct height, hitting a reservoir in the correct spot, at exactly the time you think it will, potentially additional drops with precisely calculated time lags…

In the following, I am going to give you three examples of the kind of physics I would talk about if I were to use “liquid art” in a science communication context. For all of these, there are so many nice hands-on experiments that could be offered to let people experience the effect of various parameters to show how and why it is important to consider them when creating drop sculptures. So exciting! :-)

Viscosity, or how to control the behaviour of drops

Firstly, viscosity. Having a handle on viscosity doesn’t only determine the size of the drops, but also the kind of behaviour that is displayed when the drop hits the reservoir — how deep will a drop sink, what kind of bubble will be formed, how high will the stem rise from the reservoir when surface tension drives it back up, all the good stuff.

Viscosity can be manipulated several ways: By manipulating the viscosity of water by adding starch or other substances, by using different fluids than water (which comes with additional problems, e.g. cleaning the apparatus afterwards), and by using different fluids and adding stuff to them. And then viscosity is also a function of temperature, so temperature of the whole lab (or studio) has to be controlled.

Hydrostatic pressure “plus”

The size of drops is also determined by another factor: By the hydrostatic pressure in the reservoir that feeds the drip (or valve) in combination with the opening time of said valve. There are very interesting ways to control the pressure in the reservoir that I could (and probably will ;-)) write several blog posts on!

And then it’s not only the hydrostatic pressure that is relevant: If several valves are used because water is coming from several reservoirs (for example because the water is dyed in different colors or because fluids of different viscosities are combined in one sculpture), adding pressure to a valve that is moved slightly out of the vertical lets you manipulate the parabolic trajectory the drop takes when falling, thus making it possible to drop on the spot exactly underneath a valve that just lets drops fall out vertically.

Waves, or symmetry of sculptures

And then, of course, you have to consider the vessel the water drops into. If that reservoir isn’t circular and the drop doesn’t hit it right in the middle, it is very difficult to create symmetric sculptures because the waves radiating from the point of impact (both on the surface and as pressure waves in the water) will, after being reflected by the rims of the reservoir, reach the mid point at different times, leading to an asymmetrical pressure field which will skew the whole sculpture.
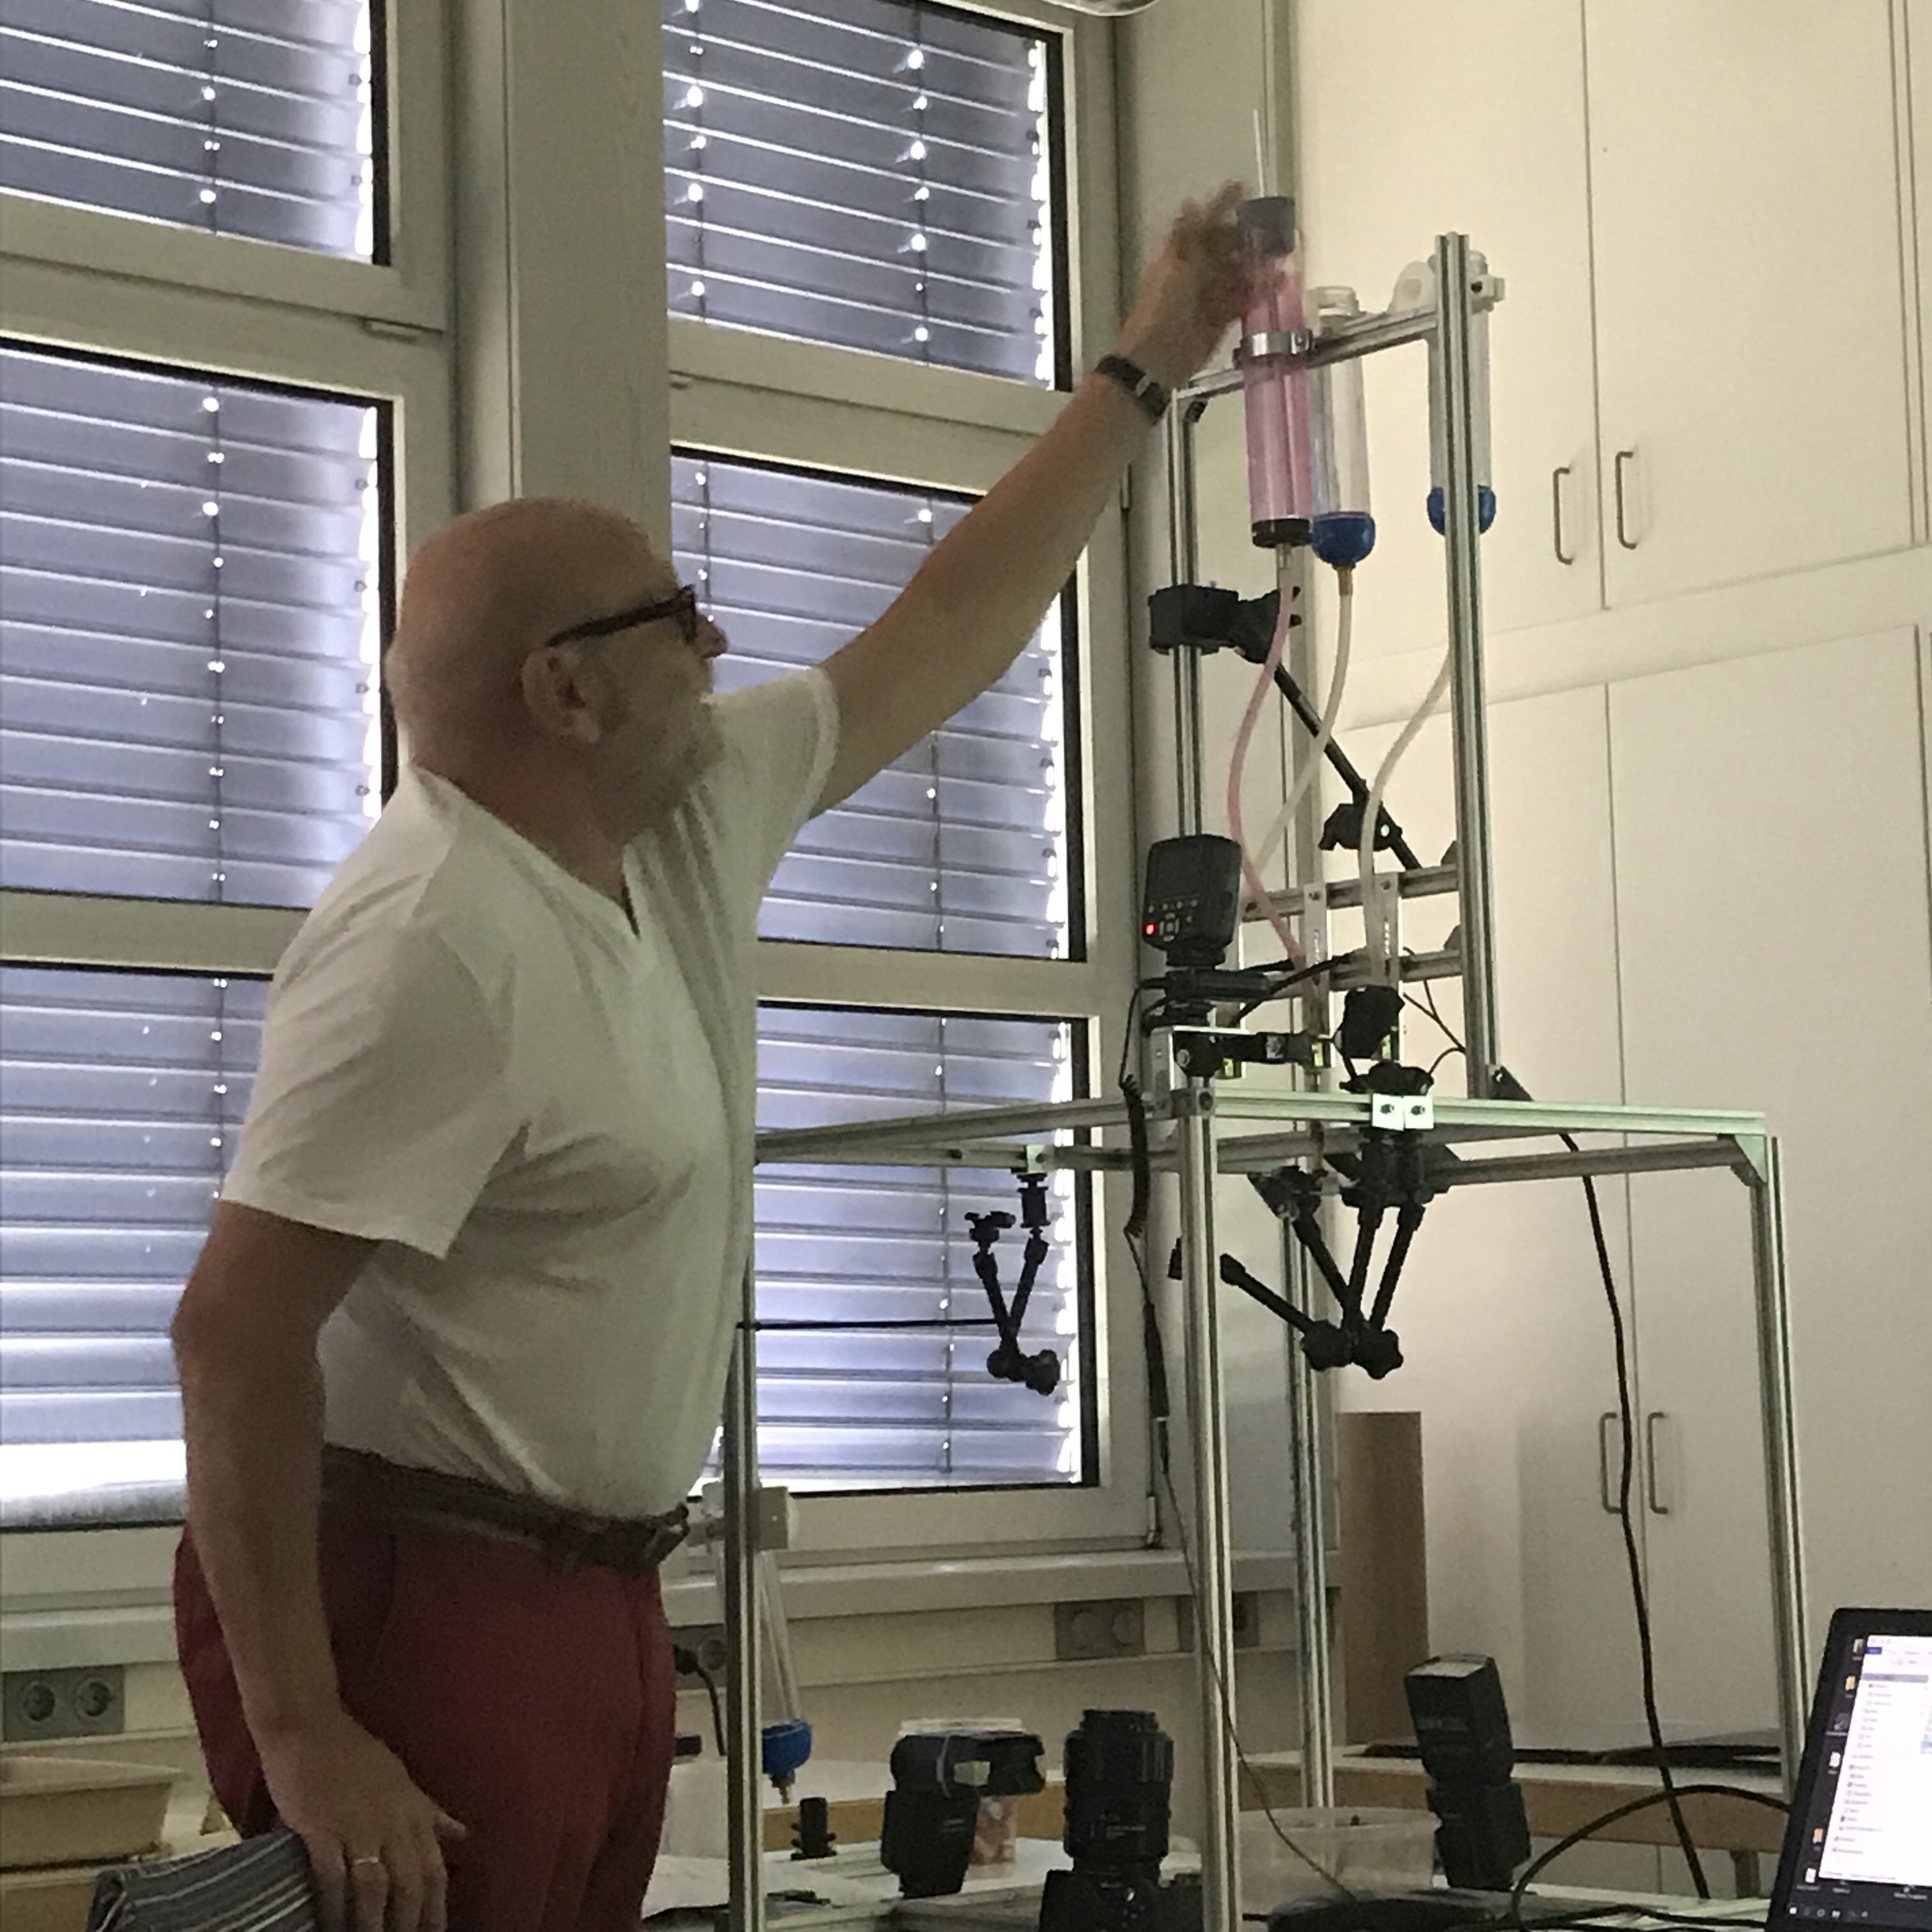
Liquid art by Wlodek Brühl

Liquid art: Wlodek Brühl manipulating the apparatur he uses to create the amazing drop sculptures. Used with permission.

Physics of capturing images

And then, of course, there is all the physics of actually capturing the images. For example, Mr. Brühl mentions that the picture isn’t made by the camera, it’s made by the flash light. The way the pictures are taken that the camera’s exposure is actually fairly long, but the sharp definition is achieved because the flash only lights the sculpture for an extremely short time. And then there are things to consider like at what angle the flash lights the sculpture, how to achive the desired color effects, and many more. And of course writing the software that controlls all this!

More about this in a future post!
Reading the water — a new mystery picture for you! Today: Kiel Holtenau edition

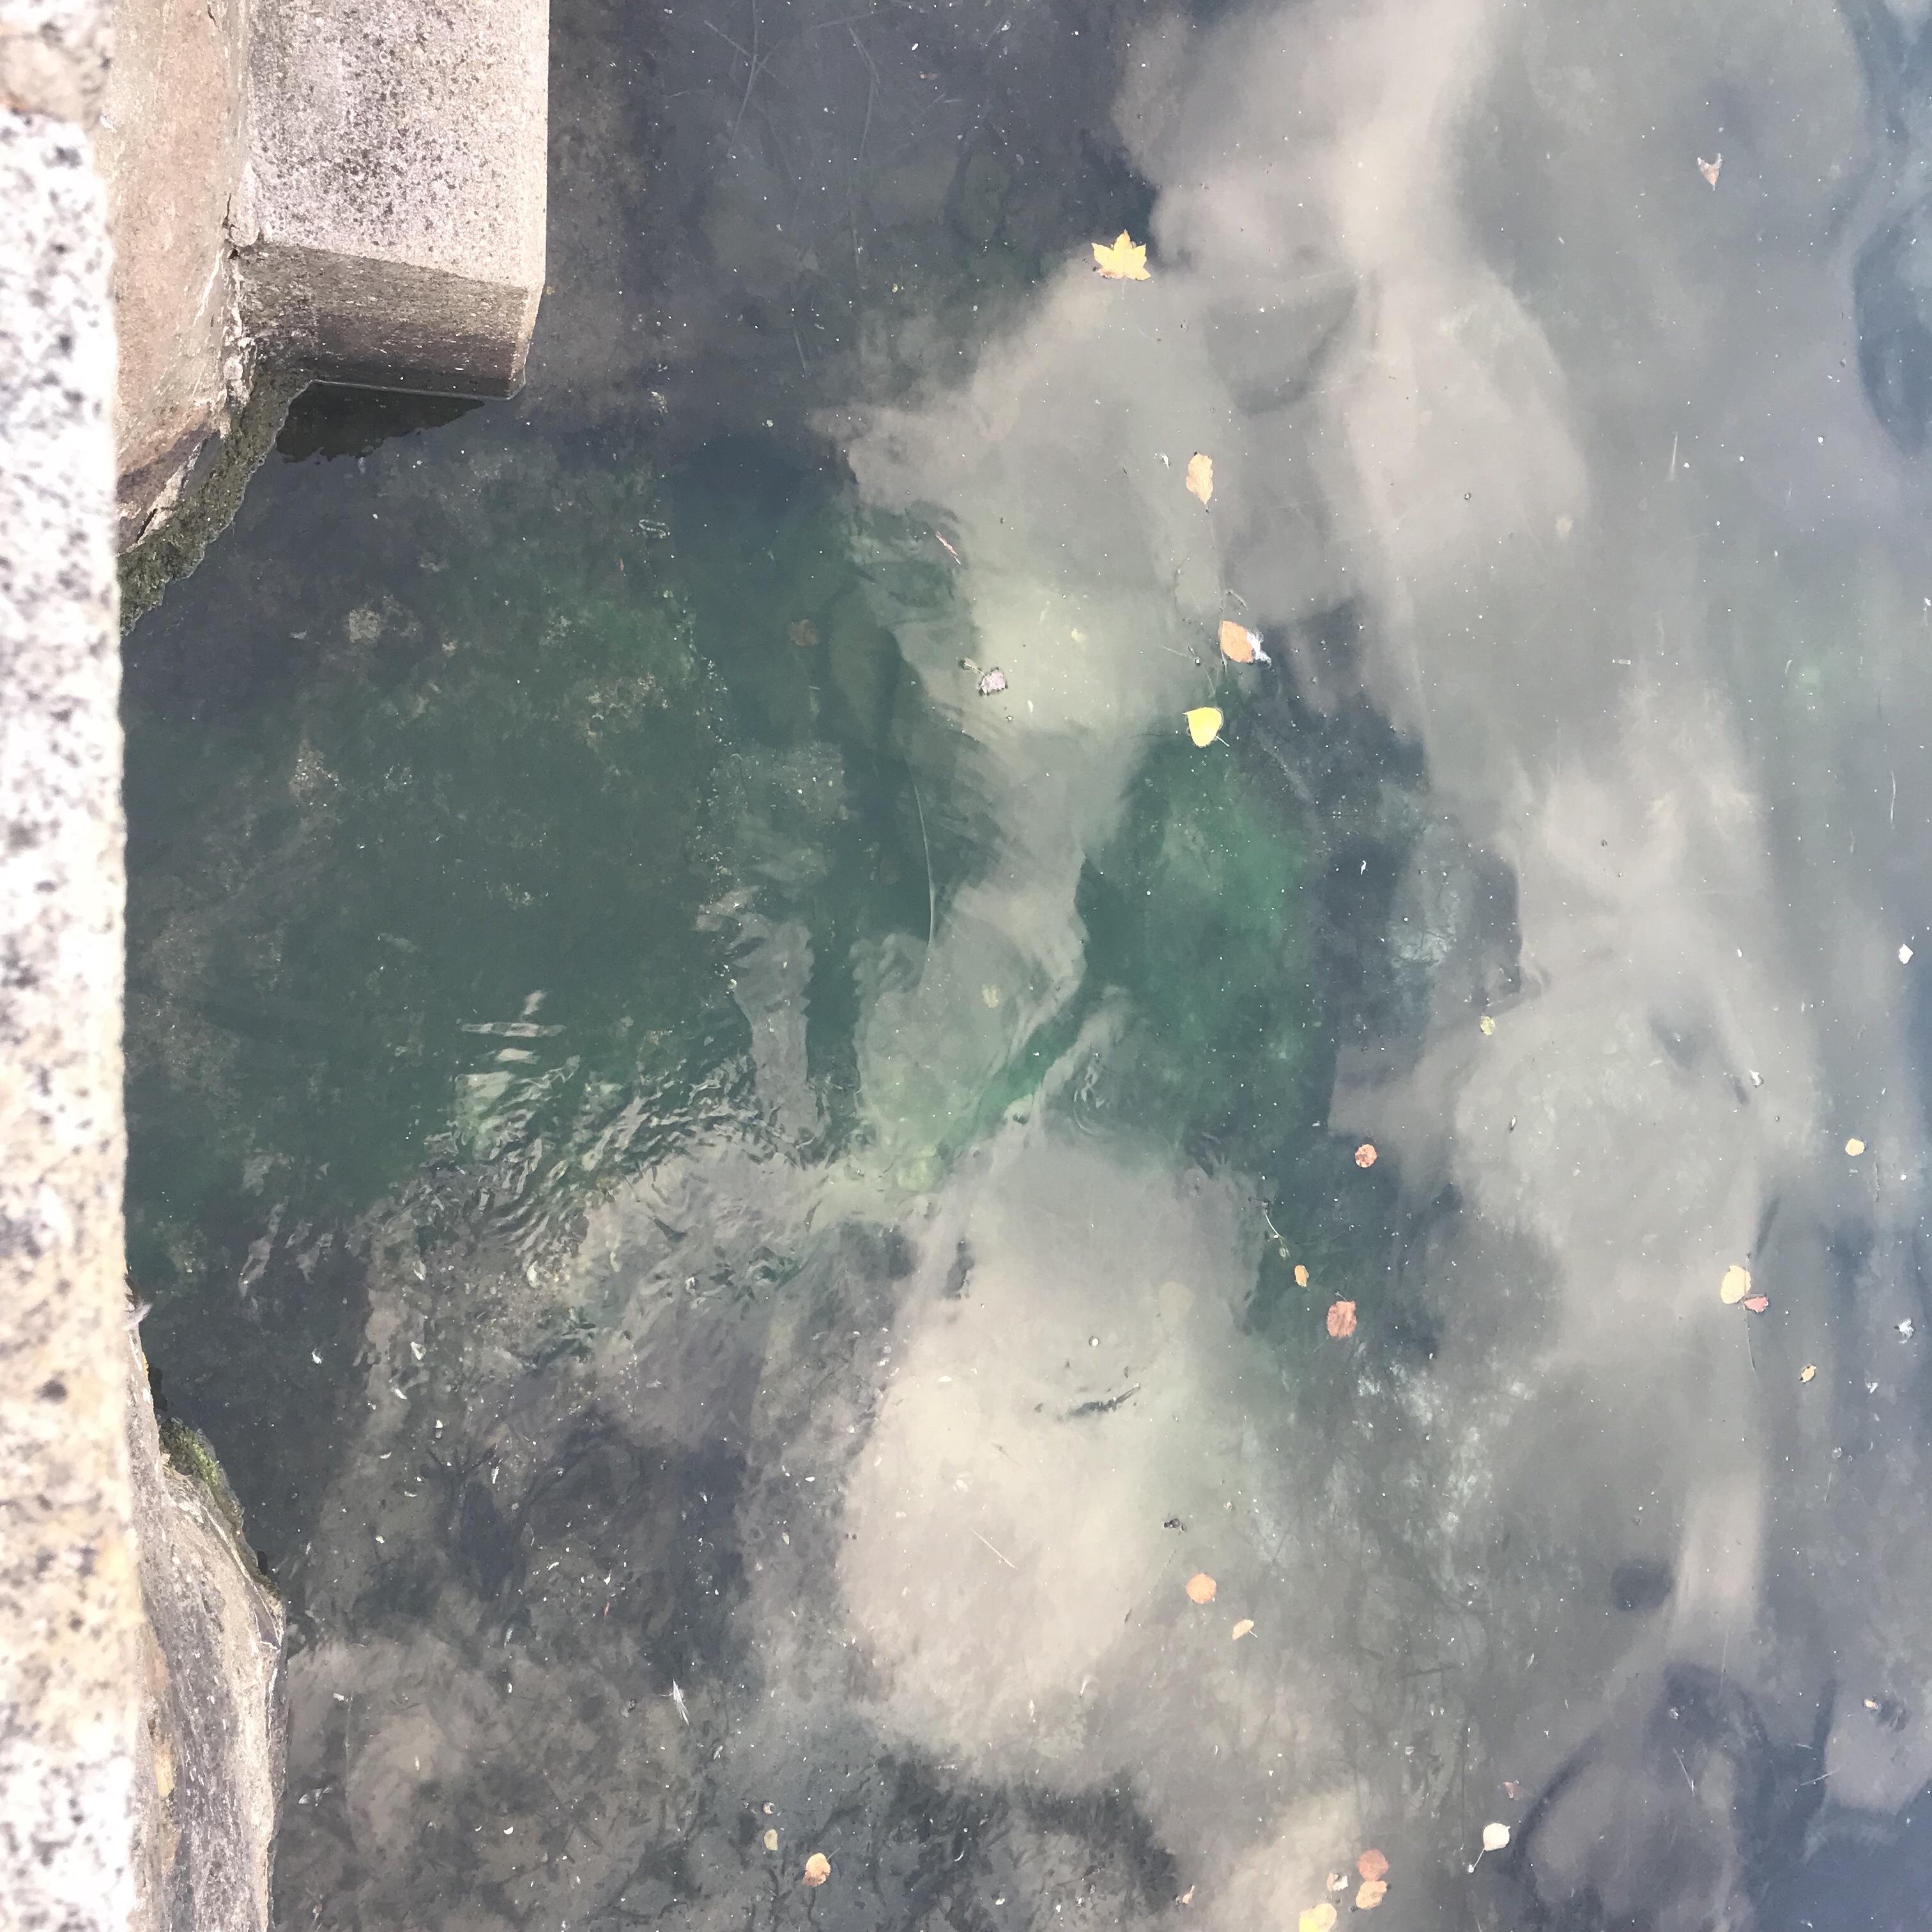
Do you sometimes like to play detective when looking at water and figure out who or what caused certain pattern on the surface? Then I’ve got a nice riddle for you today!

Where do all those lines parallel to the pontoon come from?

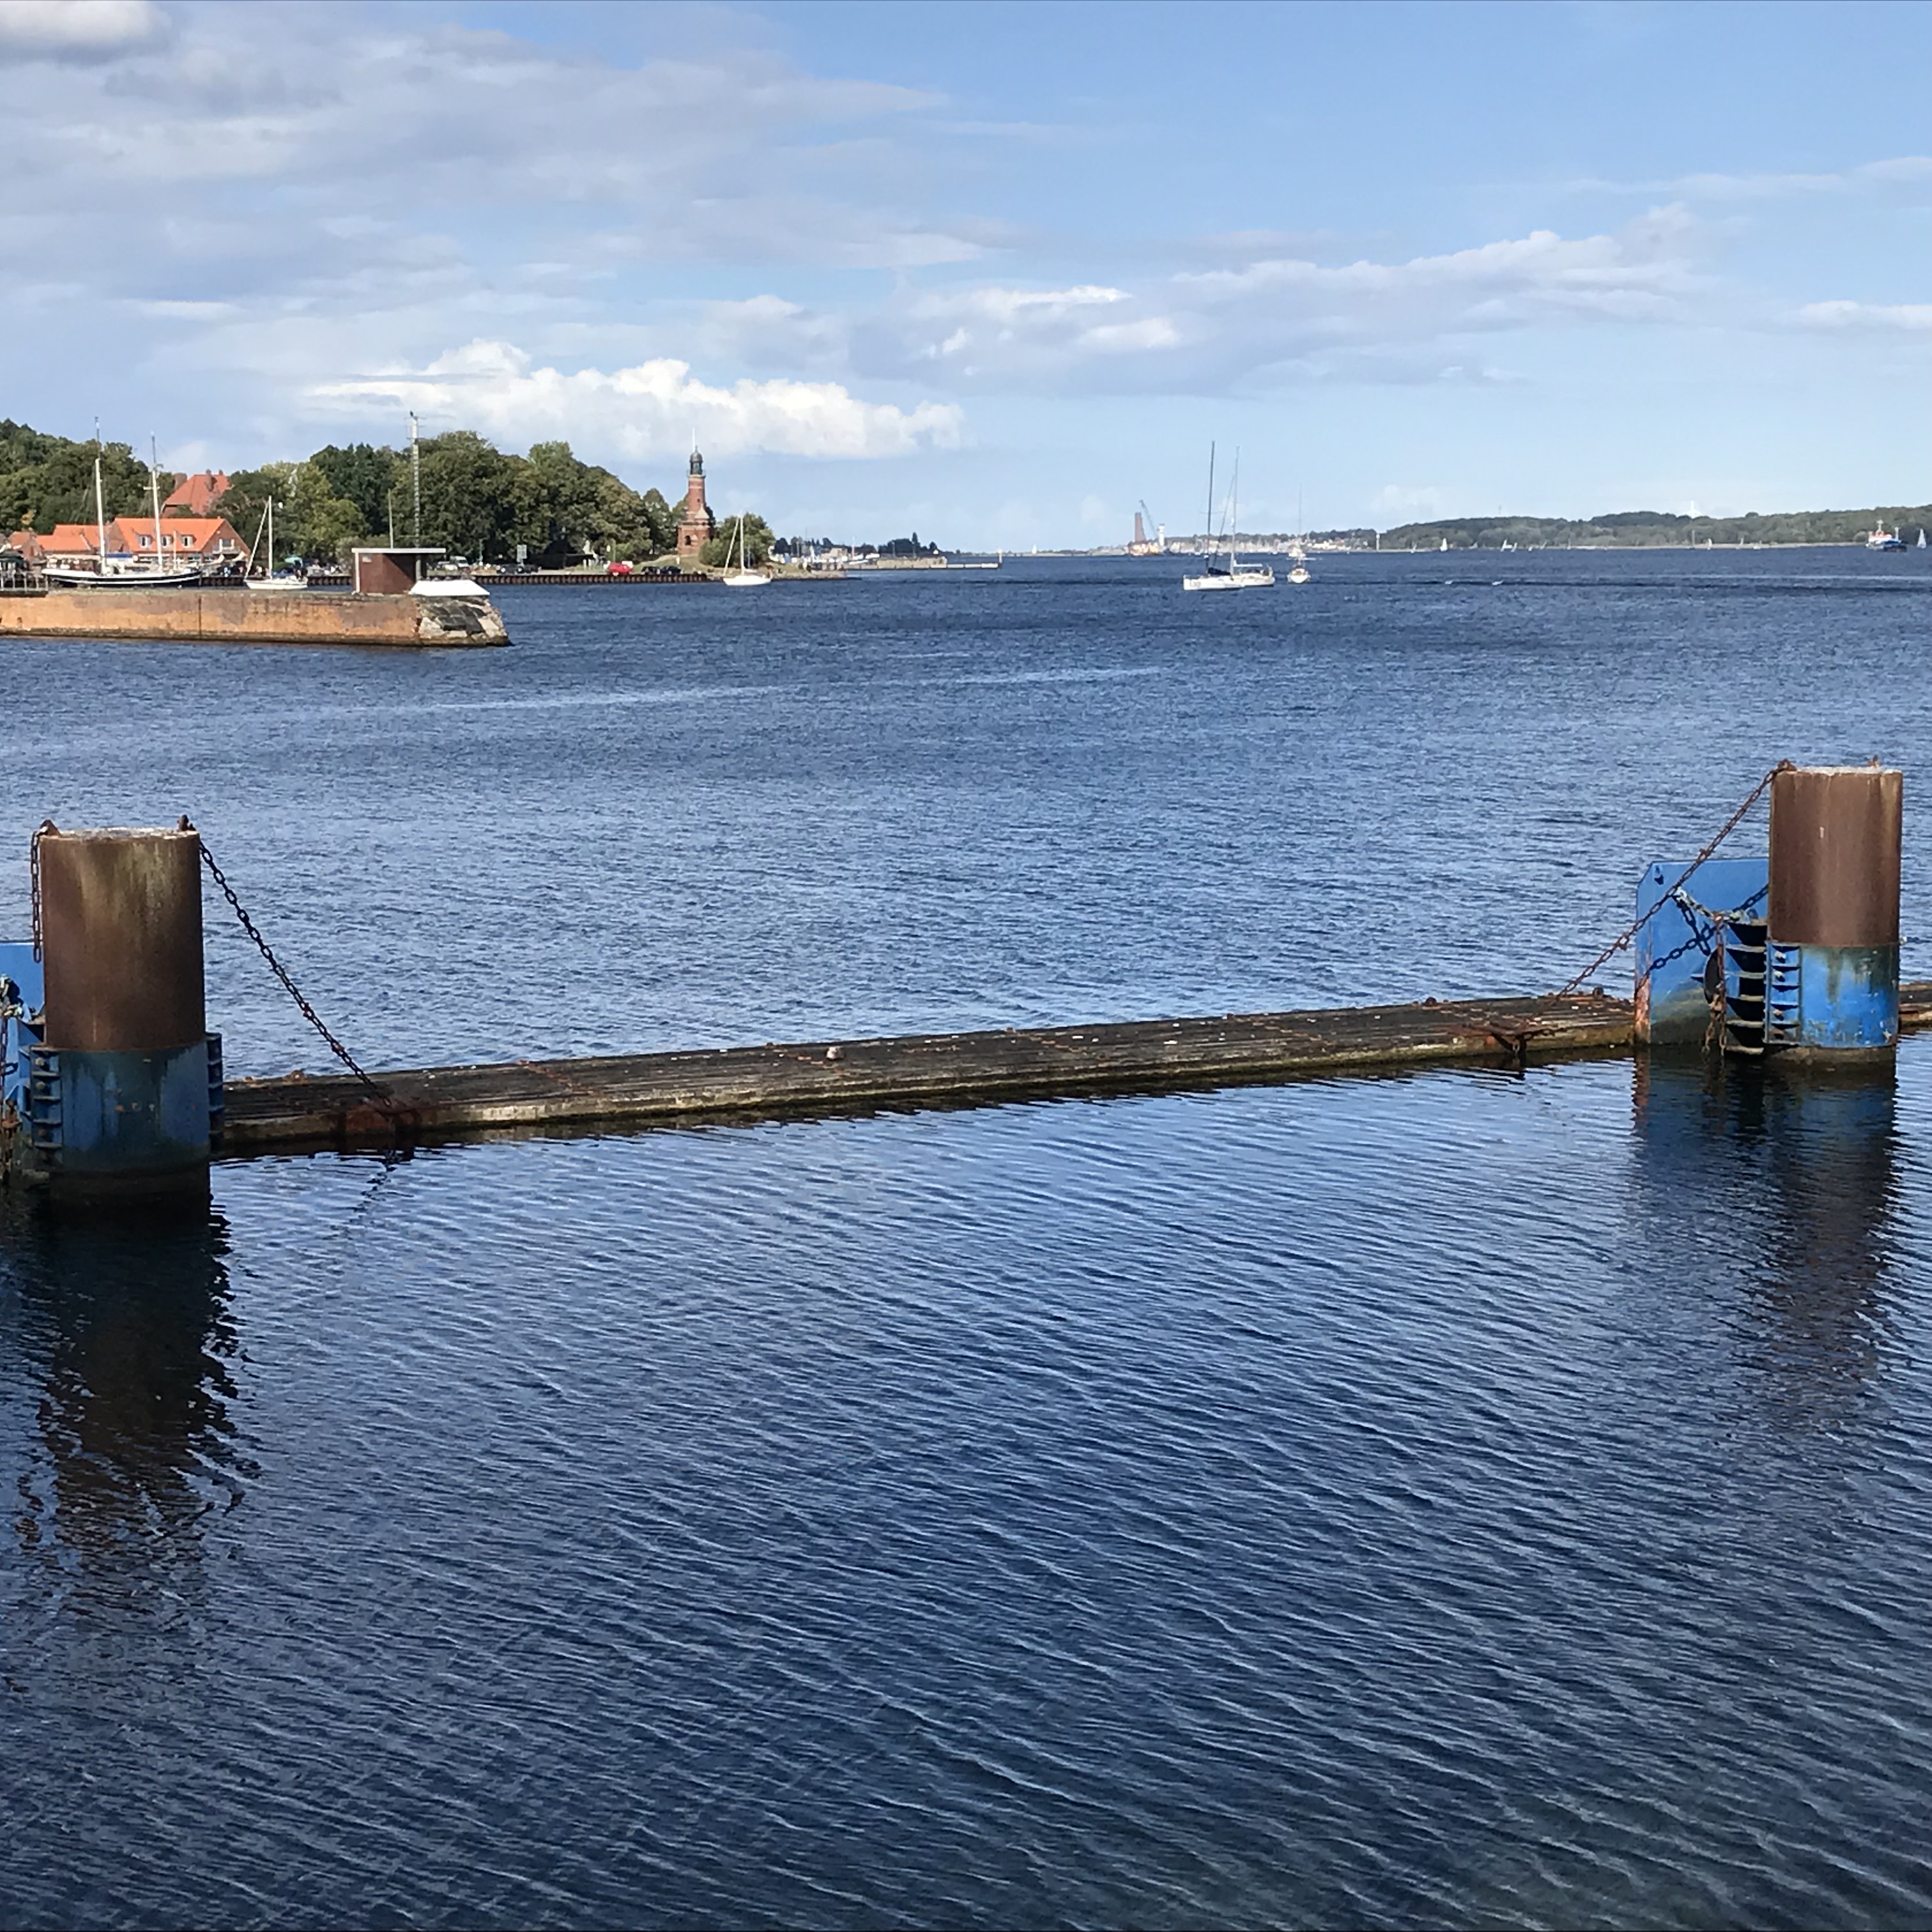
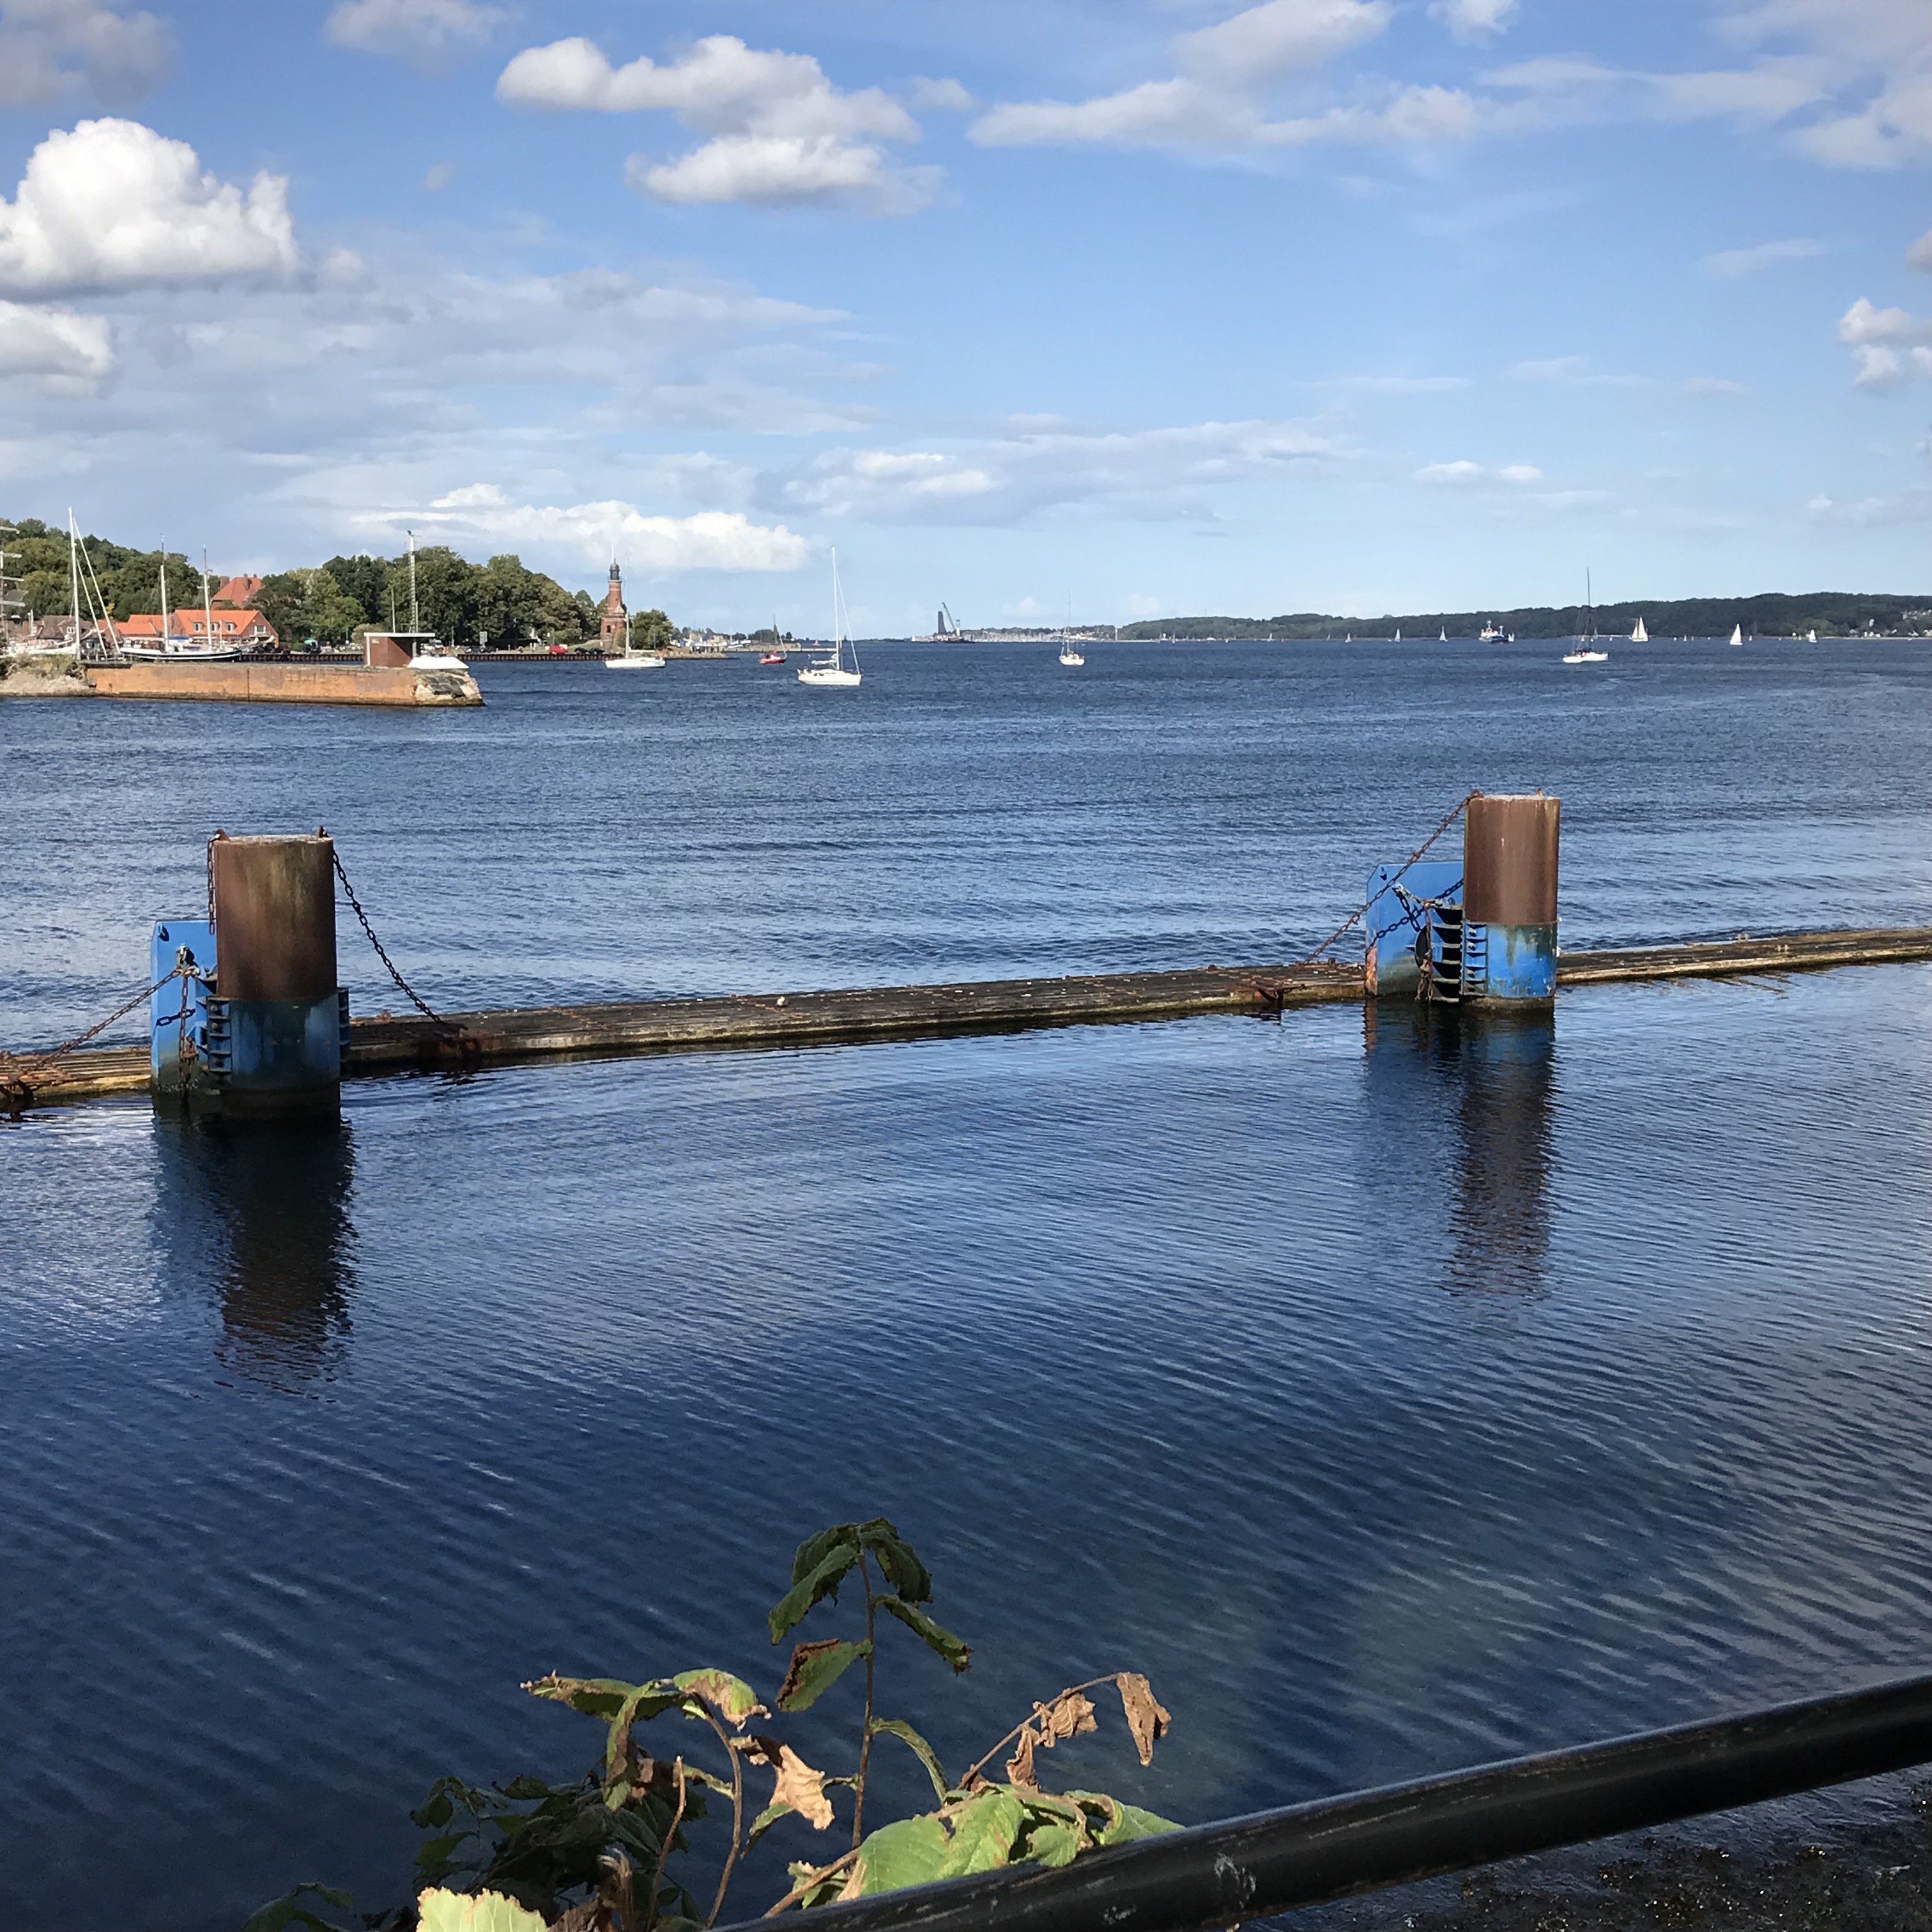
Look at the picture below. Do you see all those parallel lines this side of the pontoon? Any idea what might have caused them?

Hint: The pontoon is floating on the water, and sometimes this happens: Ships pass by.

And when ships come by, they make waves, and then it looks like this:

(full disclosure: As you might or might not see from the waves on the far side of the pontoon in the picture above is that the ship that caused those waves was going into the locks (so right to left) in contrast to the ship in the picture above this one, where the ship went out of the canal and into the Kiel fjord…)

But yes! Ships make waves, which then move the floating pontoon, and with its edge the pontoon generates those long straight wave fronts, one after the next, so they propagate out as parallel lines, following each other!

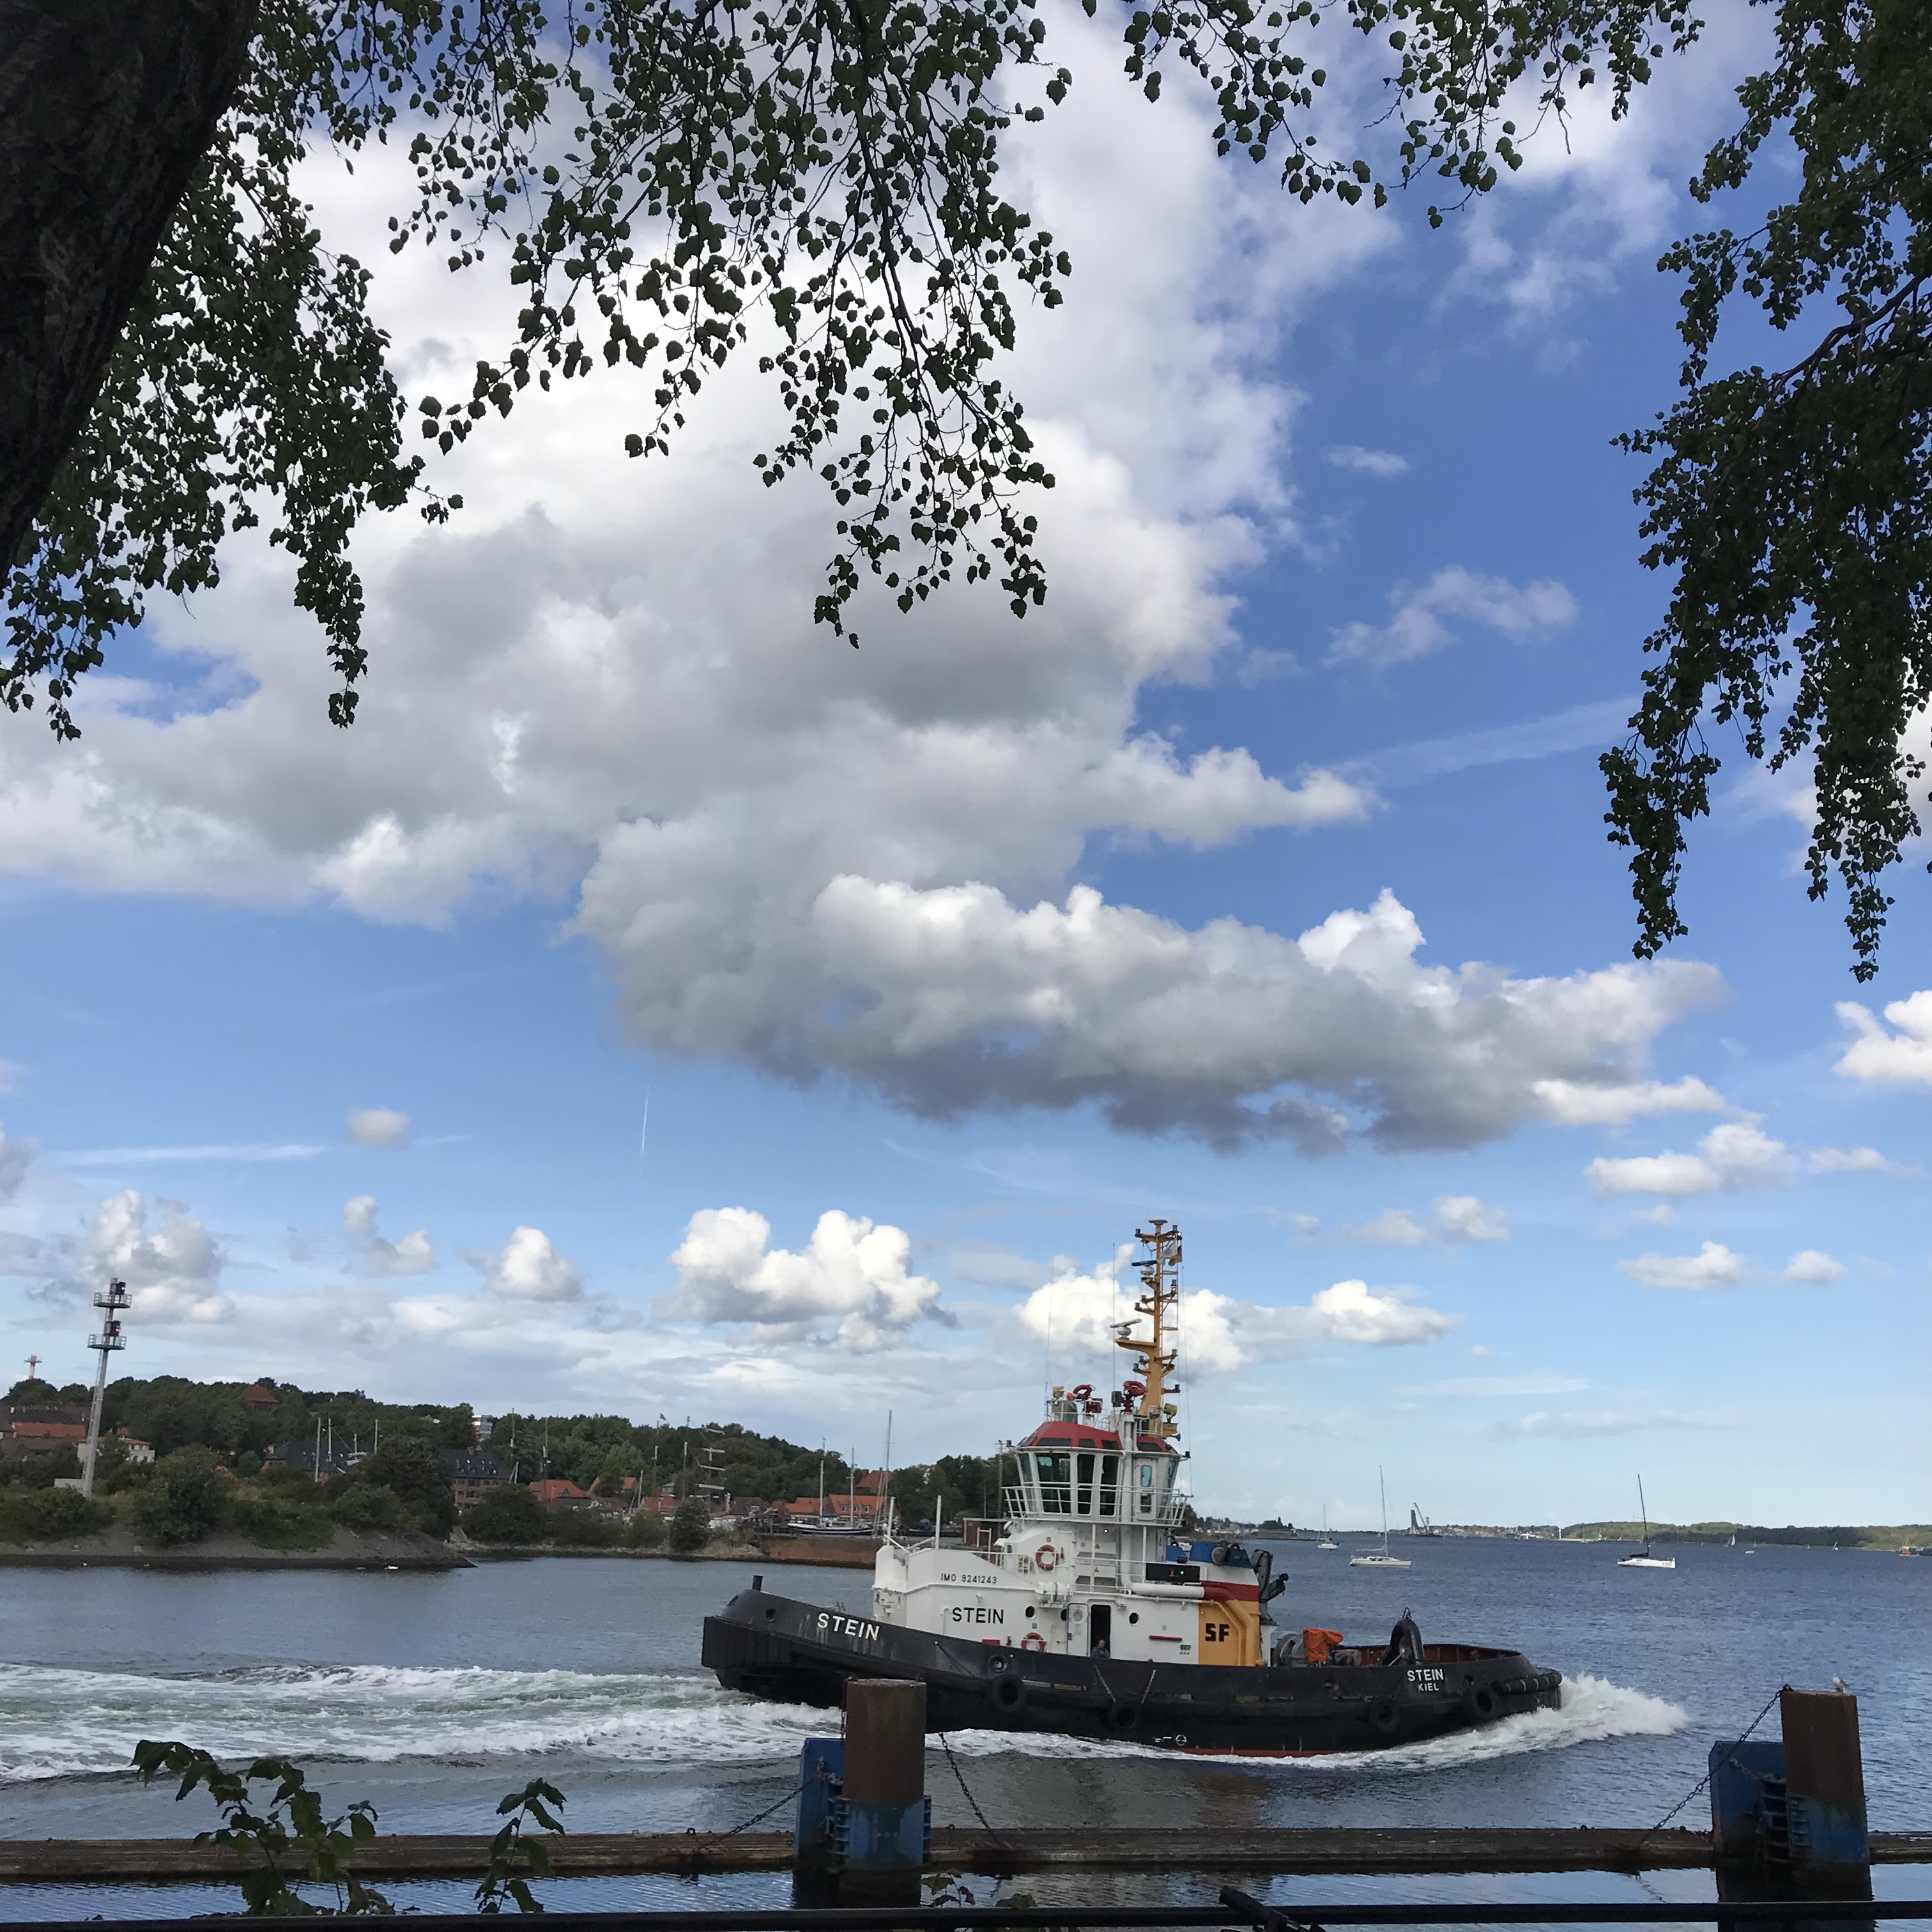
Sometimes also this happens:

Going the wrong way round without any issues! I like tugs, they are just really really cool and I want to drive one some day.

But even without tugs in sight, Kiel is a super nice place to live in…

Happy Sunday evening, everybody! :-)

Layered latte: A great real-life example of double-diffusive mixing!

Sometimes sitting in a café for a work meeting with #lieblingskollegin Julia can lead to unexpected discoveries of oceanographic processes — in my latte! It’s those little things that inspire blog posts…

“Kitchen oceanography” brings the ocean to your house or class room!

Oceanography is often taught in a highly theoretical way without much reference to students’ real life experience. Of course a sound theoretical basis is needed to understand the complexity of the climate system, but sometimes a little “kitchen oceanography” — doing experiments on oceanographic topics with household items — goes a long way to raise interest in the kind of processes that are not easily observed in the real world. I’ve previously written a lot about simple experiments you can perform just using plastic cups, water, ice cubes, and a little salt. But sometimes it’s even easier: Sometimes your oceanography is being served to you in a cafe!

Oceanic processes can be observed in your coffee!

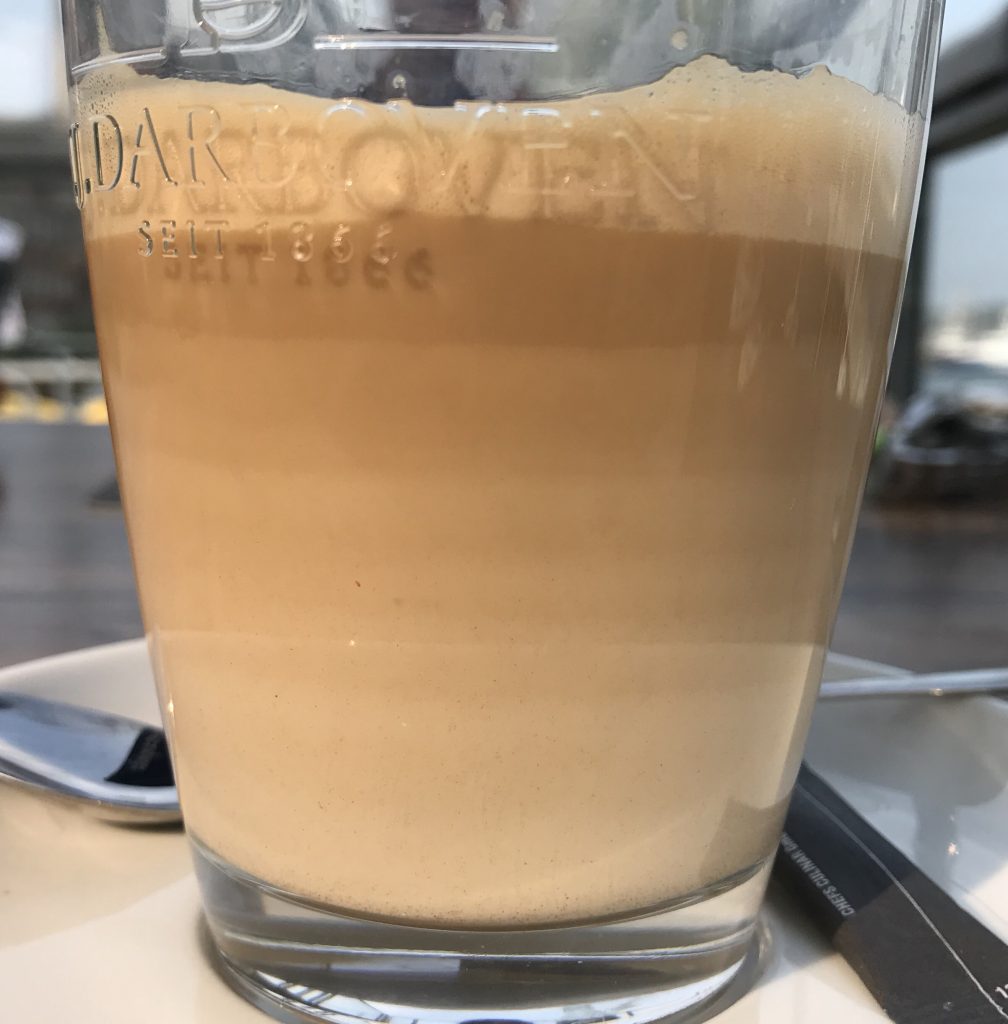
Have you ever looked at your latte and been fascinated by what is going on in there? Many times you don’t just see a homogenous color, but sometimes you see convection cells and sometimes even layers, like in the picture below.

Layers in a latte.

Layers in a latte.

But do you have any ideas why sometimes your latte looks like this and other times it doesn’t?

When you prepare latte in the right way, many layers form

Layers forming in latte (and in the ocean or in engineering applications) are an active research field! In the article “laboratory layered latte” by Xue et al. (2017), the authors describe that the “injection velocity” of espresso into the warm milk has to be above a critical value in order for these pretty structures to form in a latte. They even provide a movie where you can watch the layers develop over a period of several minutes.

The homogeneous layers with sharp boundaries are caused by double-diffusive mixing

Double-diffusive mixing, which is causing the formation of these layers, is the coolest process in oceanography. In a nutshell, double diffusive mixing is caused by two properties influencing density having different rates of molecular diffusion. These different rates can change density in unexpected ways and an initially stable stratification (high density at the bottom, low density on top) can, over time, become statically unstable. And static instability leads to adjustment processes, where water parcels move in order to reach the position in the fluid where they are statically stable — the fluid mixes.

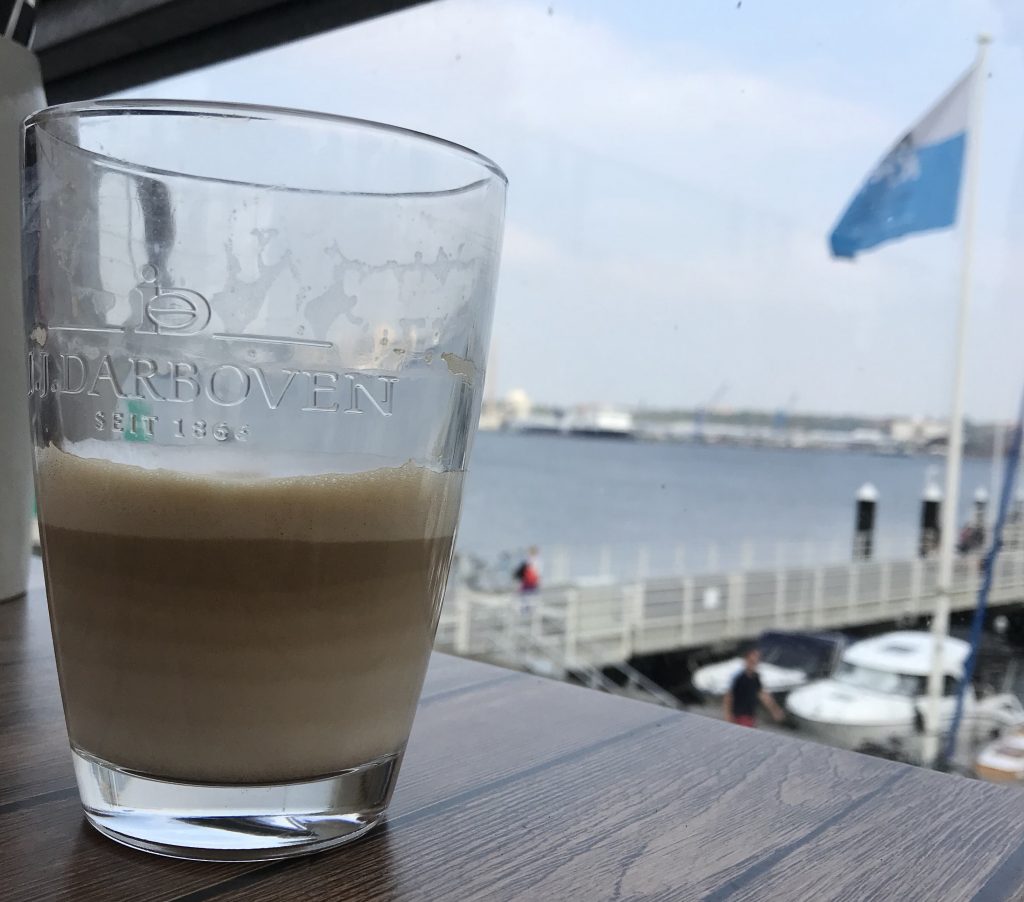
Layers in half a glass of latte.

Layers in half a glass of latte.

But there are more fascinating things going on with the latte. Would you expect this stratification to remain as clearly visible as it is in the picture above even though the glass is now half empty? I did not! And then check out what happens when you move the glass: Internal waves can travel on the boundaries between layers!
You can use this in class to teach about mixing!

Mixing in the ocean is mostly observed by properties changing over time or in space, and even though (dye) tracer release experiments exist, they are typically happening on scales that provide information on the large-scale effects of mixing and not so much on the mixing itself. And they are difficult to bring inside the classroom! But this is where kitchen oceanography and experiments on double-diffusive mixing come in. If you need inspiration on how to do that, I’ve recently published an article on this (unfortunately only in German), but there are plenty of resources on this blog, too. Or shoot me an email and we’ll talk!

P.S.: Even though the coffee company is displayed prominently in the pictures above, they did not pay for my coffee (or anything else). But if they’d be interested and make me a good offer, I’d definitely write up some fun stuff on learning oceanography with coffee for them ;-)

Guest post: Using seawater to make bread!

Last week I got one of the coolest emails I have ever received: Someone had found my blog while googling for the salt content of seawater in order to use it to make bread, and he sent me a couple of pictures the resulting bread! Of course, I asked if I could share it as a guest post on my blog, so here we go (Thanks, Martin Haswell, for this unique and inspiring contribution! See, everybody? Real-world impact of science blogging!):

Making bread using seawater

There is nothing like a challenge from your best friend, to do something that you’ve never done before but might just work. In my case, make bread using sea water.

My friend Mandy had brought me back from New York a copy of Jim Lahey’s book “My Bread”. Jim’s ‘no-knead’ method of bread making uses flour, water, salt (normally) and a tiny amount of yeast – and a lot of time, but no kneading. The dough is left for a long time to rise and is baked very very hot, and makes a tasty and crusty loaf.

Jim has a recipe in his book called  “Jones Beach Bread” in which he uses seawater instead of house water plus salt to make the dough. Knowing that we both used the ‘no-knead’ recipe and that I had access to a beach with clean water, Mandy challenged me to follow this recipe, and this is how it went.

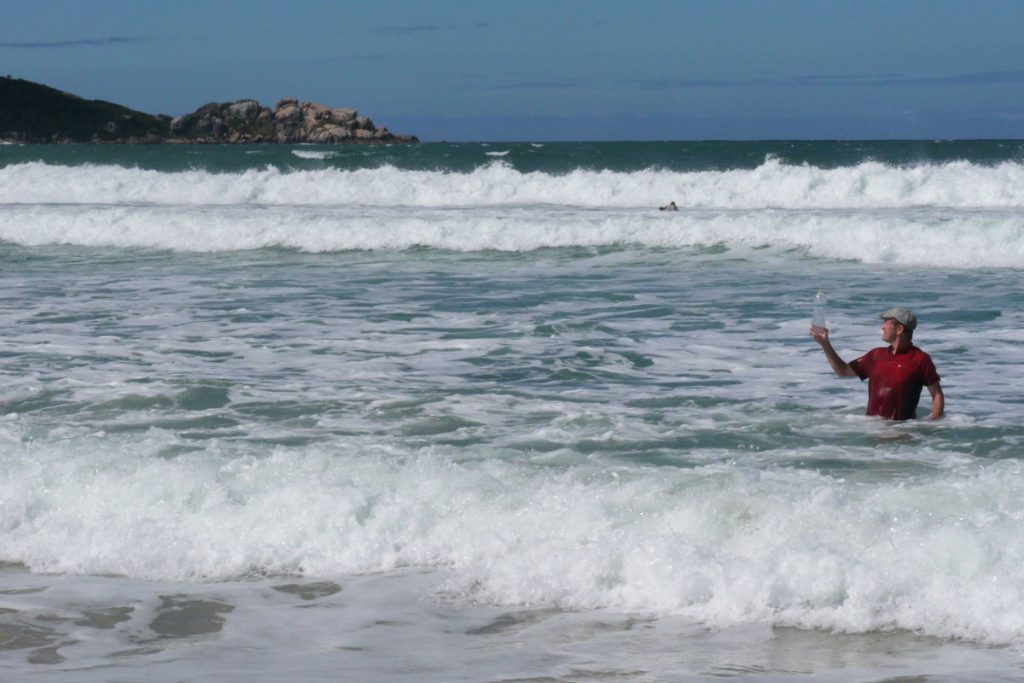
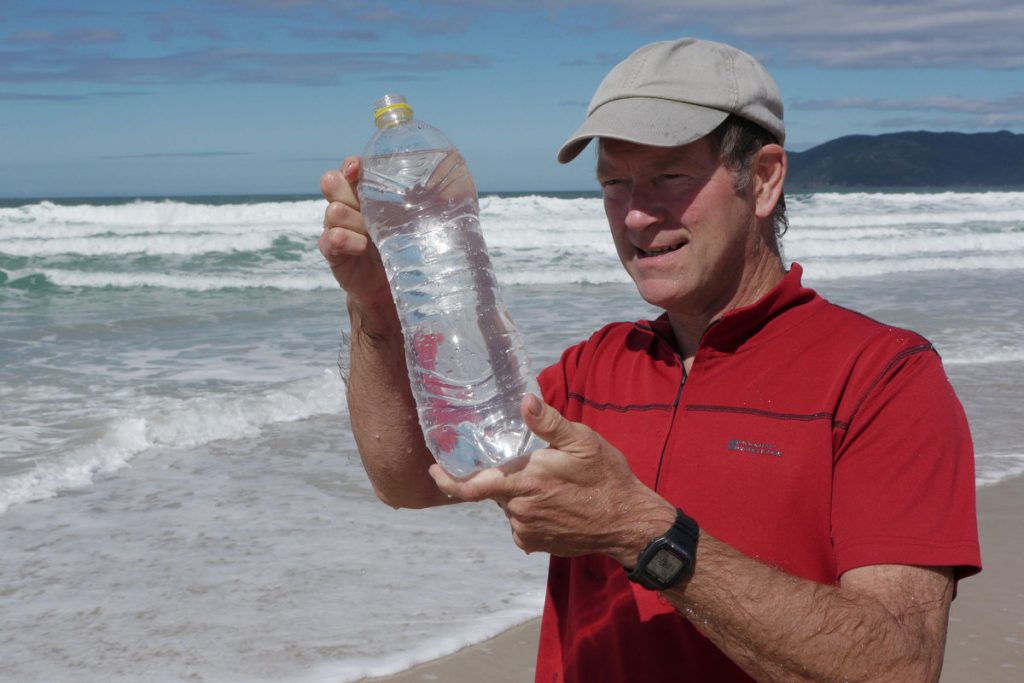
Martin collecting seawater on the beach, far enough out to miss most of the turbidity

Martin collecting seawater on the beach, far enough out to miss most of the turbidity

Martin checking the seawater sample for sand or other impurities

Martin checking the seawater sample for sand or other impurities

Jim Lahey’s book “My Bread” that contains Jim’s 'no-knead' method of bread making used for the bread in this blog post

Jim Lahey’s book “My Bread” that contains Jim’s ‘no-knead’ method of bread making used for the bread in this blog post

Waiting for the bread to raise

Waiting for the bread to raise

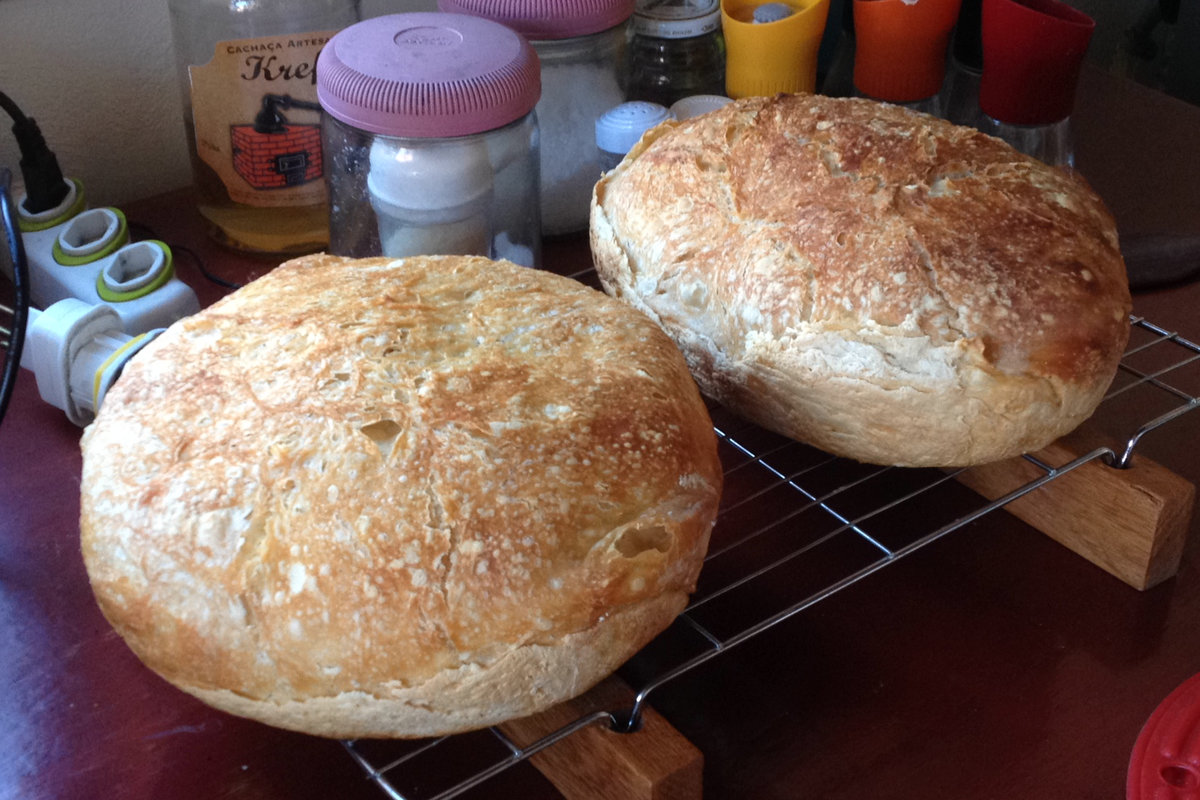
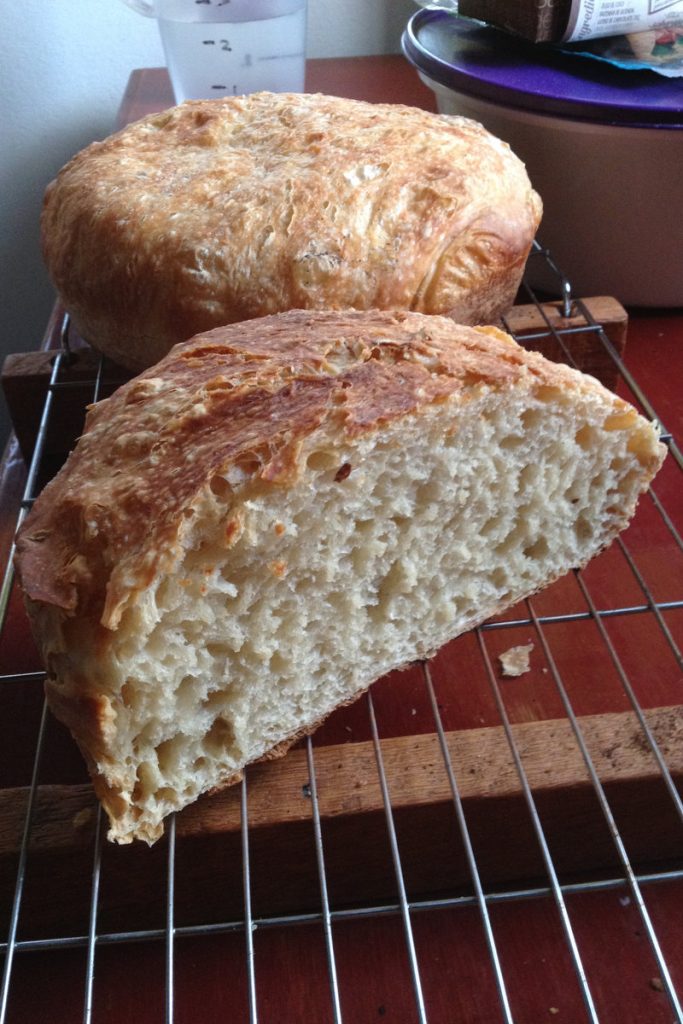
The finished result! Doesn't it look delicious?

The finished result! Doesn’t it look delicious?

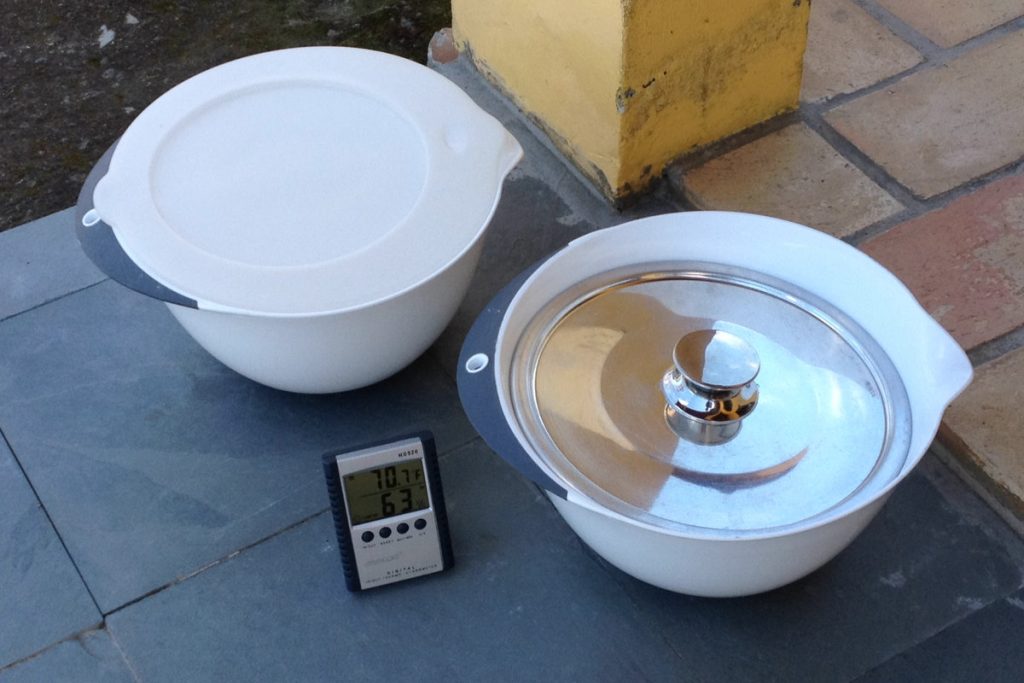
The bread tasted very good, crusty and tasty. I made two loaves, one with the seawater filtered through a coffee filter and the other with unfiltered seawater. Normally this recipe needs around 12-18 hours rising time but this took 28 hours for the two risings, but it is winter in southern Brasil (Florianópolis, on the coast) and the day temperature was only 72F (22°C) on the day of the experiment. It’s also possible that the greater proportion of salt might have hindered the development of the yeast and held back the rise. This wasn’t a very scientific experiment.

I calculated that Lahey’s original no-knead’ recipe calls for 8g salt to 300g of water which makes 26.66g per litre, whereas sea water (according to Mirjam’s 2013 blog is 35g/litre so this should mean that the sea bread loaf should be around 30% more salty than normal; if I’m honest, it didn’t tasty significantly more salty).

Further experiments: the obvious test would be a sea water loaf vs conventional made, risen and baked at the same time.

Notes:

The Jones Beach in Jim’s recipe is the Jones Beach State Park on Long Island, New York State. The current water cleanliness data is here (PDF), scroll down for the Jones Beach SP results.

The beach that I collected my sea water from is currently ‘própria‘ but I wouldn’t collect after heavy rain (runoff) or heavy seas (turbidity).  As a safety precaution one could boil the sea water and let it cool just enough before using. In fact, when the weather is cold, that would be the best way of giving the bread a good start.

[note by Mirjam: I’ve done a super quick google search and it looks like typical salinities for the Florianopolis area can go down to 30-ish and thus be lower than the typical, open ocean value of 35, but during summer they might go up to 37 (Pereira et al., 2017) but in addition to the seasonal changes, your salinity probably depends very much on which beach you took the water sample at (for example if it was a lagoon-ish beach with a lot of freshwater runoff and not so much mixing with the open ocean). Since you collected the water fairly close to the beach and during winter, it’s likely that the salinity wasn’t quite as high as the 35 I mentioned (which would explain why the bread didn’t taste as salty as you might have expected). If you wanted to know the exact salinity next time you are making bread, an easy method to measure the salinity of sea water would be to boil a liter until all the water has evaporated and weigh the remaining salts. This isn’t very precise for oceanographer-standards, since some of the substances that oceanographers include in their measure of “salinity” in sea water at normal temperatures might actually evaporate with the water, but since the largest constituent of the “salt” in sea water is just normal NaCl, the mistake you’d be making is probably small enough for cooking purposes, and you’d get a general idea of how “typical” your sample is in terms of seawater salinity.]

Bio:

Martin Haswell is an English photographer who loves travel and making bread.

Alexander’s band: the dark space in between a primary and secondary rainbow

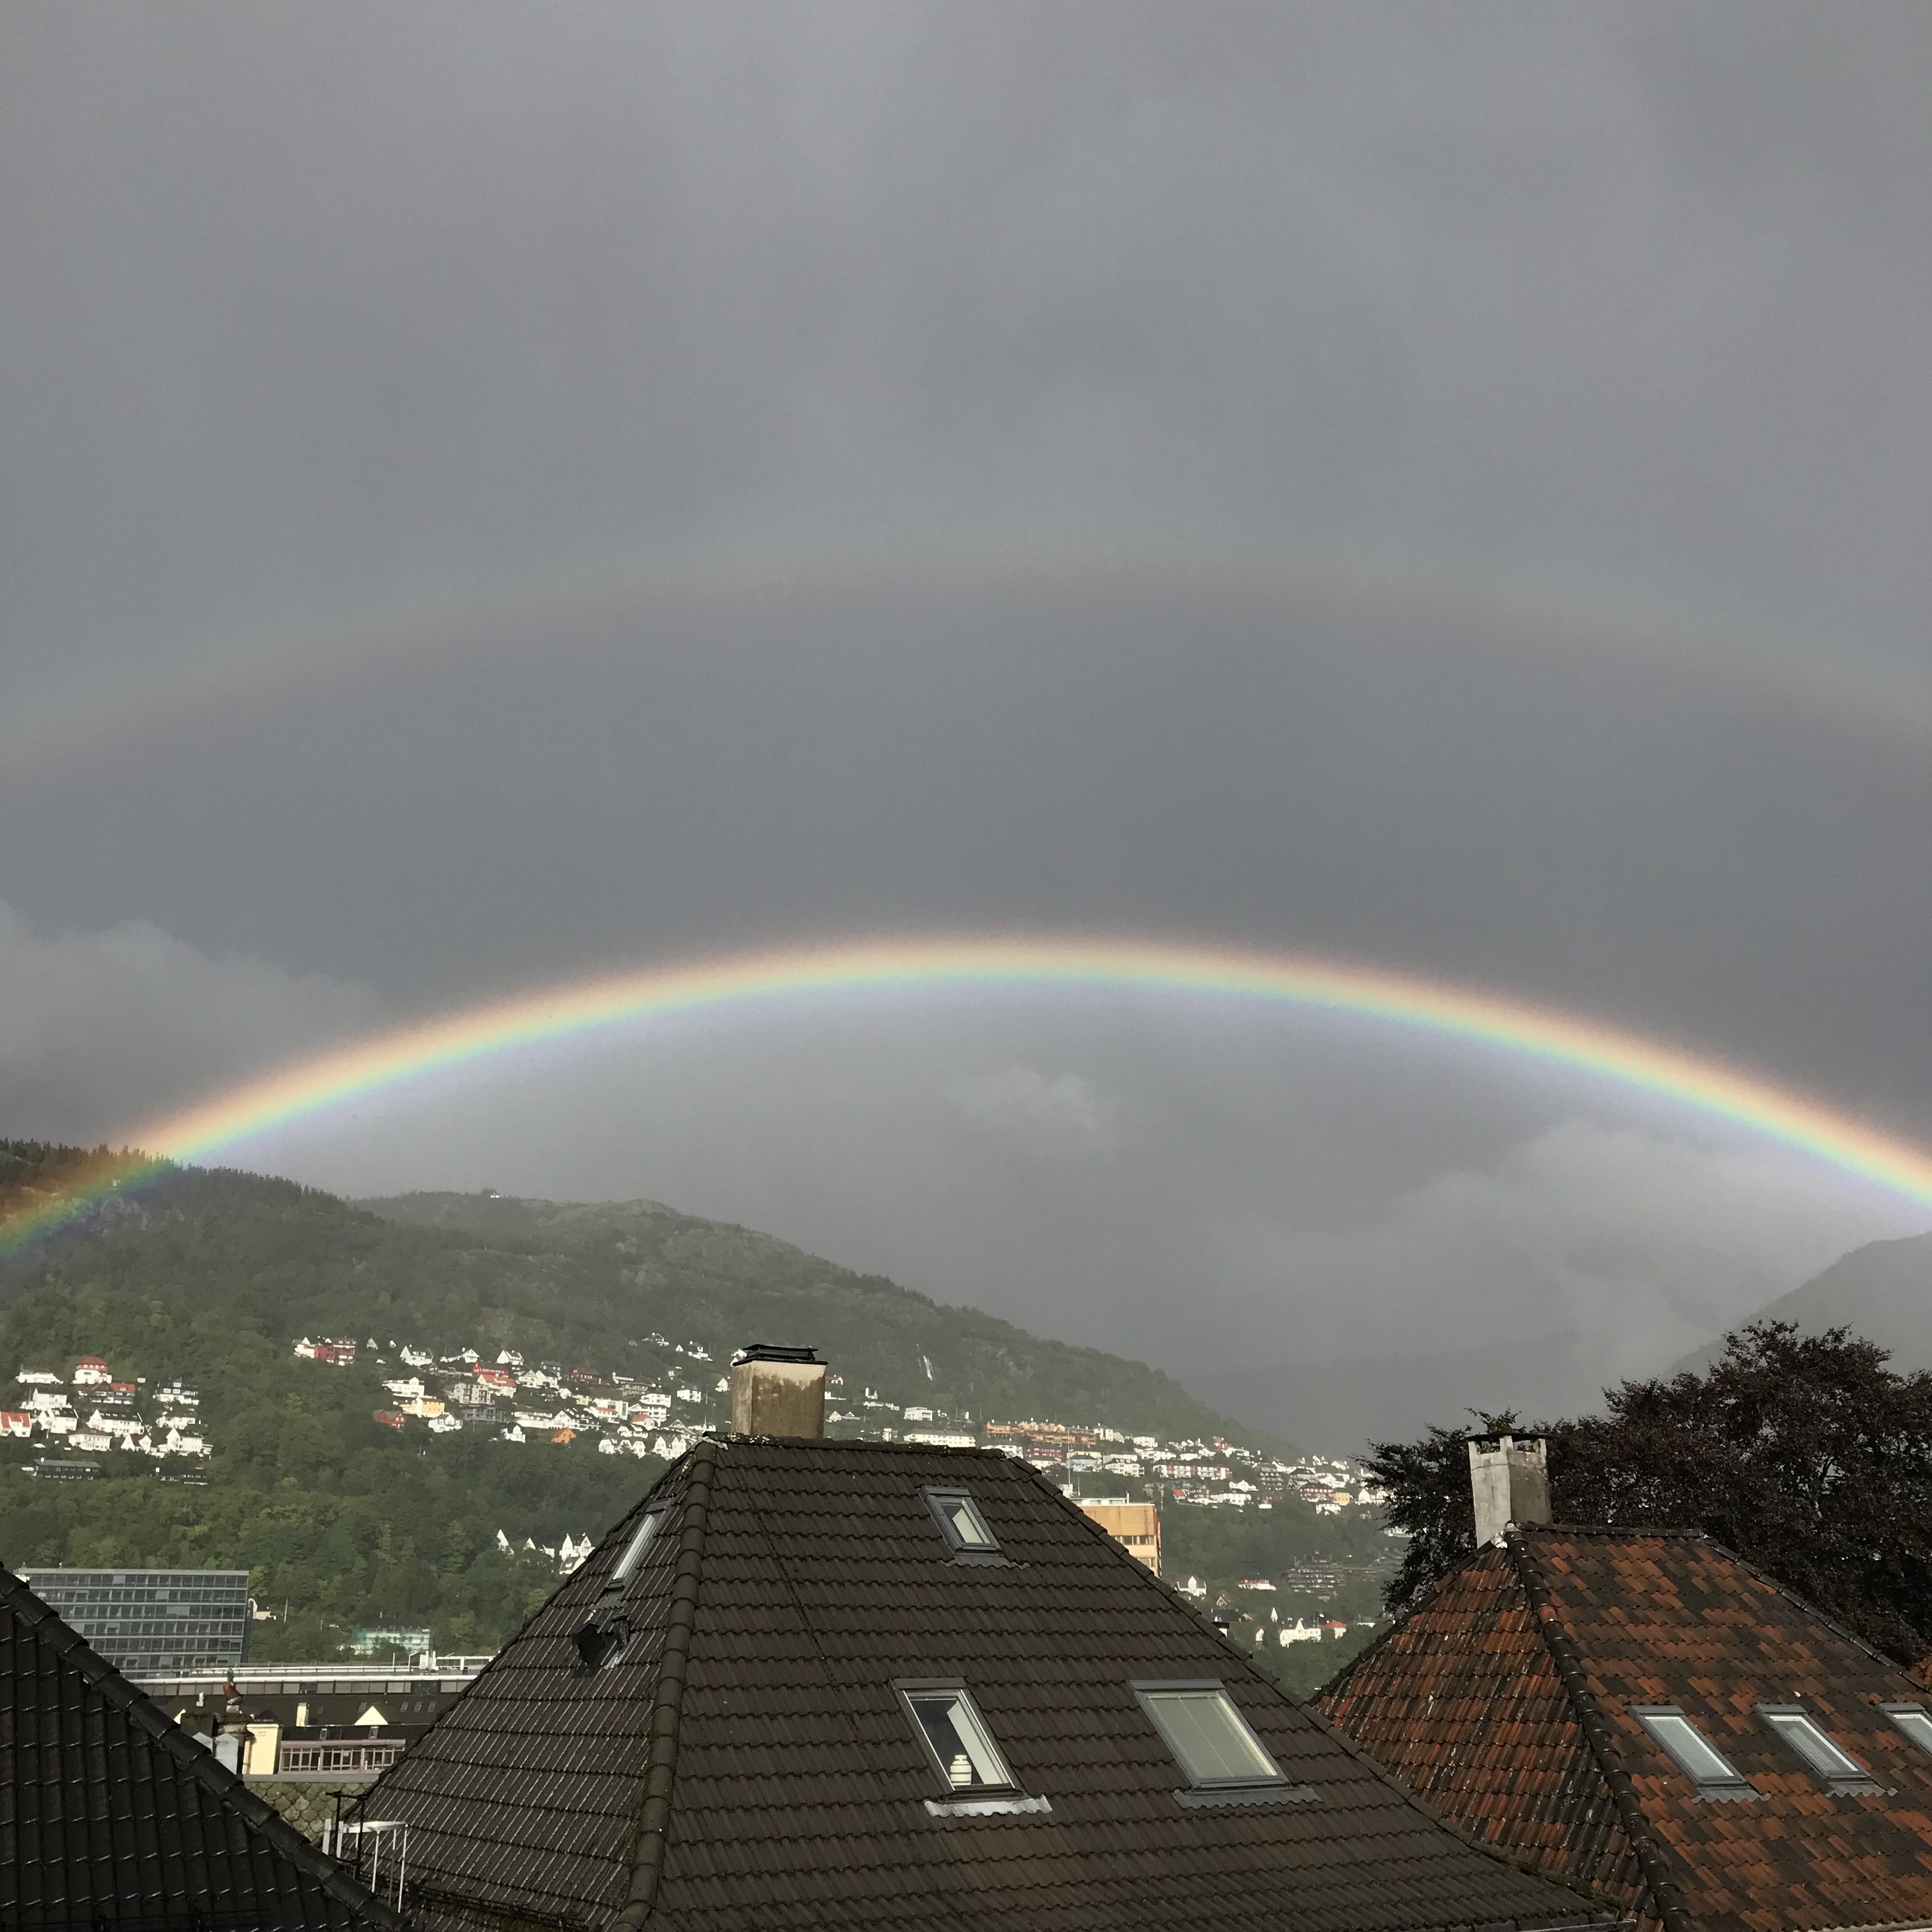
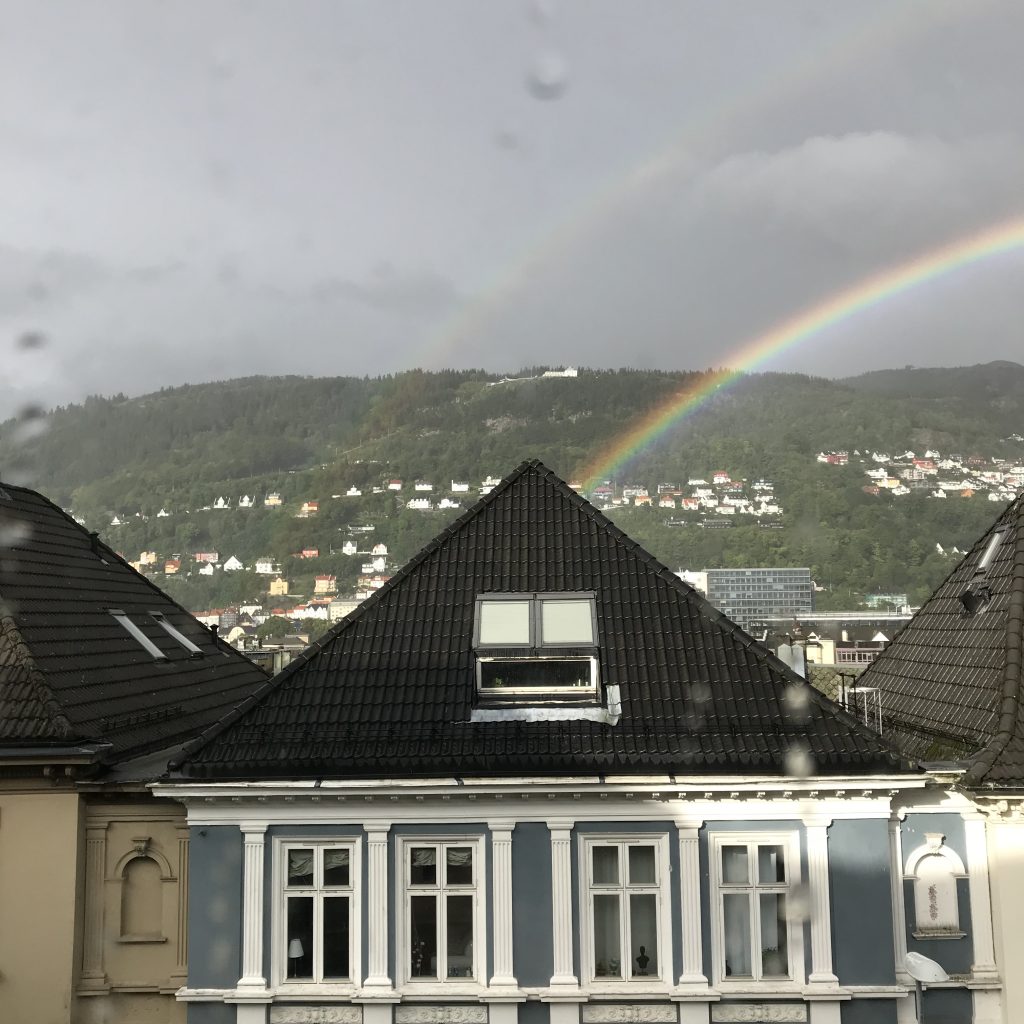
Bergen is a fairly wet place with on average 240 rain days every year. But that actually provides us with the perfect opportunity to see plenty of rainbows. Here is the view from the window of my apartment in the university guest house yesterday (and I love the raindrops on the windowpane!):

Bergen, Norway: primary and secondary rainbow on August 17, 2018. Note the "Alexander's band", the dark space between the two rainbows!

Bergen, Norway: primary and secondary rainbow on August 17, 2018. Note the “Alexander’s band”, the dark space between the two rainbows!

Isn’t this beautiful?

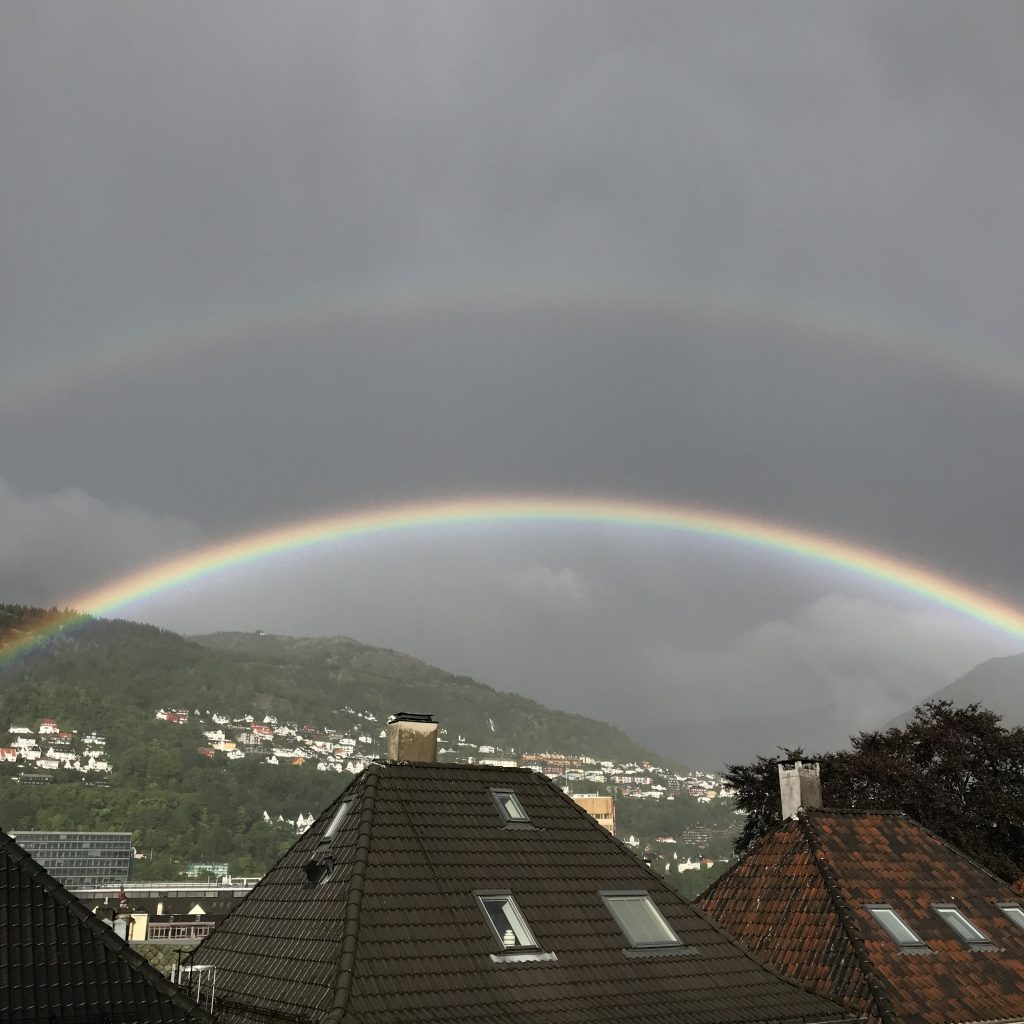
I am always fascinated by the intensity of the colors in a rainbow, and in cases where you get a primary and a secondary rainbow, of the darkness between those two. That area is called “Alexander’s band”, and occurs because the inner, primary rainbow focusses light towards its inside, whereas the outer, secondary rainbow spreads it towards its outside. So we end up with this dramatic dark band in between the two. I love how dramatic it looks!

Bergen, Norway: primary and secondary rainbow on August 17, 2018. Note the "Alexander's band", the dark space between the two rainbows!

Bergen, Norway: primary and secondary rainbow on August 17, 2018. Note the “Alexander’s band”, the dark space between the two rainbows!

Fun fact on the side: A couple of years ago I did a couple of short movies on optics in rainbows, when I was playing around with different styles of teaching videos. Watching them back today is so painful, but at least this blog helps me to remember how far I have come… ;-)

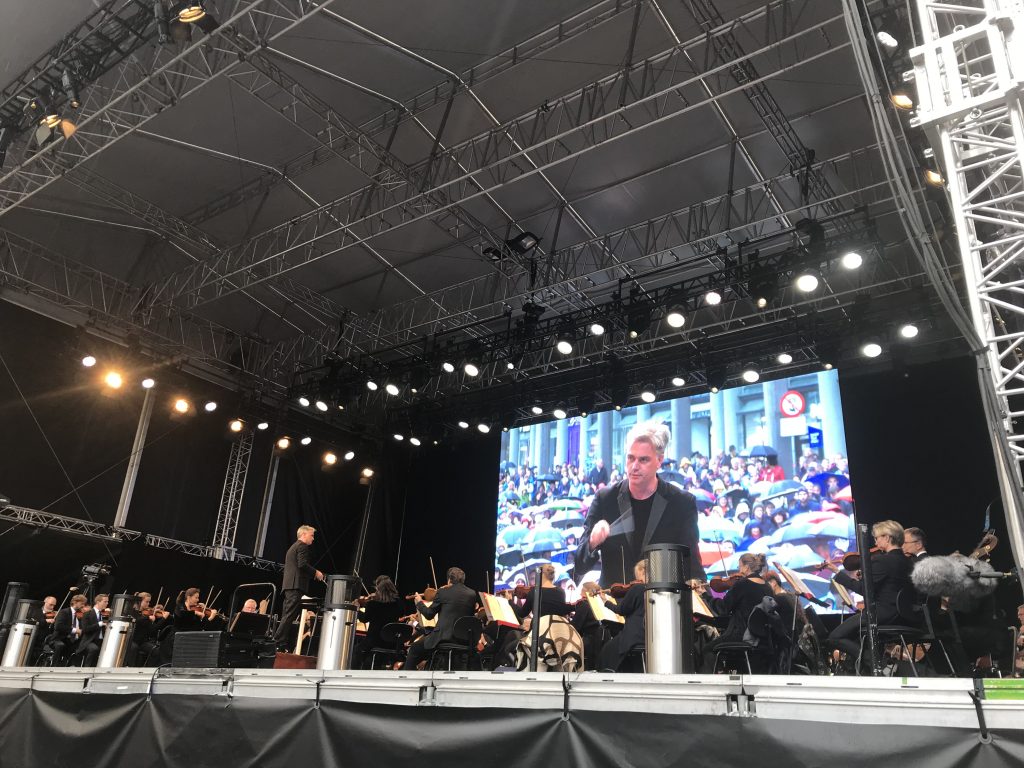
But let’s get back to talking about the weather. As I learned during the “summer concert” of the Bergen Filharmoniske Orkester yesterday: According to conductor Edward Gardner, translating from Det finnes ikke dårlig vær, bare dårlige klær, “there is no such thing as bad weather, only bad cleather”. Hahaha.

Summer concert of the Bergen Filharmoniske Orkester under conductor Edward Gardner on August 17, 2018. On the big screen you get a glimpse of what the weather was like...

Summer concert of the Bergen Filharmoniske Orkester under conductor Edward Gardner on August 17, 2018. On the big screen you get a glimpse of what the weather was like…

Above, on the big screen behind the orchestra, you see the kind of clothing that was appropriate for the occasion. That was one brilliant concert and totally worth sitting in the pouring rain with rain coat, rain pants, waterproof shoes! There really is no such thing as bad weather! :-)

Waves in a density stratification. One of the most beautiful tank experiments I’ve ever seen.

It’s pretty impressive when a mountain moves through a stratification and generates lee waves. But what I find even more impressive: The waves that travel behind the mountain when the mountain is long gone. See here:

This kind of stuff looks more like a numerical simulation than something actually happening in a tank, doesn’t it? I am pretty stoked that we managed to set up such a nice stratification! Those are the things that make me really really happy :-)

(The setup of this experiment is the same as in this post)