Tag Archives: art

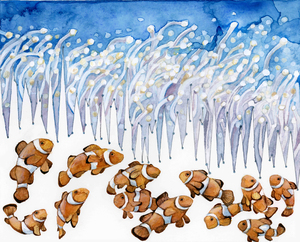
“Liquid art” by Wlodek Brühl, and how it could be used in physics teaching

Do you sometimes feel that wherever you go, you just happen to observe something that makes you think about physics? I definitely do, and that’s what happened to me again this Sunday.

#diwokiel — one week full of exciting events related to digitalization of the world

It’s currently #diwokiel, a week-long event on all kinds of aspects of digitalization. I went to a talk on his “liquid art” by Wlodek Brühl. Mr. Brühl forms sculptures out of water drops and documents those sculptures through photography. But “forming sculptures” really doesn’t begin to convey  the process through which this happens and the level of expertise and precission that is needed. Below, you see an example of one of his sculptures on the projection (for more of his absolutely breath-taking art, check out the portfolio on his website!), and the apparatus with which this kind of art is generated on the left.

As you might been guessing from the kind of setup already, there is an enormous amount of physics that goes into creating this kind of sculptures!

Using art as a hook to talk about physics

And we are back to a favorite topic of mine: How to use art in science communication!

One challenge that science communiction faces is how to reach audiences that aren’t already interested in what you want to talk about. Yes, school kids are often exposed to all kinds of topics in science communication events whether they are interested in them or not, just because their teacher decided they had to go there. But what about adults? There are a lot of people that would never knowingly attend an event that will deal with physics. Attracting them with something they are interested in — art, in this case — might be a great way to spark their interest in physics topics!

What’s the physics behind “liquid art”?

But where exactly is the physics that can be talked about? There are two main areas that jump at me: The physics of the water that is used to form the sculptures, and then the physics of capturing pictures and everything related to that.

Physics of water

As you might have guessed, my main interest lies in the physics of the water. How do you manipulate water to design exactly the kind of sculpture you want? This is not only about the exact size of drops, falling from the correct height, hitting a reservoir in the correct spot, at exactly the time you think it will, potentially additional drops with precisely calculated time lags…

In the following, I am going to give you three examples of the kind of physics I would talk about if I were to use “liquid art” in a science communication context. For all of these, there are so many nice hands-on experiments that could be offered to let people experience the effect of various parameters to show how and why it is important to consider them when creating drop sculptures. So exciting! :-)

Viscosity, or how to control the behaviour of drops

Firstly, viscosity. Having a handle on viscosity doesn’t only determine the size of the drops, but also the kind of behaviour that is displayed when the drop hits the reservoir — how deep will a drop sink, what kind of bubble will be formed, how high will the stem rise from the reservoir when surface tension drives it back up, all the good stuff.

Viscosity can be manipulated several ways: By manipulating the viscosity of water by adding starch or other substances, by using different fluids than water (which comes with additional problems, e.g. cleaning the apparatus afterwards), and by using different fluids and adding stuff to them. And then viscosity is also a function of temperature, so temperature of the whole lab (or studio) has to be controlled.

Hydrostatic pressure “plus”

The size of drops is also determined by another factor: By the hydrostatic pressure in the reservoir that feeds the drip (or valve) in combination with the opening time of said valve. There are very interesting ways to control the pressure in the reservoir that I could (and probably will ;-)) write several blog posts on!

And then it’s not only the hydrostatic pressure that is relevant: If several valves are used because water is coming from several reservoirs (for example because the water is dyed in different colors or because fluids of different viscosities are combined in one sculpture), adding pressure to a valve that is moved slightly out of the vertical lets you manipulate the parabolic trajectory the drop takes when falling, thus making it possible to drop on the spot exactly underneath a valve that just lets drops fall out vertically.

Waves, or symmetry of sculptures

And then, of course, you have to consider the vessel the water drops into. If that reservoir isn’t circular and the drop doesn’t hit it right in the middle, it is very difficult to create symmetric sculptures because the waves radiating from the point of impact (both on the surface and as pressure waves in the water) will, after being reflected by the rims of the reservoir, reach the mid point at different times, leading to an asymmetrical pressure field which will skew the whole sculpture.

Liquid art by Wlodek Brühl

Liquid art: Wlodek Brühl manipulating the apparatur he uses to create the amazing drop sculptures. Used with permission.

Physics of capturing images

And then, of course, there is all the physics of actually capturing the images. For example, Mr. Brühl mentions that the picture isn’t made by the camera, it’s made by the flash light. The way the pictures are taken that the camera’s exposure is actually fairly long, but the sharp definition is achieved because the flash only lights the sculpture for an extremely short time. And then there are things to consider like at what angle the flash lights the sculpture, how to achive the desired color effects, and many more. And of course writing the software that controlls all this!

More about this in a future post!

Using art in your science teaching and outreach. The why and the how.

This post was first published at the EGU’s blog’s “educational corner” GeoEd, in March 2016 (link here).

Sometimes we look for new ways to engage our students or the general public in discussions about our science. Today I would like to suggest we use art! Someone recently told me about her work on “STEAM”, which is STEM+Arts and apparently big on the rise. While I had never heard about it before, and initially found the idea a bit weird and artificial, there are certainly many occasions where thinking about topics in a more comprehensive way than just through disciplinary lenses could be of great benefit, both to get a fuller view of what is going on, as well as to maybe reach people in a different way, and therefore reach people that might not necessarily be interested in either of the parts by itself.

There are many different kinds of art that we can use in STEM teaching and outreach, ranging from art that uses science as its central theme to art that just happens to be displaying something we have a scientific interest in. And while in this blog post “art” is taken to mean visual art, you can think this much more widely and include music, theatre, anything you can think of! Dream big!

Art that incorporates scientific data

One example of art that uses science as a central theme and that is very well suited for our purposes is the amazing art of Jill Pelto, who communicates scientific research through art. What that means is that she takes graphs of recent dramatic changes in the climate system, like sea level rise or melting glaciers, and uses them in her art as part of the image. For example, a graph of the global average temperature is integrated on the boarder between a burning forest and the flames leaping into the smoky sky. Which you only notice when you look carefully, similarly to the boundary between the school of clown fish and the forest of anemones moving in the waves, showing the declining ocean pH which threatens this ecosystem (see figure below). Brian Kahn describes Jill Pelto’s paintings as “Trojan horse for science to reach a public that doesn’t necessarily think about data points and models”.

And that is a great approach to using this art. But how else could we use art like this in teaching and outreach?


Jill+Pelto+Clown+Fish+Web+(1)

“Clown Fish” by Jill Pelto. Used with permission. Click on the image to go to Jill Pelto’s gallery and discover more amazing artwork!

These kind of images I could imagine using in courses where students are to investigate a scientific topic in a project. Each group of students could be handed a different image, and they could be asked to figure out as much as possible about the topic and present it back to their peers. I would imagine that giving students a data set in such a visually appealing form would provoke an emotional connection and response much more easily than if they were presented with “just” the data. In the final exhibition, the art would work as great eye catchers to lure visitors into a topic.

I could also imagine using Jill Pelto’s art in a science outreach workshop. There, I would ask participating PhD students or scientists to take the one time series (or any other visual representation they have of their data that shows the most important part of their story) and, inspired by the art they saw, integrate their data into an eye-catching display that tells their story for them.

Wow, this really makes me want to do this for my own research!

Art that visualizes scientific results

The best-known example of art that tells scientific stories is Greg Johnson’s “Climate change science 2013: Haiku“. A poster of all 20 illustrations is up in my office (Thanks, Joke and Torge!) and I can tell you – it is a great conversation piece! The haikus and illustrations provide just enough information to spark curiosity, so I often find myself discussing climate change with my (non-climate scientist) colleagues. Clearly, the haikus would also work as excellent conversation starters in outreach!

full_01_cover_text-563x421

Picture from http://www.sightline.org/2013/12/16/the-entire-ipcc-report-in-19-illustrated-haiku/, used with permission

In teaching, I would use Greg Johnson’s illustrated haikus to break the IPCC report’s summary for policy makers down into its chapters, and hand out one illustration per group. Depending on what kind of students I was teaching, I would either ask them to read the corresponding summaries, or browse the chapter, or read one of the original articles cited in that chapter. Or even ask them to find articles that might shed a different light on the (obviously oversimplified) message of the haikus. What kind of evidence would they want to see to shoot down those messages or in support of it? Those kind of thoughts are a very good practice for their own research when they always need to consider whether the conclusions they draw are the only possible ones.

Here, again, the art helps to make very complex science easily approachable, and would again be awesome as eye catcher in an exhibition where student groups present their work to each other. (If you are worried about all the posters you are supposed to be printing, check out this post for a cheap and easy solution).

Or the haikus could be used as inspiration when you ask your students to read articles and summarize them in a haiku plus drawing. This would be great practice to get to the point, and also it would be great practice for outreach. How cool would it be if your students had a piece of art and a short poem summarizing their theses?

For more inspiration along those lines, check out Greg Johnson’s blog.

Art that incidentally shows science we are interested in

Alternatively to looking at art that doesn’t explicitly focuses on science as its topic, but which can still be used to discuss science.

One example is given in the TED talk “the unexpected math behind Van Gogh’s `Starry Night´” by Natalya St. Clair, where the painting is deconstructed and put in the context of the development of mathematical theories for turbulence. I have linked the video below and it is totally worth watching!

[youtube PMerSm2ToFY]

The video could serve as a great first exposure to turbulence in a physics class and would make for a very interesting assignment in a flipped setting. It could also be watched in art class to help underline that art is a “serious” subject and not just a bit of splashing with paint (or whatever prejudices your audience might have).

Or you could ask your students to attempt a similar interpretation of a different picture. For example when talking about different kinds of waves in your oceanography class, ask your students to browse a gallery of famous seaside paintings, online or “for real”, pick one painting and interpret the state of the sea, the shape of the clouds, the color of the light, to learn as much as possible about the weather conditions depicted in the painting. Always interesting, too: Check for consistency of wind direction from all the flags and sails and flying hair!

Alternatively, you could use a collection of pictures to talk about how knowledge in your field developed (for an example of how this could work for soil, see Laura Roberts-Artal’s blog post.

See – so many ways to include art in your science teaching and outreach to capture new audiences’ interest or just look at your topic from a different angle!

How would you use art in your teaching and outreach? Let us know in the comments below!

P.S.: This text originally appeared on my website as a page. Due to upcoming restructuring of this website, I am reposting it as a blog post. This is the original version last modified on February 16th, 2016.

I might write things differently if I was writing them now, but I still like to keep my blog as archive of my thoughts.

Learning about tides from art moored in a river

Disclaimer: This post might well be called “fun with tides” similar to Sheldon Cooper’s “fun with flags” — it is super nerdy, but at least I am having fun!

There is some really cool art around Hamburg, and the one I want to talk about today is called “four men on buoys” by Stephan Balkenhol: Four wooden statues of approximately live-sized men, standing on little floats, moored in four different spots all over Hamburg. One of them happens to be on the Elbe river, visible when you cross the bridge from where I work over to the city center. You ca see the scene below: The train going across the bridge, and the guy (in the white shirt) standing on the river.

IMG_5376

What you can sort of see in the picture above from the yellow buoy being tilted to the right: There is quite a strong current in that river. And what you can’t see in the picture, but will find out below: It’s a tidal current, hence its direction reverses regularly.

You can guess what that means for anything moored in the river: Yes, it will change its position following the tides!

This is where my nerdy self comes in. Whenever I take the train across that bridge, I try to snap a picture of the guy on the buoy. It is quite a difficult endeavour — the train usually goes pretty fast, and I never know where exactly the guy is going to be (well, I guess I could look at a tide table beforehand, but I’ve never done that) and taking pictures out of a train window is not that easy in itself. But sometimes it works out beautifully to show both the position of the guy and the currents:

3_32_nach_2016-05-09 10.47.55

The guy on the buoy 3 1/2 hours after high water that day

As you see in the image below, the wake is in the direction towards the viewer. This means that the water is flowing towards the viewer, i.e. downstream. You can see that the current is fairly strong because the wake is very pronounced (“very” at least relative to some other pictures you’ll see later).

For this post, I checked my phone and found a collection of 16 pictures of that guy. So clearly I had to see when they were taken relative to the time of high water that day. In the image below, each tick marks the time of one of my pictures relative to zero, the time of the nearest high water.

1_38_nach_2016-04-25 06.07.56 copy

The guy on the buoy, plus an eye-balled plot of my data points. 0==high water. This picture was taken 1 1/2 hours after high water that day.

As you can see, I seem to be on the train more when it’s close to high water than close to low water. Funny!

Now, when I show you all my 16 data points, let’s remember that we are now only looking at time before/after high water. We are neglecting important things like where exactly the picture was taken from (I’m excited to catch the guy on the buoy at all from a fast train!) or where we are in the spring / neap cycle. Plus the different times of day when the pictures were taken and the different weather conditions make comparison hard. Yet, it’s fun to see how the strength and even direction of the current (which you can see by looking at the wake and the position of the guy relative to the bridge) is changing!*

Before I show you the pictures, a CALL TO ACTION: If you happen to be on that train, snap a picture and send it to me! I’ll happily compile a better series with more data points! I’ll continue taking pictures, too, that’s for sure! :-) Imagine how you could use this kind of data in teaching! If I were to teach a class on tides at this university, I would have students collect this type of data and use it to say something about the tides on Elbe river. If there is enough data (which should be easy enough to get with many students commuting across this bridge every day), I am sure one could learn a lot from this case study! And working with data students collect themselves is always more fun than looking at some data set in a text book anyway. Plus how much more exciting would commuting get for those students once they start observing in this way, and starting to think about water, instead of just being bored on the train? There are actually a couple more times where you see the river quite well on the train journey between university and the city centre, so there might be many more case studies easily done if only people started looking for them…

And here are all 16 pictures, in the order going from low water to high water to low water. The caption includes the time before/after high water. Enjoy!

Guy on buoy. Picture taken 4h 50min before high water.

Guy on buoy. Picture taken 4h 50min before high water.

Guy on buoy. Picture taken 4h 02min before high water.

Guy on buoy. Picture taken 4h 02min before high water.

Guy on buoy. Picture taken 2h 34min before high water.

Guy on buoy. Picture taken 2h 34min before high water.

Guy on buoy. Picture taken 1h 14min before high water.

Guy on buoy. Picture taken 1h 14min before high water.

Guy on buoy. Picture taken 1h 06min before high water.

Guy on buoy. Picture taken 1h 06min before high water.

Guy on buoy. Picture taken 1h 02min before high water.

Guy on buoy. Picture taken 1h 02min before high water.

Guy on buoy. Picture taken 0h 27min before high water.

Guy on buoy. Picture taken 0h 27min before high water.

Guy on buoy. Picture taken 0h 26min before high water.

Guy on buoy. Picture taken 0h 26min before high water.

Guy on buoy. Picture taken 0h 25min before high water.

Guy on buoy. Picture taken 0h 25min before high water.

Guy on buoy. Picture taken 0h 12 min past high water.

Guy on buoy. Picture taken 0h 12 min past high water.

Guy on buoy. Picture taken 0h 48min past high water

Guy on buoy. Picture taken 0h 48min past high water

Guy on buoy. Picture taken 1h 17min past high water.

Guy on buoy. Picture taken 1h 17min past high water.

Guy on buoy. Picture taken 1h 38min past high water.

Guy on buoy. Picture taken 1h 38min past high water.

Guy on buoy. Picture taken 1h 48min past high water.

Guy on buoy. Picture taken 1h 48min past high water.

Guy on buoy. Picture taken 3h 32min past high water.

Guy on buoy. Picture taken 3h 32min past high water.

Guy on buoy. Picture taken 6h 05min past high water.

Guy on buoy. Picture taken 6h 05min past high water.

*Btw, sometimes you see that my mapping is clearly not right (for example, when the wake is in the direction away from the viewer, we cannot be past high water already, since the current is clearly still going up the river, so the tide hasn’t turned yet). These errors might be due to me not taking enough care when looking up the tidal data (yep.) or the tide tables that were used not accounting for factors that might have influenced the tides other than the classical tidal components, like for example wind conditions. I could, of course, go back and look at actual data and/or double-check, but I am happy with what I can see from the data already. If you are not, please knock yourself out and I’d be happy to host your guest post with corrections of my post! :-)