Category Archives: hands-on activity (easy)

Experiment: Ice cubes melting in fresh water and salt water

Explore how melting of ice cubes floating in water is influenced by the salinity of the water. Important oceanographic concepts like density and density driven currents are visualized and can be discussed on the basis of this experiment.

Context

Audience

This hands-on experiment is suited for many different audiences and can be used to achieve a wealth of different learning goals. Audience ranges from first-graders over undergraduates in physical oceanography to outreach activities with the general public. Depending on the audience, this activity can be embedded in very different contexts: For children, either in their physics teaching to motivate learning about concepts like density, or in the context of learning about the climate system and ocean circulation. For college/university students the activity can either be used in physics teaching to get a different view on density; in oceanography/Earth science to talk about ocean circulation and processes that are important there; to motivate the scientific process; or to practice writing lab reports (you can be sure that students will at some point be tasting the water to make sure they didn’t accidentally swap the salt water and fresh water cup – a great teachable moment for a) Never putting anything in your mouth in a laboratory setting, and b) Always documenting exactly what you are doing because stuff that you think you will definitely remember obviously isn’t remembered that clearly after all). For the general public, this is typically a stand-alone activity.

Skills and concepts that students must have mastered

It helps if the concept of density is known, but the experiment can also be used to introduce or deepen the understanding of the concept.

How the activity is situated in the course

I use this activity in different ways: a) as a simple in-class experiment that we use to discuss the scientific method, as well as what needs to be noted in lab journals and what makes a good lab report, or density-driven circulation; b) to engage non-majors or the general public in thinking about ocean circulation, what drives ocean currents, … in one-off presentations.


Goals

Content/concepts goals for this activity

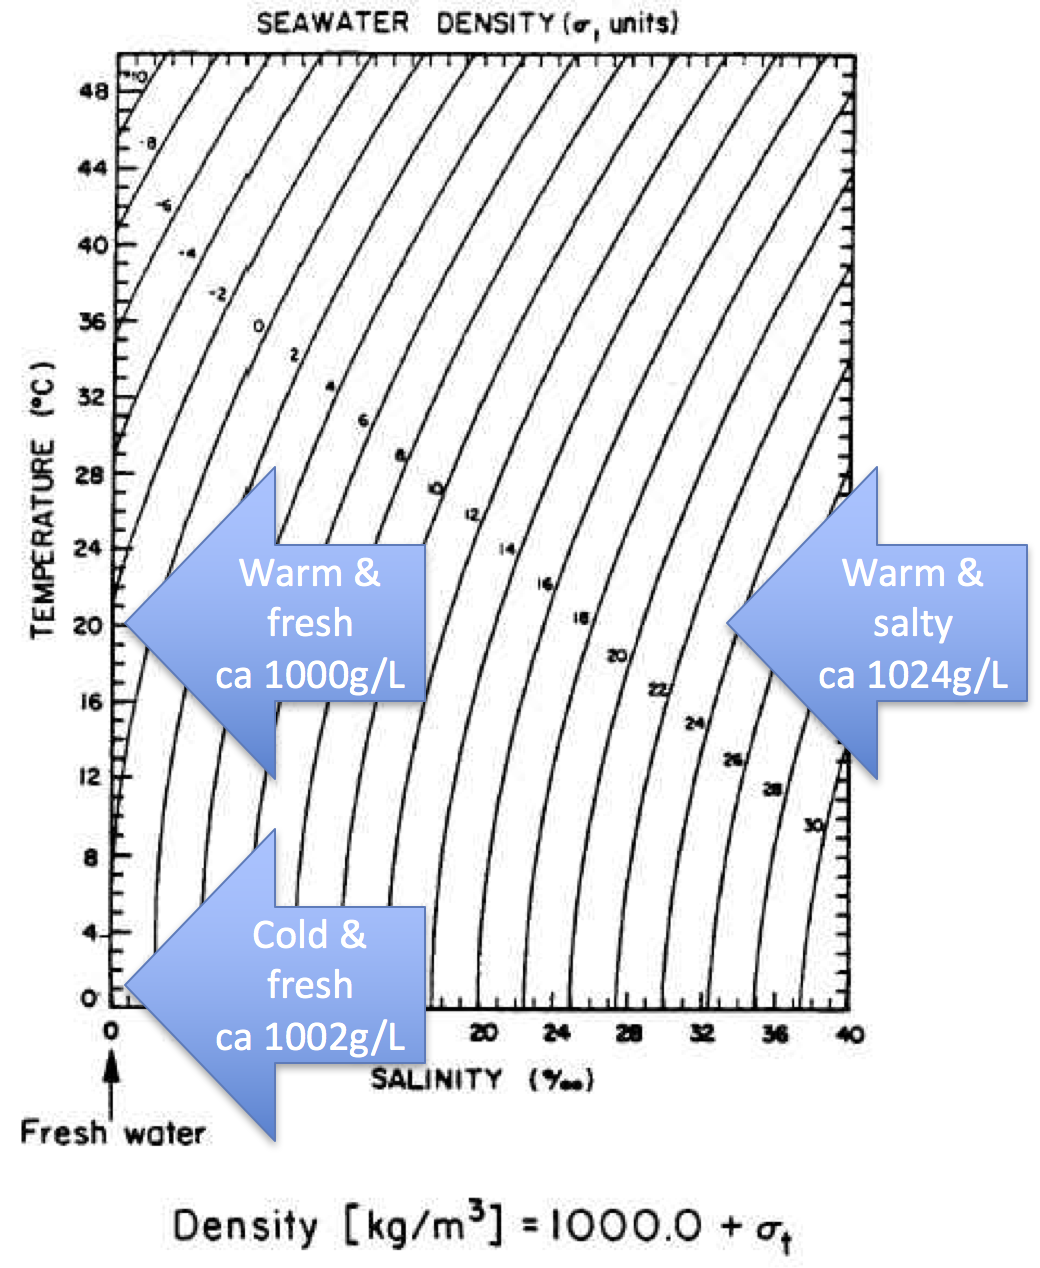
Students learn about concepts that are important not only in physical oceanography, but in any physical or Earth science: density in general; density of water in particular, depending on the water’s temperature and salinity; how differences in density can drive currents both in the model and in the world ocean; how different processes acting at the same time can lead to unexpected results; how to model large scale processes in a simple experiment. After finishing the activity, they can formulate testable hypotheses, are able to reason based on density how a flow field will develop and they can compare the situations in the cups to the “real” ocean.

Higher order thinking skills goals for this activity

Students learn about and practice the use of the scientific method: formulation of hypotheses, testing, evaluating and reformulating.

Other skills goals for this activity

Students practice writing lab reports, making observations, working in groups.


Description and Teaching Materials

Materials

(per group of 2-4 students):

  • 1 clear plastic cup filled with room-temperature salt water (35psu or higher, i.e. 7 or more tea spoons of table salt per liter water), marked as salt water (optional)
  • 1 clear plastic cup filled with room-temperature fresh water, marked as fresh water (optional)
  • 2 ice cubes
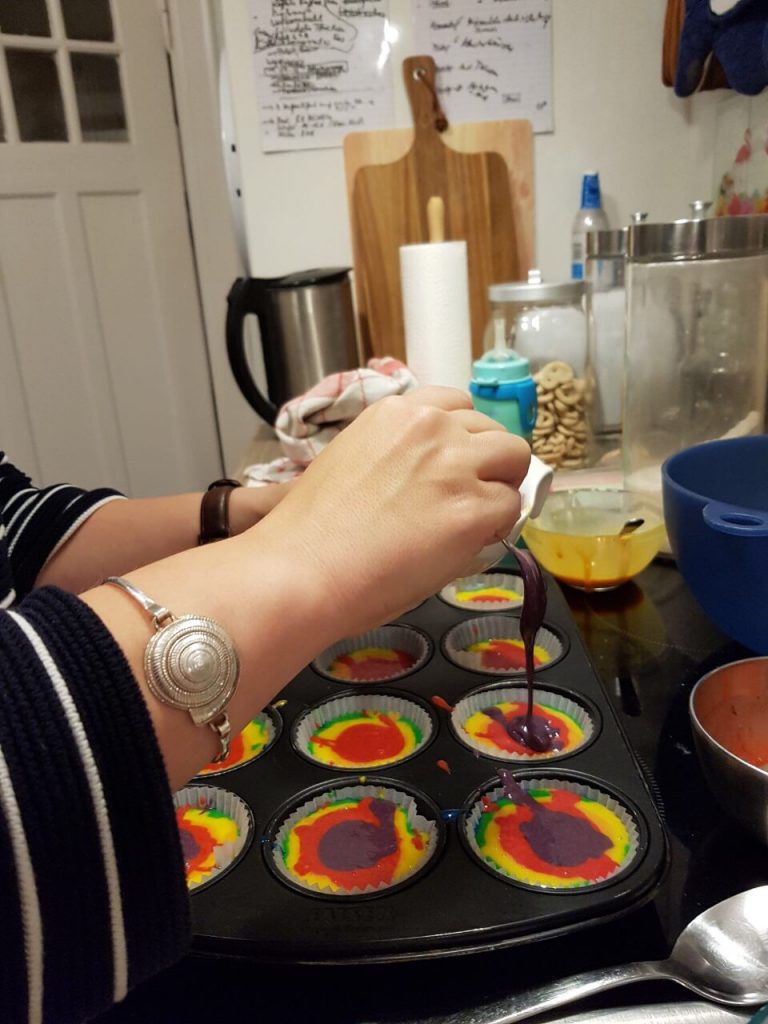
  • liquid food dye either in drop bottle, with a pipette or with a straw as plunging syphon

Description

Before the experiment is started, students are asked to make a prediction which ice cube will melt faster, the one in salt water or the one in fresh water. Students discuss within their groups and commit to one hypothesis.
Students then place the ice cubes into the cups and start a stop watch/note the time. Students observe one of the ice cube melting faster than the other one. When it becomes obvious that one is indeed melting faster, a drop of food dye can be added on each of the ice cubes to color the melt water. Students take the time until each of the ice cubes has melted completely.

Discussion

The ice cube in the cup containing the fresh water will melt faster, because the (fresh) melt water is colder than the room-temperature fresh water in the cup. Hence its density is higher and it sinks to the bottom of the cup, being replaced by warmer waters at the ice cube. In contrast, the cold and fresh melt water in the salt water cup is less dense than the salt water, hence it forms a layer on top of the salt water and doesn’t induce a circulation like the one in the fresh water cup. The circulation is clearly visible as soon as the food dye is added: While in the freshwater case the whole water column changes color, only a thin meltwater layer on top of the salt water is colored (for clarification, see images in the presentation below)


Teaching Notes and Tips

Students usually assume that the ice cube in salt water will melt faster than the one in fresh water, “because salt is used to de-ice streets in winter”. Have students explicitly state their hypothesis (“the one in salt water will melt faster!”), so when they measure the time it takes the ice cubes to melt, they realize that their experiment does not support their hypothesis and start discussing why that is the case. (Elicit the misconception, so it can be confronted and resolved!)

My experience with this experiment is that all groups behave very consistently:

  • At least 80% of your audience will be very sure that the ice cube in salt water will melt faster than the one in fresh water. The other 20% will give the correct hypothesis, but only because they expect a trick question, and they will most likely not be able to come up with an explanation.
  • You can be 100% sure that at least in one group, someone will say “oh wait, which was the salt water again?” which hands you on a plate the opportunity to say “see — this is a great experiment to use when talking about why we need to write good documentations already while we are doing the experiment!”
  • You can also be 100% sure that in that group, someone will taste the water to make sure they know which cup contains the salt water. Which lets you say your “see — perfect experiment to talk about lab safety stuff! Never ever put things in your mouth in a lab!”
  • You can also be sure, that people come up with new experiments they want to try.
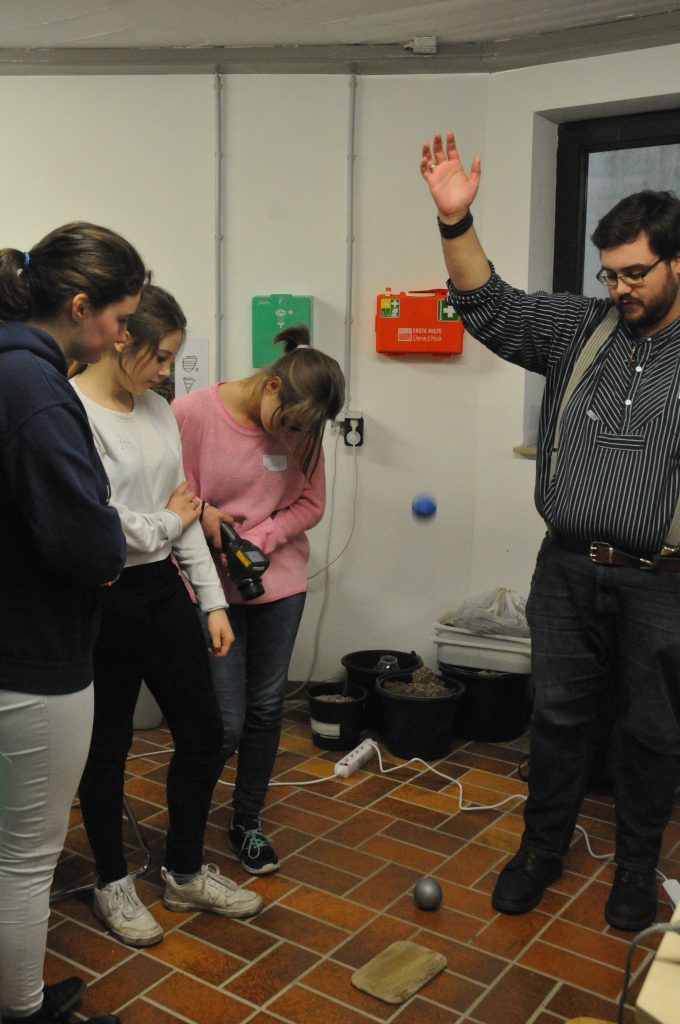
    • At EMSEA14, people asked what would happen if the ice cubes were held at the bottom of the beaker.
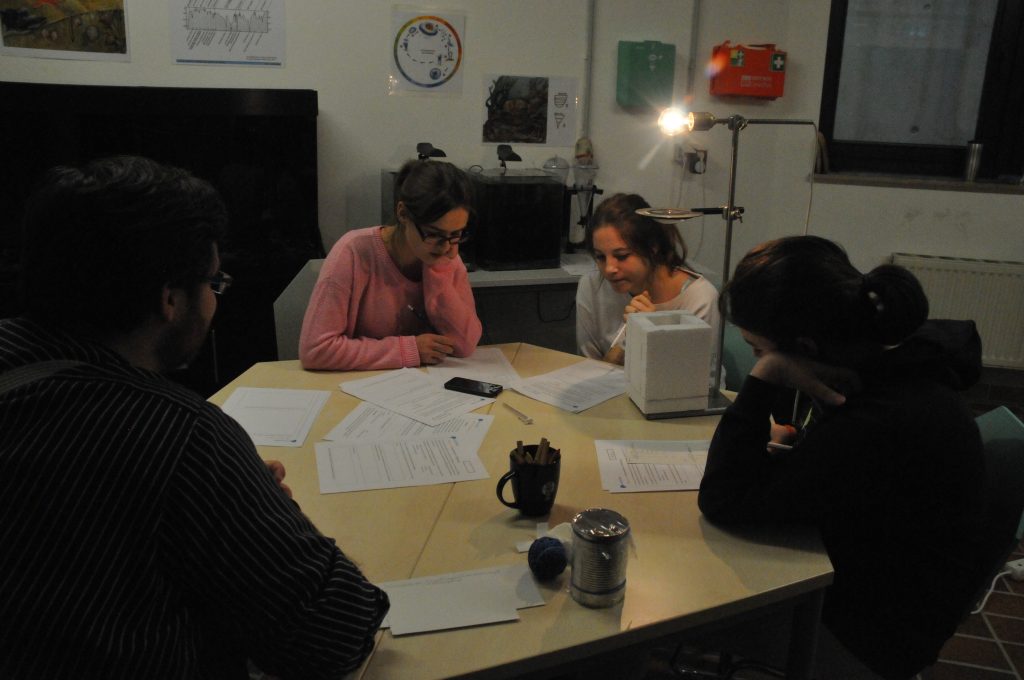
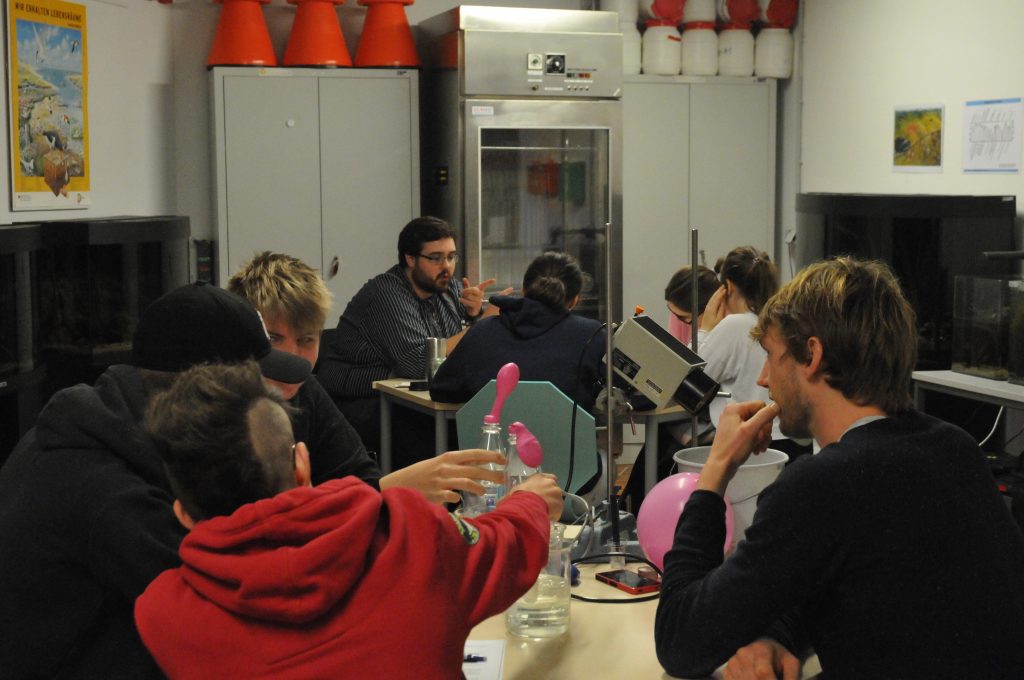
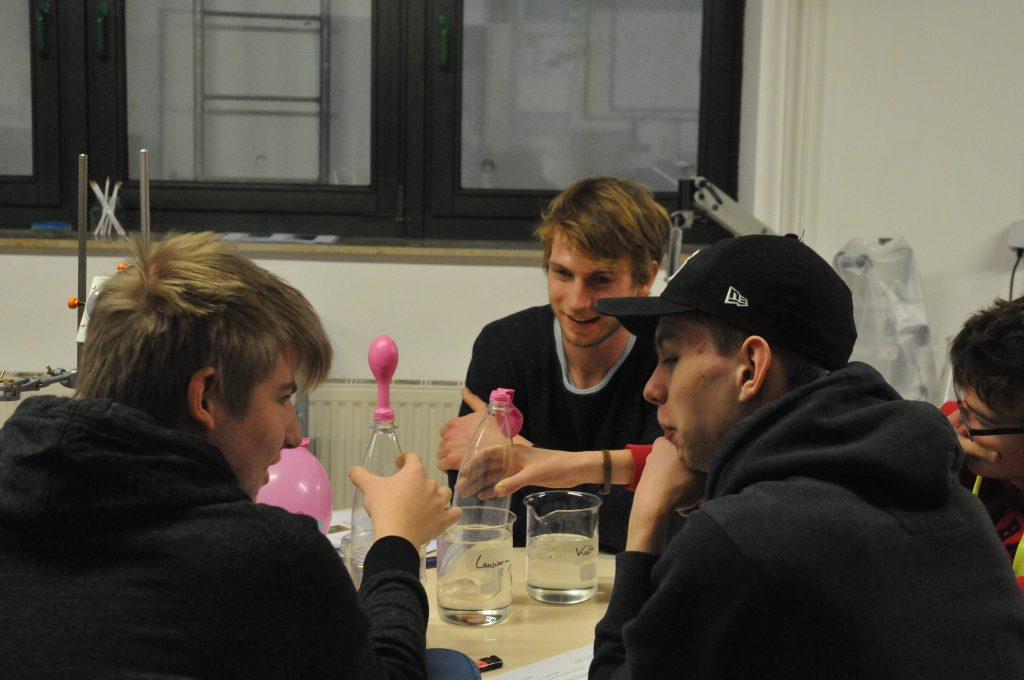
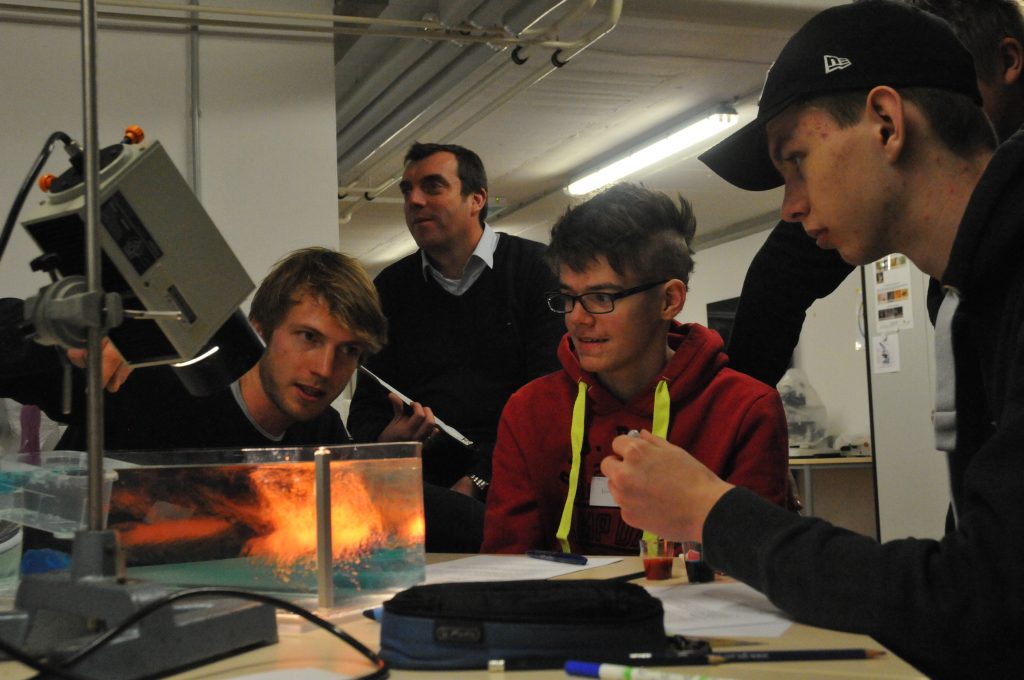
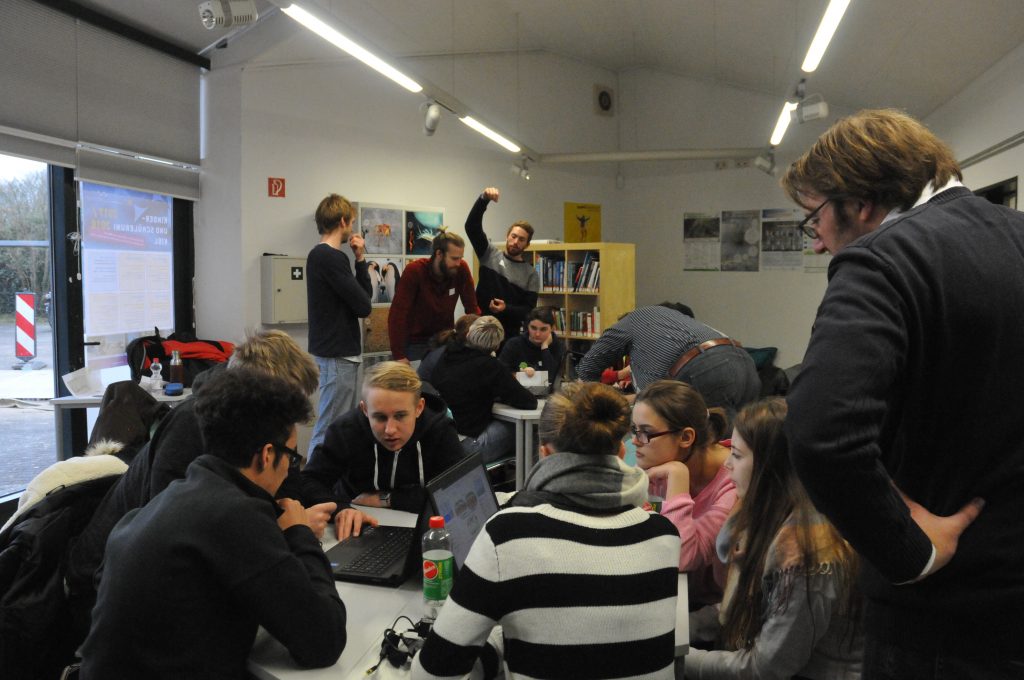
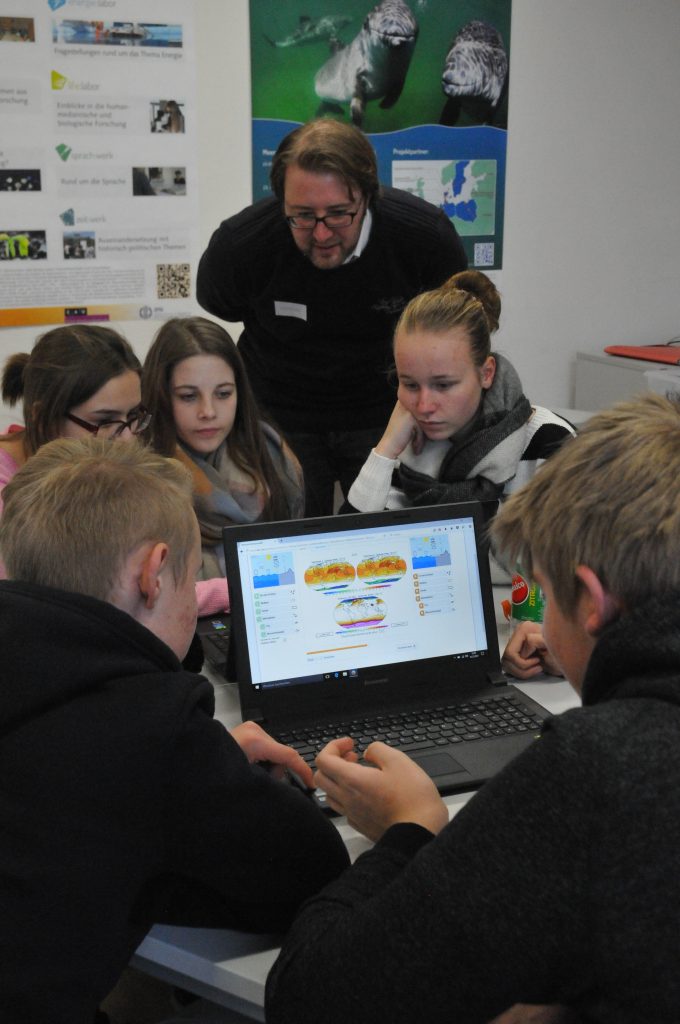
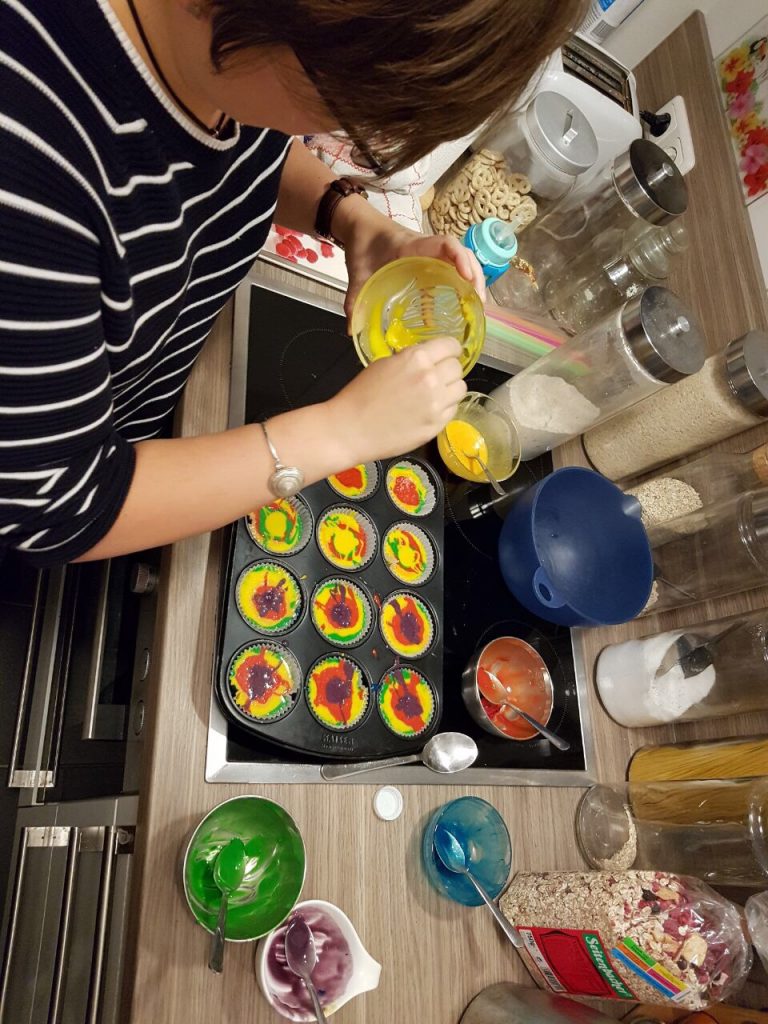
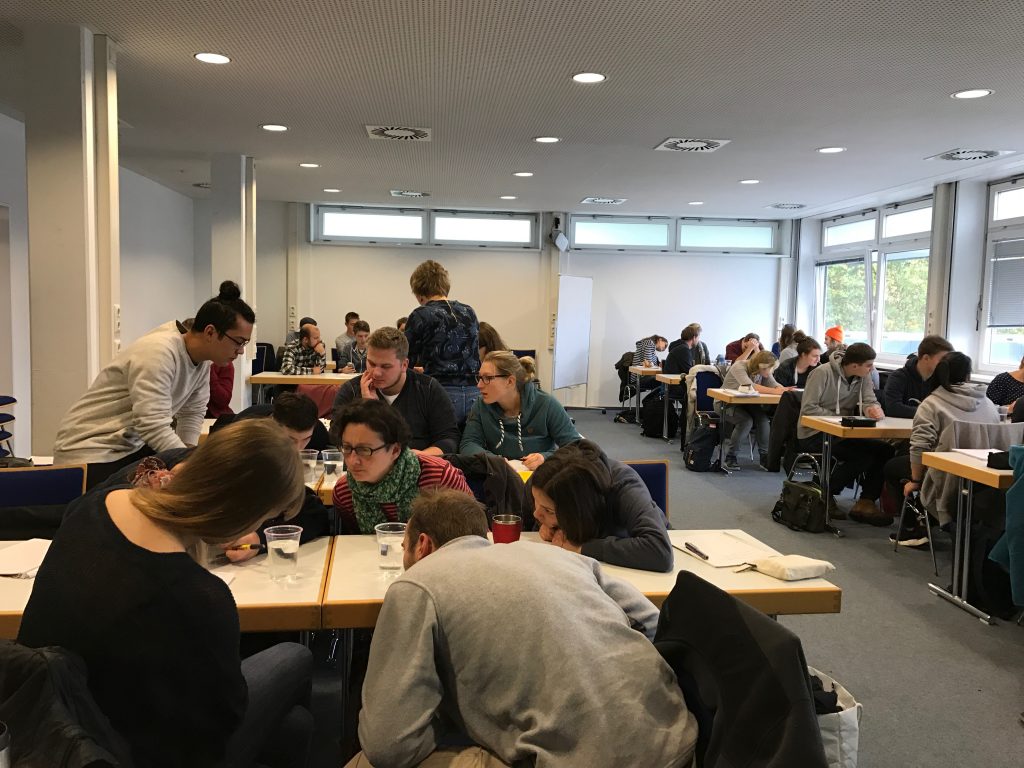
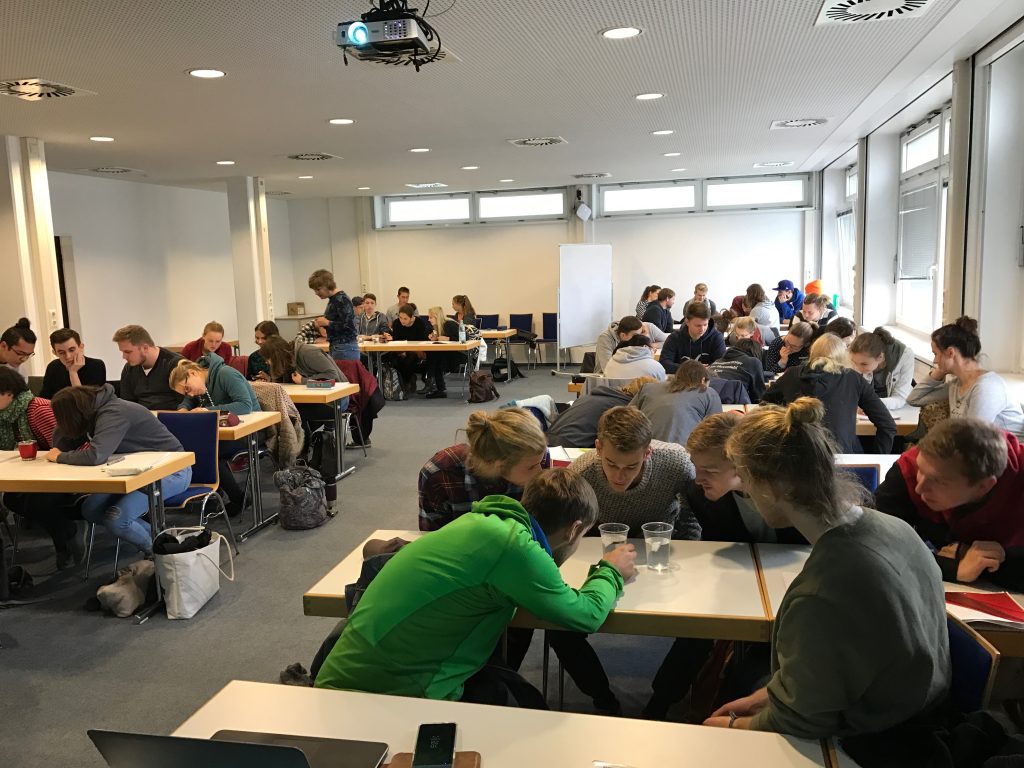
    • At a workshop on inquiry-based learning, people asked what the dye would do if there was no ice in the cups, just salt water and fresh water. Perfect opportunity to say “try! Then you’ll know! And btw — isn’t this experiment perfect to inspire the spirit of research (or however you would say that in English – “Forschergeist” is what I mean!). This is what you see in the pictures in this blogpost.

It is always a good idea to have plenty of spare ice cubes and salt/fresh water at room temperature ready so people can run the experiment again if they decide to either focus on something they didn’t observe well enough the first time round, or try a modified experiment like the ones described above.

A reviewer of this activity asked how easily students overcome the idea that water in the cup has to have just one temperature. In my experience this is not an issue at all – students keep “pointing” and thereby touching the cups, and in the thin-walled plastic cups I typically use the temperature gradient between “cold” melt water and “warm” salt water is easily felt. The (careful!) touching of the cups can also be explicitly encouraged.

Different ways to use this experiment

This experiment can be used in many different ways depending on the audience you are working with.

  • Demonstration: If you want to show this experiment rather than having students conduct it themselves, using colored ice cubes is the way to go (see experiment here). The dye focuses the observer’s attention on the melt water and makes it much easier to observe the experiment from a distance, on a screen or via a projector. Dying the ice cubes makes understanding much easier, but it also diminishes the feeling of exploration a lot – there is no mystery involved any more. And remember in order for demonstrations to increase the learning outcome, they need to be embedded in a larger didactical setting, including forming of hypotheses before the experiment is run and debriefing afterwards.
  • Structured activity: For an audience with little knowledge about physics, you might want to start with a very structured activity, much like the one described above. Students are handed (non-colored) ice cubes, cups with salt water and fresh water and are asked to make a prediction about which of the ice cubes is going to melt faster. Students test their hypothesis, find the results of the experiment in support with it or not, and we discuss. This is how I usually use this experiment in class (see discussion here).The advantage of using this approach is that students have clear instructions that they can easily follow. Depending on how observant the group is, instructions can be very detailed (“Start the stop watch when you put the ice cubes in the water. Write down the time when the first ice cube has melted completely, and which of the ice cubes it was. Write down the time when the second ice cube has melted completely. …”) or more open (“observe the ice cubes melting”).
  • Problem-solving activity: Depending on your goals with this experiment, you could also consider making it a problem-solving activity: You would hand out the materials and ask the students to design an experiment to figure out which of the cups contains fresh water and which salt water (no tasting, of course!). This is a very nice exercise and students learn a lot from designing the experiment themselves.
  • Open-ended investigation: In this case, students are handed the materials, knowing which cup contains fresh and salt water. But instead of being asked a specific question, they are told to use the materials to learn as much as they can about salt water, fresh water, temperature and density.As with the problem-solving exercise, this is a very time-intensive undertaking that does not seem feasible in the framework we are operating in. Also it is hard to predict what kind of experiments the students will come up with, and if they will learn what you want them to learn. On the other hand, students typically learn much more because they are free to explore and not bound by a specific instruction from you, so maybe give it a try?
  • Problem-based learning: This experiment is also very well suited in a Problem-Based Learning setting, both to work on the experiment itself or, as we did, to have instructors experience how problem-based learning works so they can use it in their own teaching later. Find a suggested case and a description of our experiences with it here.
  • Inquiry-based learning: Similarly as with Problem-Based Learning, this experiment can be used to let future instructors experience the method of inquiry-based learning from a student perspective. For my audience, people teaching in STEM, this is a nice case since it is close enough to their topics so they can easily make the transfer from this case to their own teaching, yet obscure enough that they really are learners in the situation.

Pro tip: If you are not quite sure how well your students will be able to cope with this experiment, prepare ice cubes dyed with food coloring and use them in a demonstration if students need more help seeing what is going on, or even let students work with colored ice cubes right from the start. If ice cubes and hence melt water are dyed right away, it becomes a lot easier to observe and deduct what is happening. Feel free to bring the photos or time lapse movie below as a backup, too!

dyed_ice_cubes_01

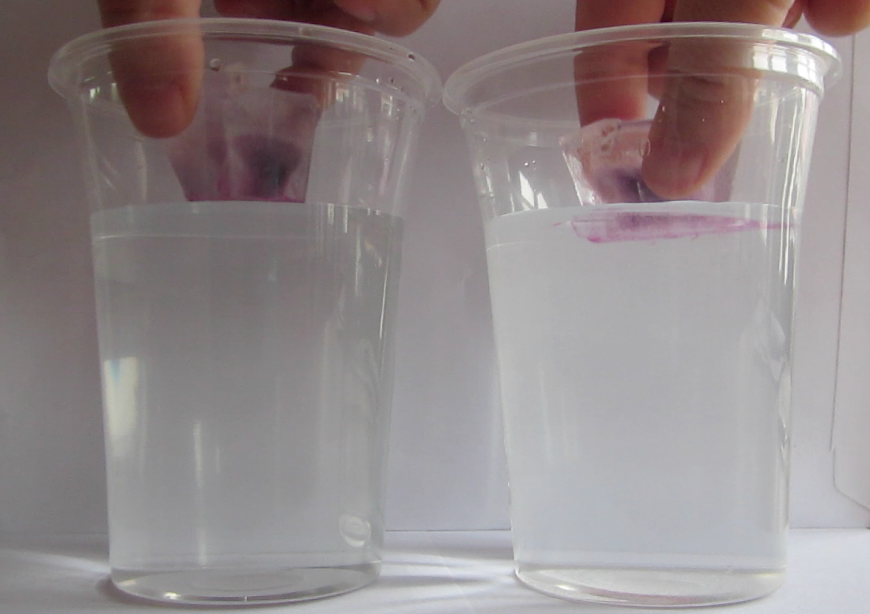
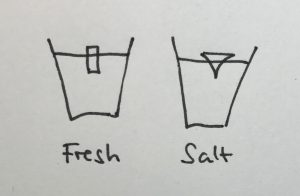
Dyed ice cubes about to be put into fresh water (left) and salt water (right)

dyed_ice_cubes_02

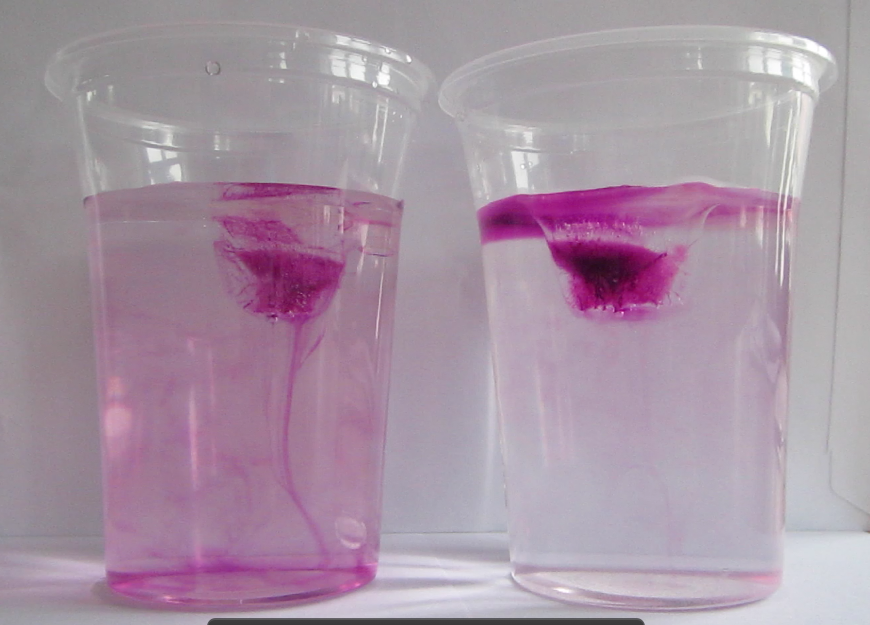
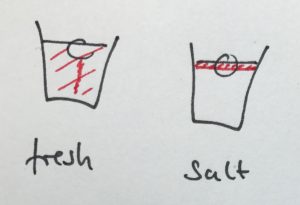
When the ice cubes start melting, it becomes very clear that they do so in different manners. In the left cup, the cold meltwater from the ice cube is denser than the lukewarm water in the cup. Hence it sinks to the bottom of the beaker and the water surrounding the ice cube is replaced by warmer water. On the right side, the lukewarm salt water is denser than the cold melt water, hence the cold meltwater floats on top, surrounding the ice cube which therefore melts more slowly than the one in the other cup.

dyed_ice_cubes_03

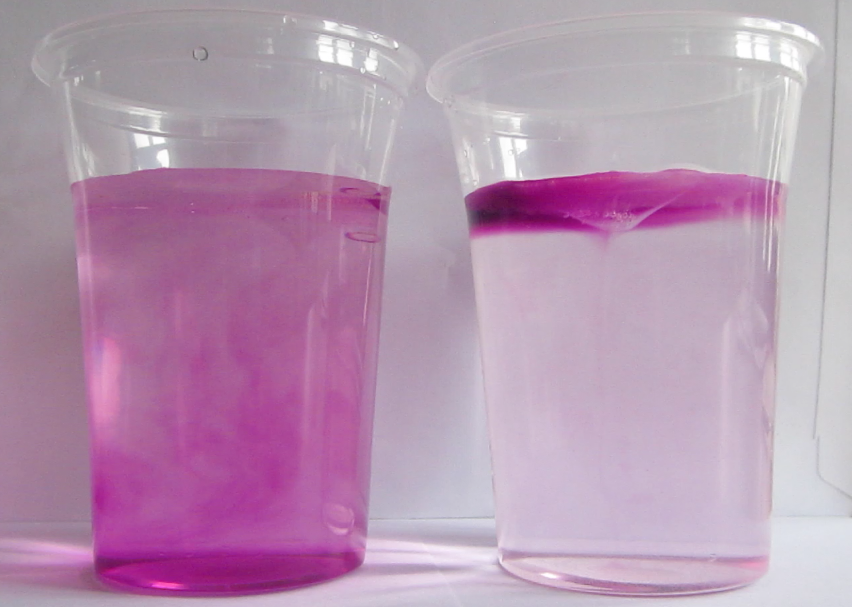
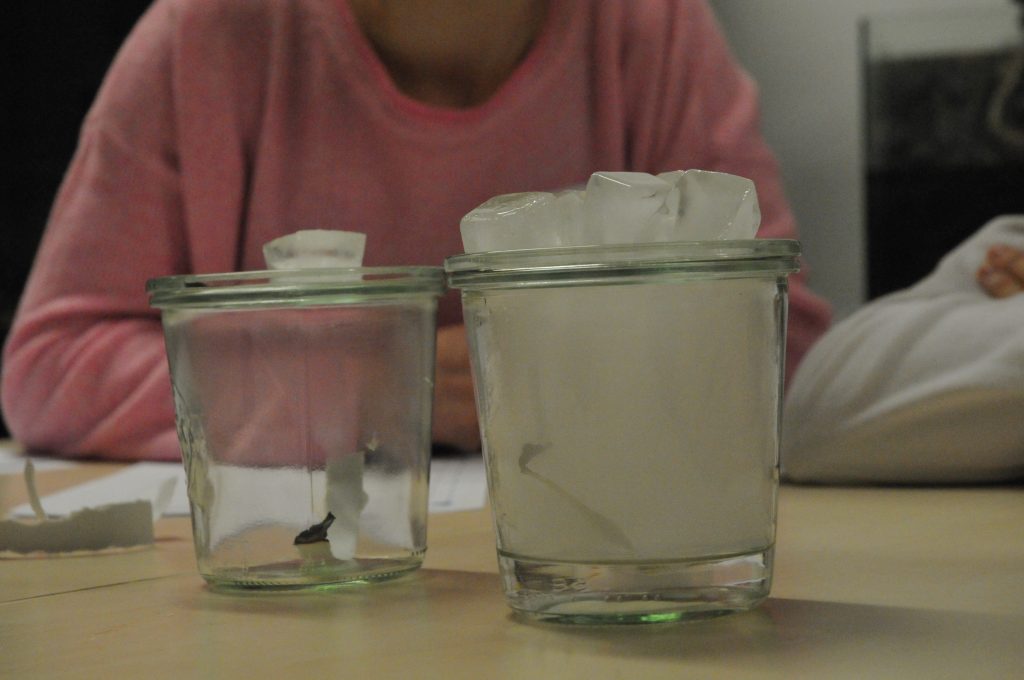
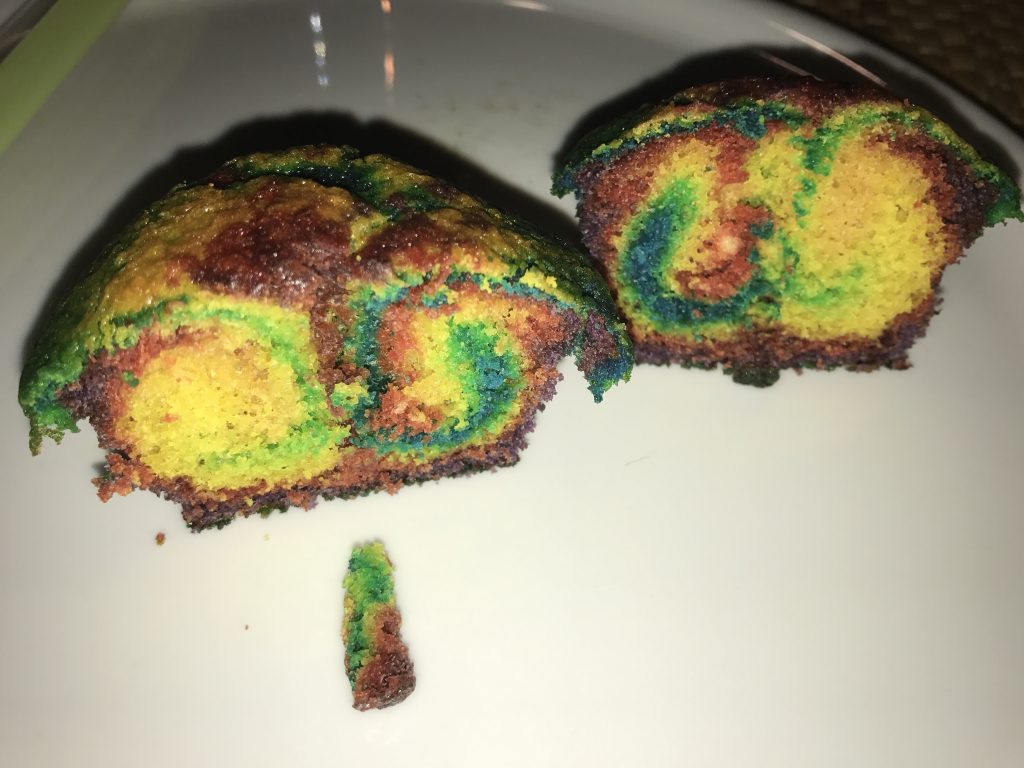
The ice cube in the fresh water cup (left) is almost completely gone and the water column is fairly mixed with melt water having sunk to the bottom of the beaker. The ice cube in the salt water cup (right) is still a lot bigger and a clear stratification is visible with the dyed meltwater on top of the salt water.

And here a time-lapse movie of the experiment.

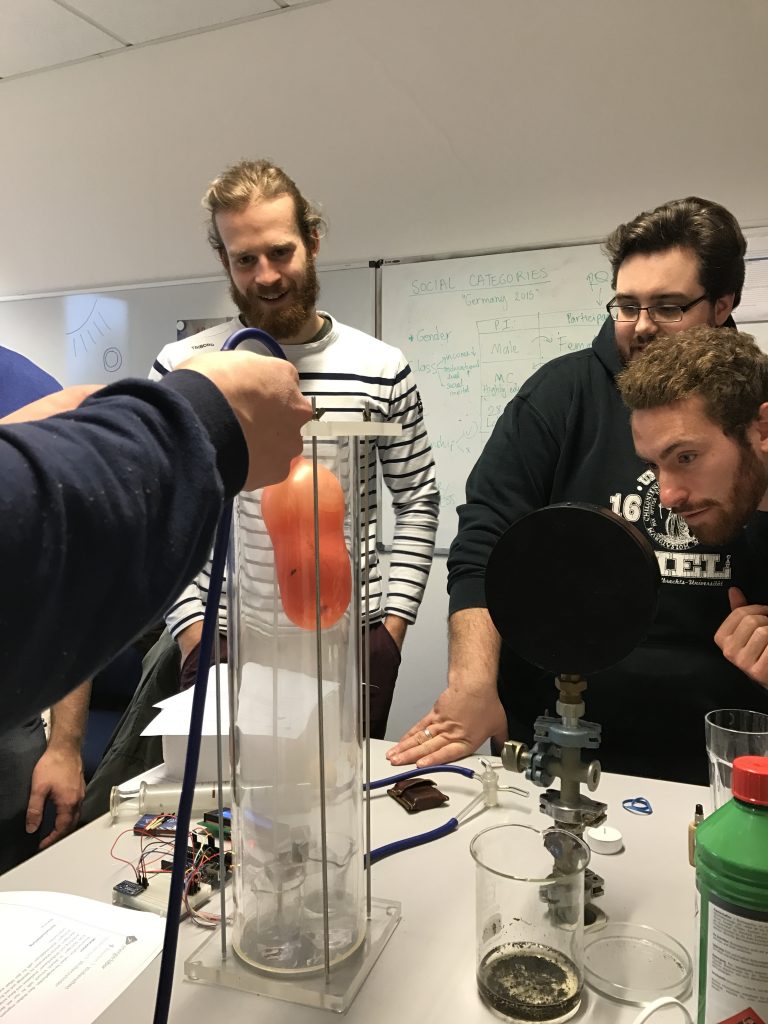
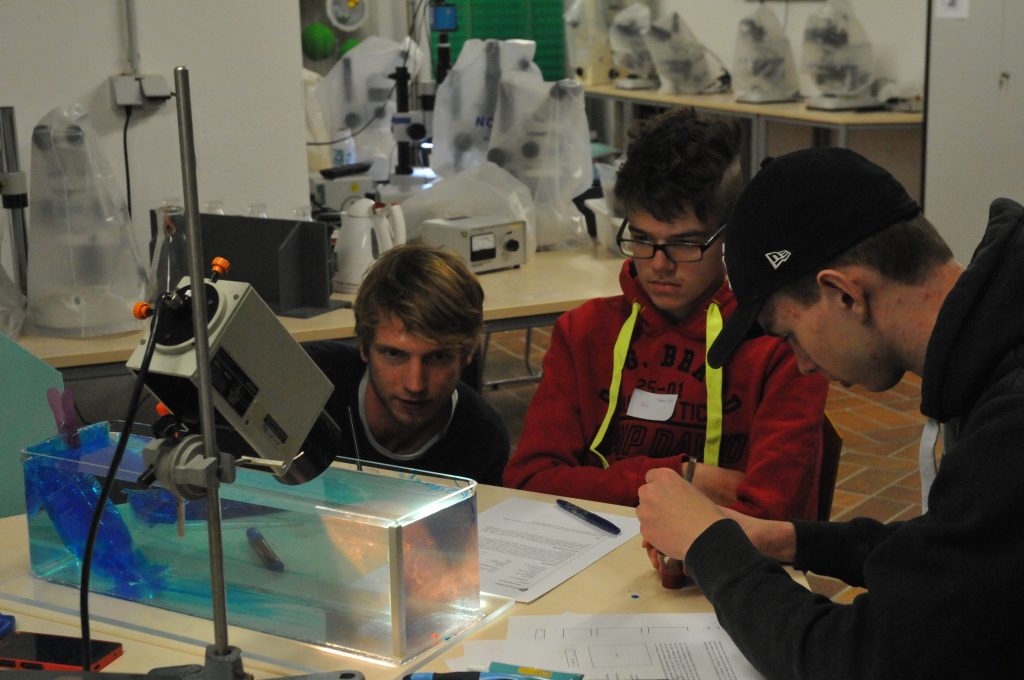
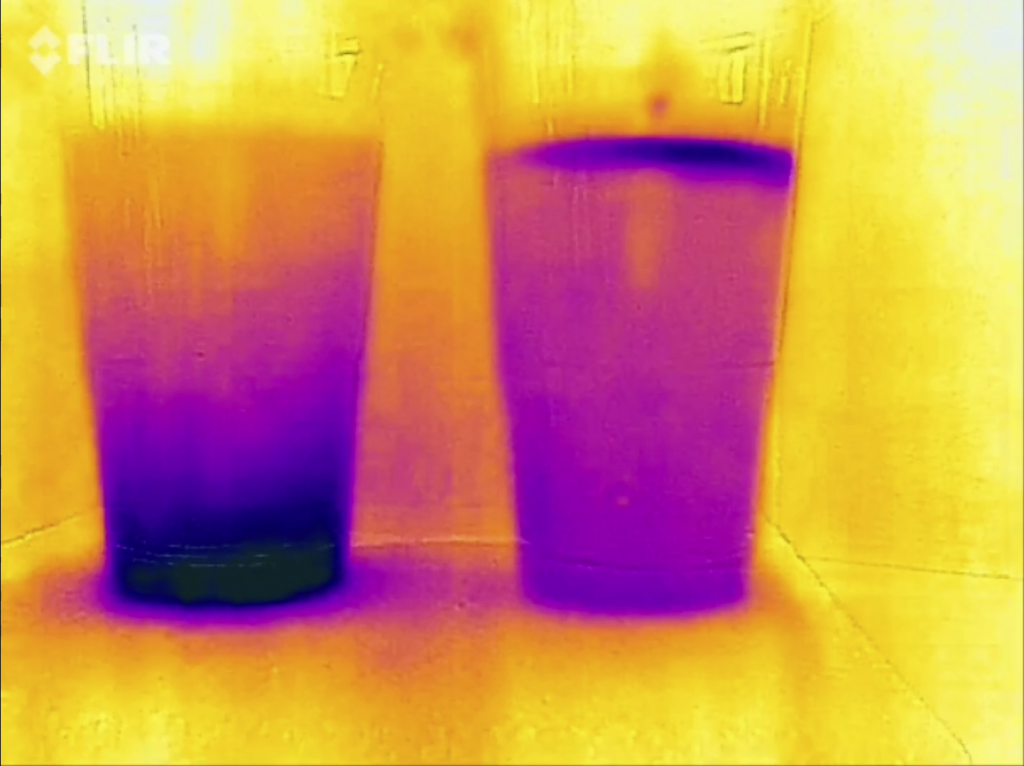
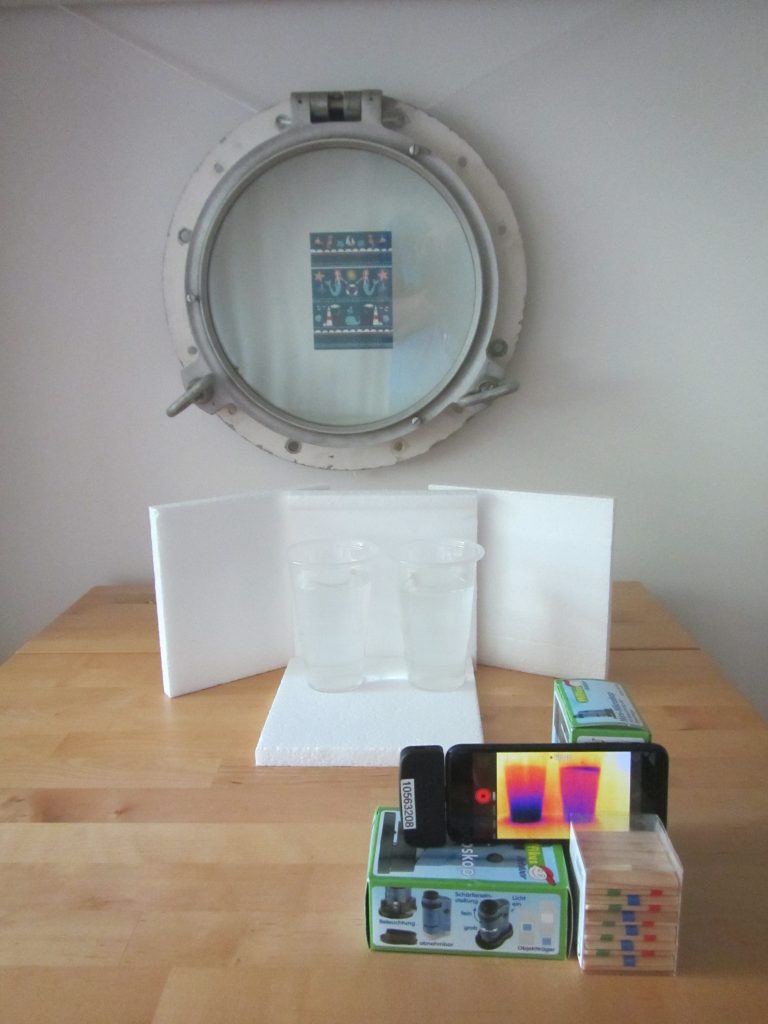
Another way to look at the experiment: With a thermal imaging camera!

screen-shot-2017-06-11-at-17-12-29

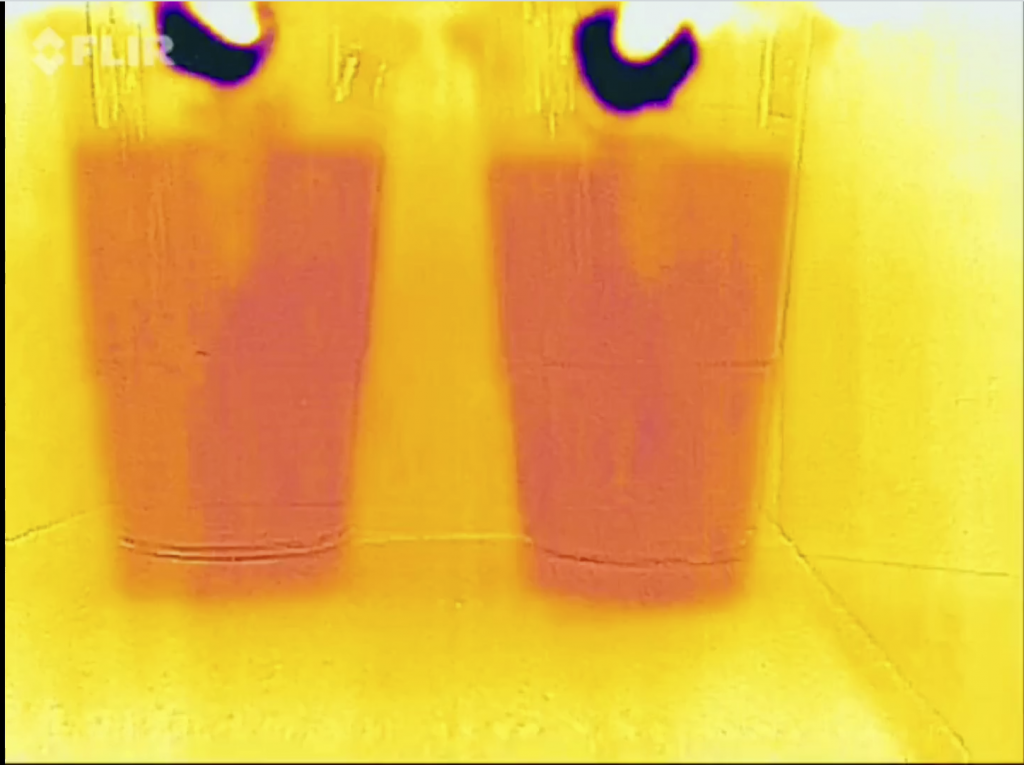
Cold (dark purple) ice cubes held by warm (white-ish) fingers over room-temperature (orange) cups with water

screen-shot-2017-06-11-at-17-12-55

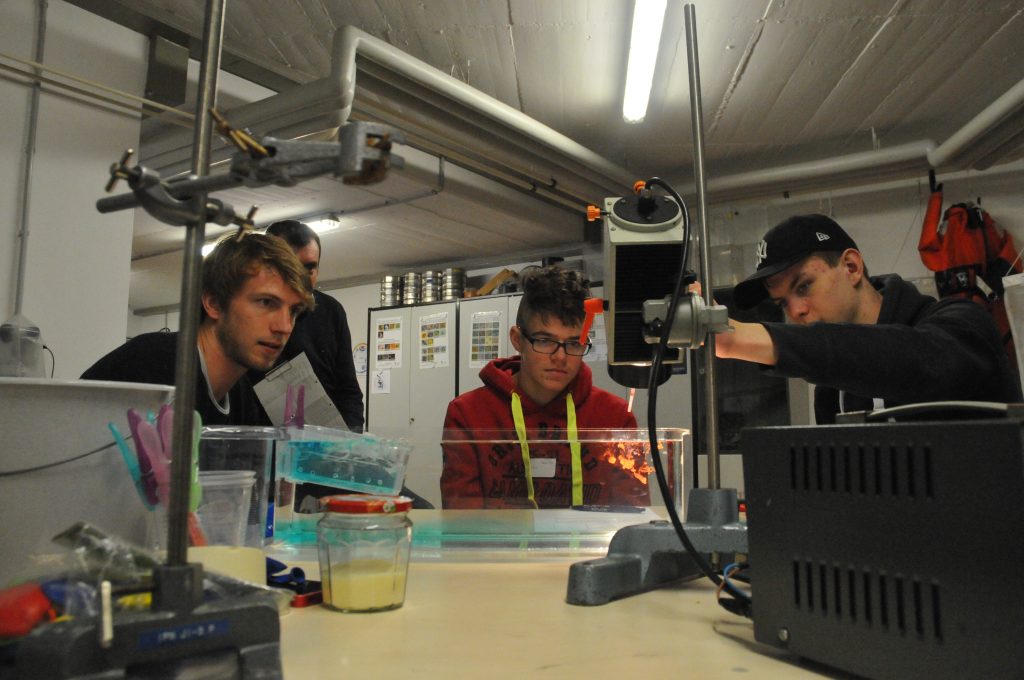
After a while, both cups show very different temperature distributions. The left one is still room temperature(-ish) on top and very cold at the bottom. The other one is very cold on top and warmer below.

screen-shot-2017-06-11-at-17-13-20

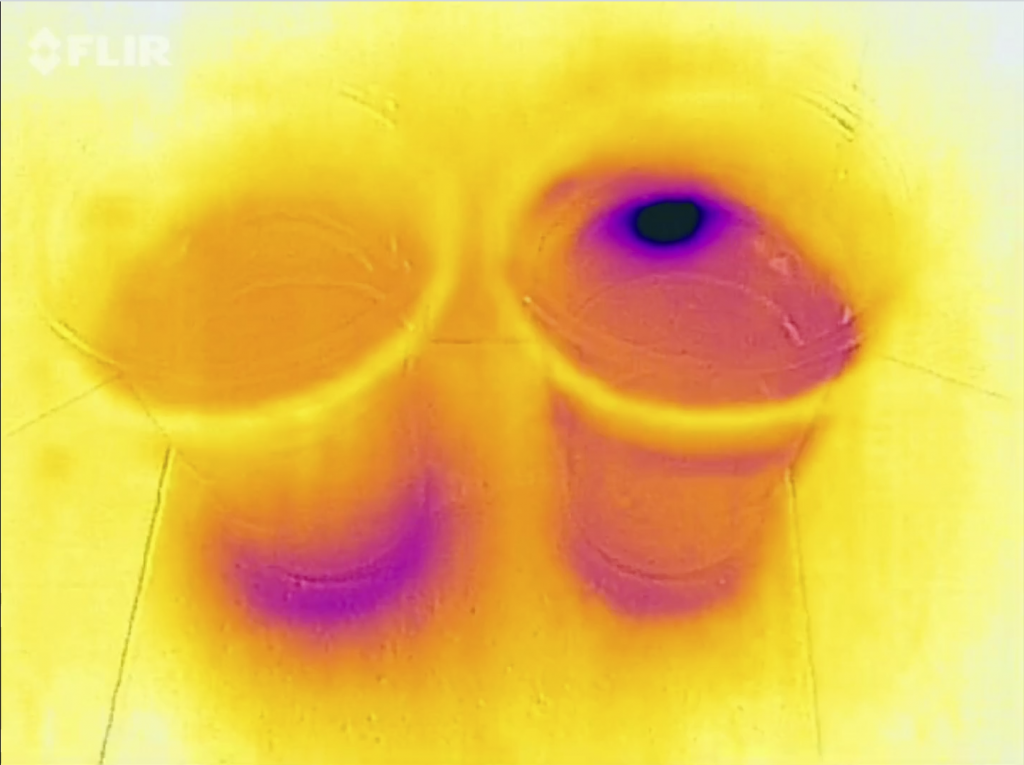
When you look in from the top, you see that in the left cup the ice has completely melted (and the melt water sunk to the bottom), whereas in the right cup there is still ice floating on top.

Assessment

Depending on the audience I use this experiment with, the learning goals are very different. Therefore, no one assessment strategy can be used for all different applications. Below, I am giving examples of what are possible ways to assess specific learning goals:

– Students apply the scientific process correctly: Look at how hypotheses are stated (“salt melts ice” is not a testable hypothesis, “similar-sized ice cubes will melt faster in salt water than in fresh water of the same temperature” is).

– Students are able to determine what kind of density-driven circulation will develop: Suggest modifications to the experiment (e.g. ice cubes are made from salt water, or ice cubes are held at the bottom of the cups while melting) and ask students to predict what the developing circulation will look like.

– Students can make the transfer from the flow field in the cup to the general ocean circulation: Let students compare the situation in the cup with different oceanic regions (the high Arctic, the Nordic Seas, …) and argue for which of those regions displays a similar circulation or what the differences are (in terms of salinity, temperature, and their influence on density).

In general, while students run the experiment, I walk around and listen to discussions or ask questions if students aren’t already discussing. Talking to students it becomes clear very quickly whether they understand the concept or not. Asking them to draw “what is happening in the cup” is a very useful indicator of how much they understand what is going on. If they draw something close to what is shown on slide 28 of the attached slide show, they have grasped the main points.


Equipment

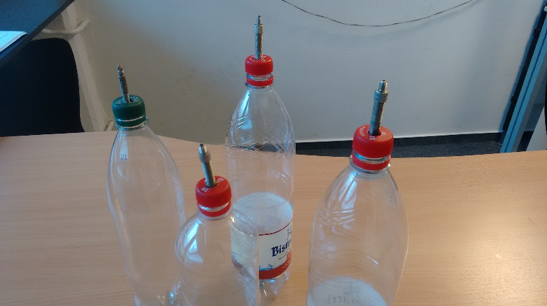
Don’t worry, it is totally feasible to bring all the equipment you need with you to run the experiment anywhere you want. This is what we brought to EMSEA14 to run the workshop three times with 40 participants each:

EMSEA14_list

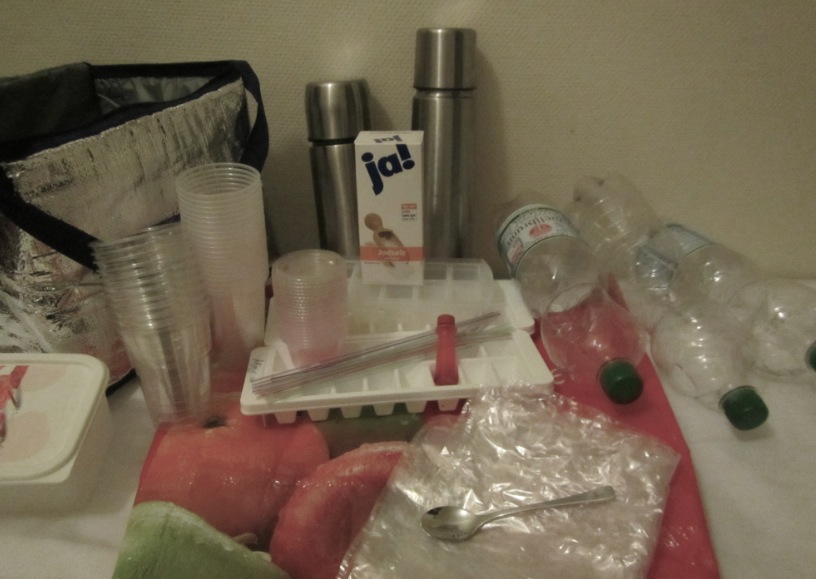
What we brought to EMSEA14 to run workshops on the ice cubes melting in fresh and salt water experiment

In one big grocery bag:

  • 4 ice cube trays
  • 4 ice cube bags (backup)
  • 2 thermos flasks (to store ice cubes)
  • 1 insulating carrier bag (left)
  • 4 empty 1.5l water bottles to mix & store salt water in
  • 1 tea spoon for measuring salt
  • 500g table salt
  • 21 clear plastic cups for experiments
  • 10 clear plastic cups to hand out ice cubes in
  • 11 straws (as pipettes)
  • 1 flask of food dye
  • 11 little cups with lids to hand out food dye in
  • nerves of steel (not shown :-))

And if you are my friend, you might also get the “ice cube special” — a pink bucket with all you will ever need to run the experiment! Below is what the ice cube experiment kit looks like that I made for Marisa, with labels and everything…

IMG_4202

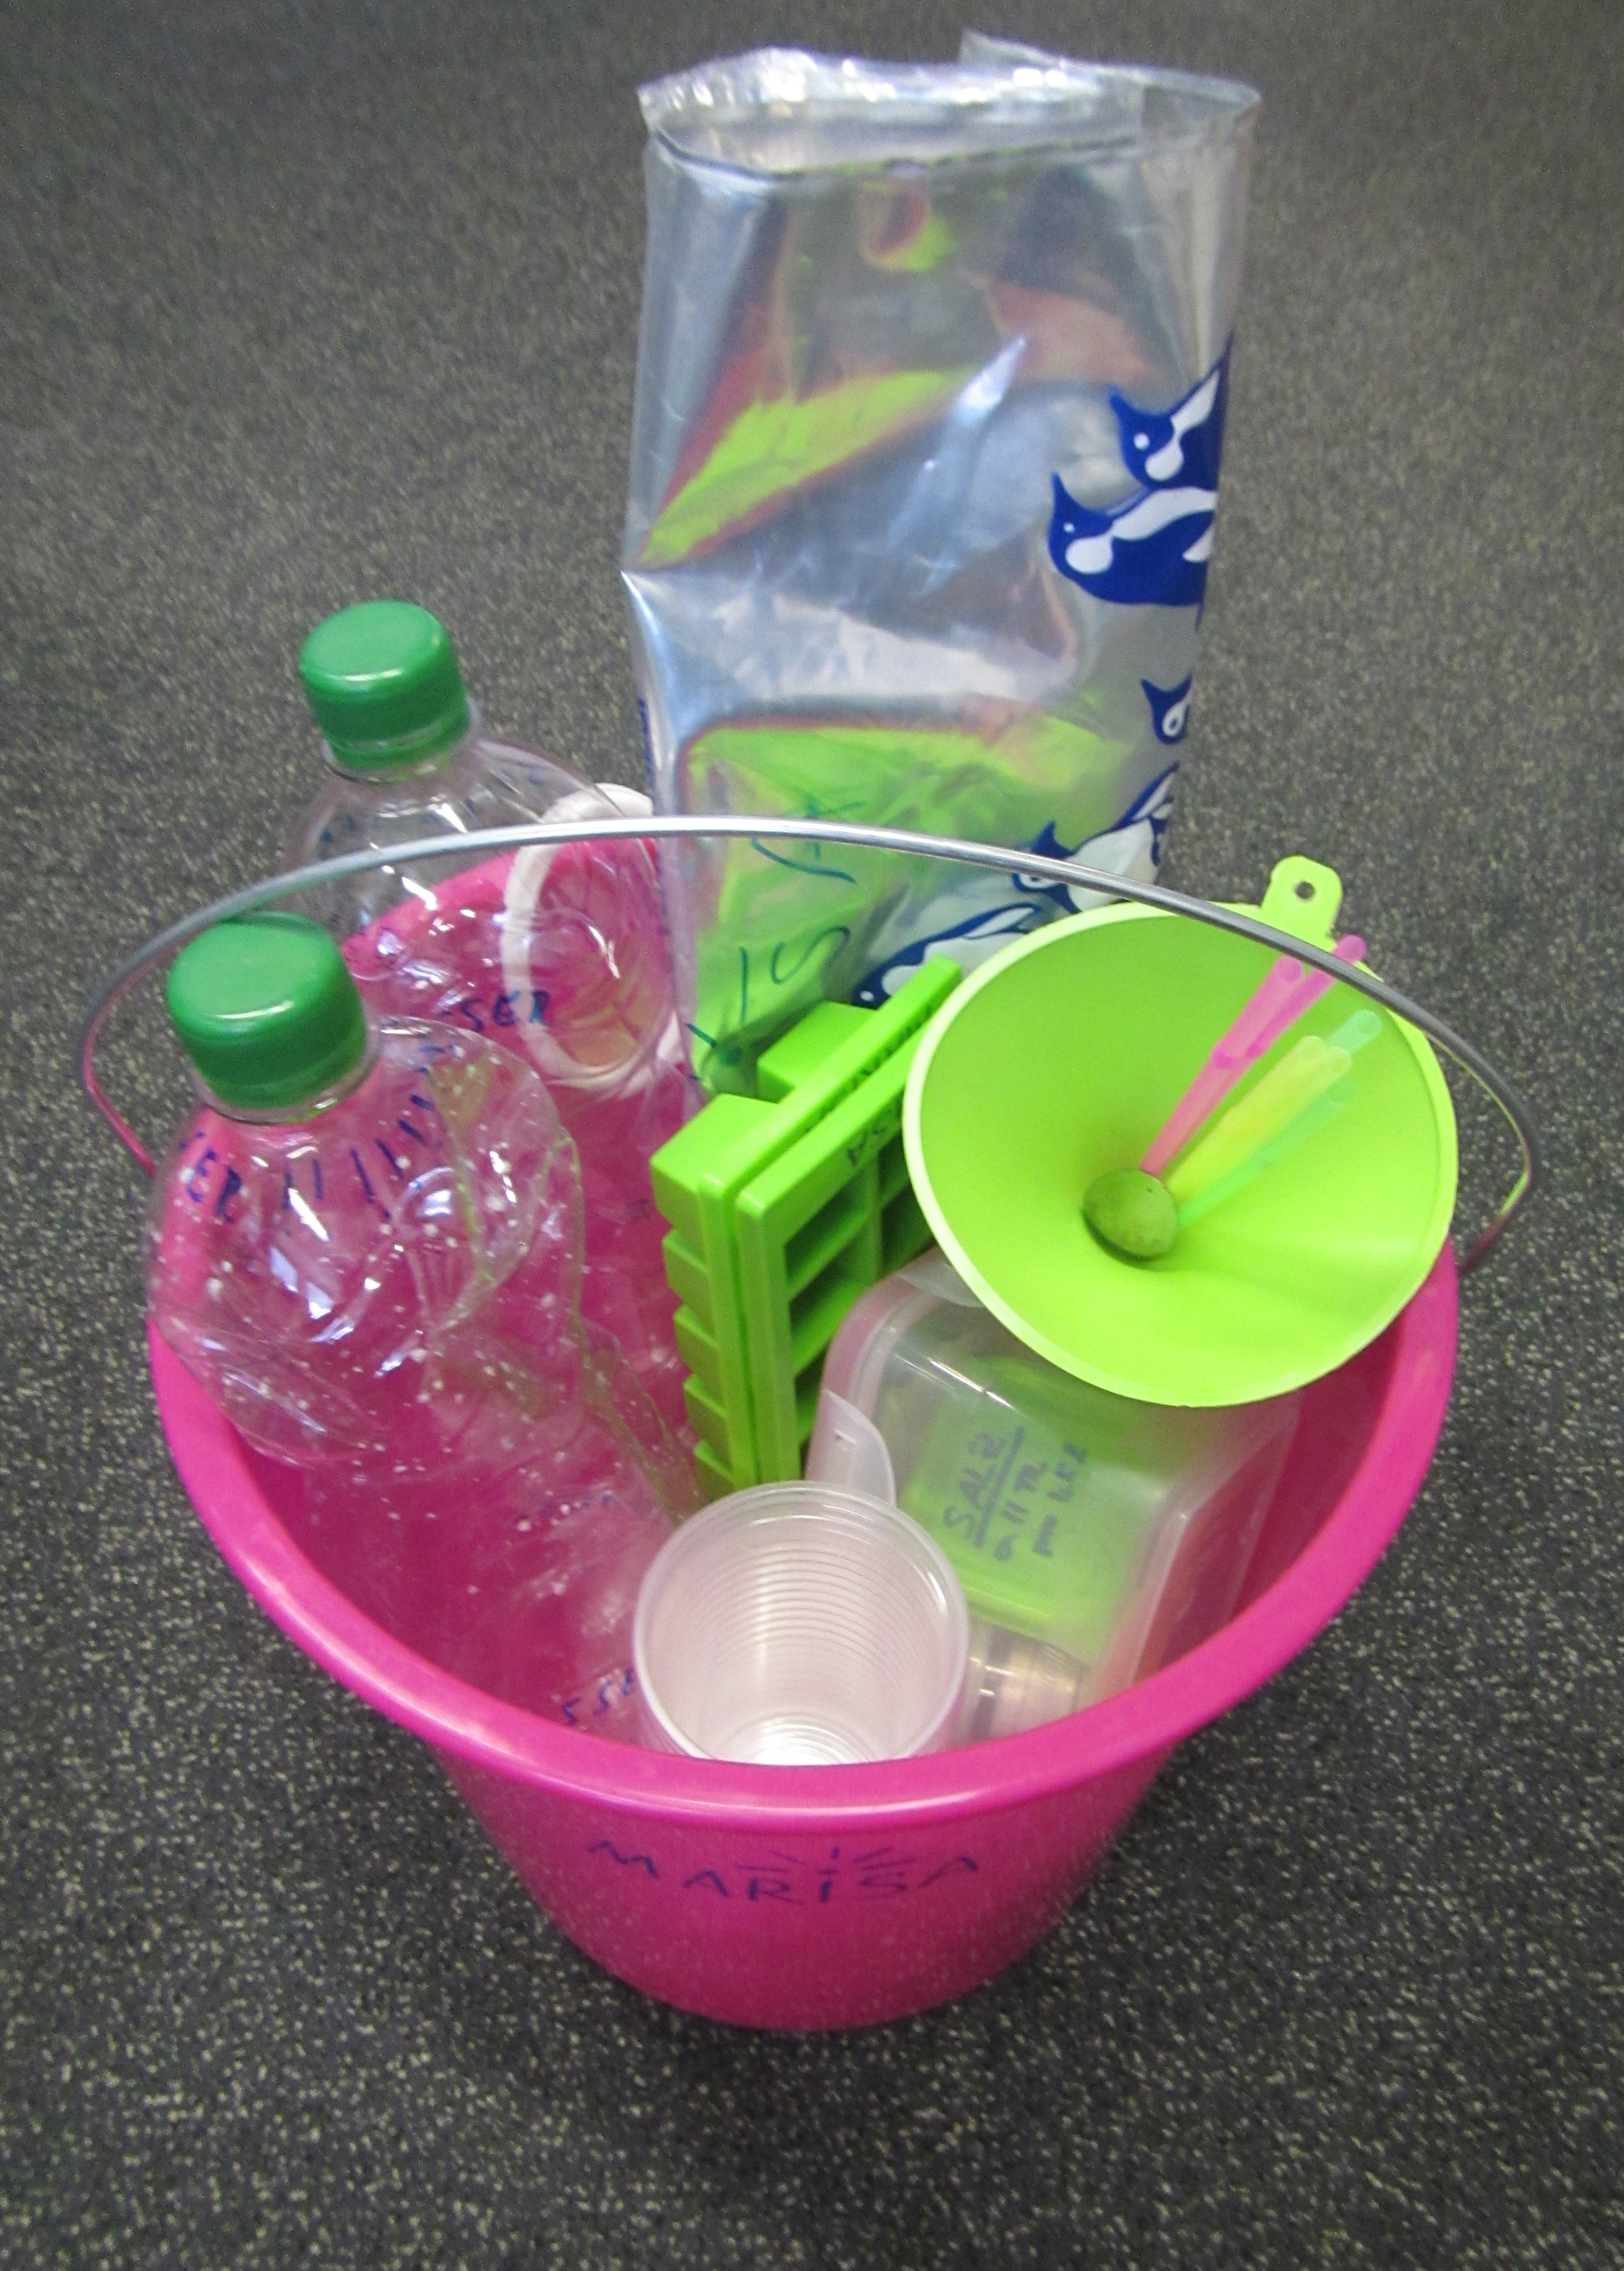
An “ice cube experiment” kit that I made for a friend. Want one, too?

References and Resources

This activity has been discussed before, for example here:

I have also written about it a lot on my blog, see posts tagged “melting ice cubes experiment“.

P.S.: This text originally appeared on my website as a page. Due to upcoming restructuring of this website, I am reposting it as a blog post. This is the original version last modified on November 4th, 2015.

I might write things differently if I was writing them now, but I still like to keep my blog as archive of my thoughts.

Asking students to take pictures to help them connect theory to the reality of their everyday lives

— This post was written for “Teaching in the Academy” in Israel, where it was published in Hebrew! Link here. —

Many times students fail to see the real-life relevance of what they are supposed to be learning at university. But there is an easy way to help them make the connection: Ask them to take pictures on their smartphones of everything they see outside of class, write a short sentence about what they took a picture of, and why it is interesting, and submit it on an electronic platform to share with you and their peers. And what just happened? You made students think about your topic on their own time!

Does it work?

Does it work? Yes! Obviously there might be some reluctance to overcome at first, and it is helpful to either model the behaviour you want to see yourself, or have a teaching assistant show the students what kind of pictures and texts you are looking for.

Do I have to use a specific platform?

Do I have to use a specific platform? No! I first heard about this method after Dr. Margaret Rubega introduced the #birdclass hashtag on Twitter for her ornithology class. But I have since seen it implemented in a “measuring and automation technology” class that already used a Facebook group for informal interactions (see here), and by a second class on the university’s conventional content management system. All that is required is that students can post pictures and other students can see them.

Do you have examples?

One example from my own teaching in physical oceanography: Hydraulic jumps (see figure below). The topic of hydraulic jumps is often taught theoretically only and in a way that students have a hard time realizing that they can actually observe them all the time in their real lives, for example when washing your dishes, cleaning your deck or taking a walk near a creek. But when students are asked to take pictures of hydraulic jumps, they start looking for them, and noticing them. And even if all of this only takes 30 seconds to take and post a picture (and most likely they spent more time thinking about it!), that’s 30 extra seconds a student thought about your content, that otherwise he or she would have only thought about doing their dishes or cleaning their deck or their car.

hydraulic_jumps

Collection of many images depicting hydraulic jumps found in all kinds of environments of daily life

And even if you do this with one single topic and not every single topic in your class, once students start looking at the world through the kind of glasses that let them spot the hydraulic jumps, they are going to start spotting theoretical oceanography topics everywhere. They will have learned to actually observe the kind of content you care about in class, but in their own world, making your class a lot more relevant to them.

An additional benefit is that you, as the instructor, can also use the pictures in class as examples that students can relate to. I would recommend picking one or two pictures occasionally, and discussing for a minute or two why they are good examples of the topic and what is interesting about them. You can do this as introduction to that day’s topic or as a random anecdote to engage students. But acknowledging the students’ pictures and expanding on their thoughts is really useful to keep them engaged in the topic and make them excited to submit more and better pictures (hence to find better examples in their lives, which means to think more about your course’s topic).

Does this work for subjects outside of STEM, too?

Does this work for subjects outside of STEM, too? Yes! In a language class, for example, you could ask people to submit pictures of something “typically English [or whatever language you are teaching]”. You can then use the pictures to talk about cultural features or prejudices. This could also be done in a social science context. In history, you might ask for examples of how a specific historical period influences life today. In the end, it is not about students finding exact equivalents – it is about them trying to relate their everyday lives to the topics taught in class and the method presented in this article is just a method to help you accomplish that.

P.S.: This text originally appeared on my website as a page. Due to upcoming restructuring of this website, I am reposting it as a blog post. This is the original version last modified on October 1st, 2016.

I might write things differently if I was writing them now, but I still like to keep my blog as archive of my thoughts.

Cloud in a bottle experiment

Guest post by Susann Tegtmeier (written two months ago, I just never got around to posting it. Sorry!)

No one likes clouds when they bring rain, but what if you could make your own? Making a cloud inside a bottle will help us to understand how they are formed in the atmosphere. The experiment demonstrates how changes in air pressure, temperature and volume are related and how these changes can lead to the sudden appearance of tiny water droplets, or in other words, lead to the formation of a cloud.

You can do the experiment alone at home, in front of a classroom or as a hands-on experiment with all your students. I have chosen the latter option as part of my ‘Introduction to meteorology’ lecture for the first-year students in the Bachelor program ‘Physics of the Earth System’. For this class, Mirjam and I received funding from our university’s PerLe project for teaching innovations. We use the PerLe funding to consolidate the student’s physical-based understanding of the climate system through various experiments, exercises and discussions.

For the experiment you need an air-tight, transparent container that you can pump up with air (in order to increase the pressure inside the bottle). We made a simple version using materials from home including a plastic water bottle supplemented with valve from a bike tire that is attached between the bottle and the cap. Furthermore you need a pump (in our case a bike pump), water and matches.

Picture by Susann Tegtmeier

During the first round of the experiment, the students pumped up the bottles enhancing the pressure inside. During our discussion before the experiment, the students assumed correctly that the bottles would warm due to the enhanced pressure under a constant volume. By putting their hands around the bottles, it was possible for the students to feel that indeed the air inside the bottles was warming. When opening the valve slowly the opposite effect could be noticed and the bottles cooled very quickly. While the temperature change is small, it turned out to be quite fascinating and memorable for the students to see and feel the ideal gas law, they learned about earlier in class, in real life action.

During the second round of the experiment, the pumping up of the bottles was repeated, but this time with a small amount of water in the bottles. Since warm air can take up more water vapor than cold air, some of the water in the bottle was evaporated during the increase of pressure and temperature. While we discussed this effect during the experiment, it was, of course, not possible to observe the formation of the invisible water vapor. The next step of the experiment, the opening of the valve and the accompanying cooling of air, can theoretically lead to the condensation of the above discussed water vapor back to water. However, to the surprise of the students, no condensing little water droplets could be seen in the bottles.

Picture by Susann Tegtmeier

In order to lift the mystery, we carried out the third part of the experiment. With the bottle open, we lit a match and a moment later threw the blown out, smoking match into the bottle. Now the bottle needs be closed quickly before the same action (pumping of bottles and opening of valve) can be repeated. Only in this last round of the experiment, the expected water droplets became visible while the air was cooling. The reason is that small condensation nuclei are necessary for water vapor to condense and form water droplets. The experiment demonstrates this effect quite nicely in the bottle, but it also holds on large scales for the formation of atmospheric clouds.

The ‘Cloud in a bottle’ experiment is a perfect class room exercise, as it leads the students within 30 min from the basic, physical principles of the ideal gas law to one of the big climate effects, the aerosol – cloud interaction.

The energy lab’s dry run. Or: I have a great team! :-)

At first, I wanted to call this blog post “behind the scenes of a school lab” until I looked through the pictures and realized that all I am showing is people sitting around my desk in my office! Actually, not only sitting — test-running all the experiments for our energie:labor!

First, here is Julian’s experiment on atmospheric CO2.

And here an experiment from Jonas’ station on the role of the ocean in the climate system. A candle below an air-filled balloon. Can you imagine what will happen next?

Yes, this.

Sorry about the jump in perspective — even though I knew what would happen I clearly didn’t expect it enough to hold the camera stable. Small consolidation that everybody else clearly jumped, too?

Anyway, the point of that experiment is to look at the heat capacity of air and water. I’ve written about this before, see here (where we also have pictures of bursting the water-filled balloon because this is how we roll. But only in the lecture theatre, not in my office… ;-)).

Below, we are looking at Jonas’ overturning experiment, apparently discussing the work sheets. It’s really great how well this team works together on developing all their materials, even though their personal styles span the whole spectrum of teaching styles!

But we were also having fun, or at least that’s what it looks like… ;-)

In the picture below, taken on the second day of our dry run a couple of days later, we are looking at Henning’s station on the ice-albedo-feedback. As Henning is sitting next to me and we are sitting around my desk, he’s unfortunately not even in the picture!

In the background of the picture above you see the next exciting station that Nicolas prepared (and big shout out to my office mate who didn’t beat an eye when she came in and the office was filled with all our equipment and smelled of vinegar and white spirit…

What the guys are doing on the picture below? Using a bike pump to increase the pressure inside that bottle to make a cloud in a bottle.

Worked really well!

And then, there comes the most sophisticated piece of equipment of the whole lab: Nicolas’ cloud chamber. I’ll only tell you this much for now: It’s awesome! And you should stay tuned for an upcoming publication on how to build it and how to use it in teaching. Because it’s that great!

Now I’m out of pictures, but there is one last thing I want to say: Thank you, team, you are awesome! :-)

My new school lab on energy in the climate system has been launched! :-)

Today was a very exciting day: We launched my new school lab on energy in the climate system! The “energie:labor” is finally up and running again!

Let me walk you through some of the stuff that is going on in the lab.

Below, you see Mirko, who leads the station on the hydrological cycle, and his group working on an experiment.

In the left jar, you see how much smoke a burning piece of paper makes. The students tried this in order to compare it with the jar on the right. Because what they see in there is not just smoke from a burning piece of paper, it’s steam from the hot water at the bottom of the jar — a cloud in the jar! And the burning paper was just added to provide aerosols as condensation nuclei for the clouds.

Another part of the energy puzzle of the hydrological cycle: How much do raindrops falling down on the ground actually heat up the ground? The students are looking at the wooden board on the floor, using a thermal imaging camera. They won’t see a lot when the bouncing ball hits, but they saw a clear signal with the heavy metal ball they used earlier! Kinda like what we did at the European Researcher’s Night (see here).

Now, they are documenting their observations.

And later, they are running an experiment looking at how much moist vs dry air heats up in that insulated container below the lamp to explore the greenhouse effect of water vapour. The setup of this experiment was developed by Julian who is leading a different station on CO2 in the atmosphere, but sadly I don’t have any good pictures of that station!

On the table next to the hydrological cycle team, there is Jonas, working on the role of the ocean in the climate system. Below, the students are dunking air-filled bottles into hot and cold water baths to watch how air expands and contracts depending on its temperature.

They seem to be having fun!

Later, the team at this station did an overturning experiment. I have tons of pictures of that experiment, because it is just super photogenic (or because I am just still fascinated every time I see it, who knows?)

They are using a very strong lamp to model the heating by the sun near the equator, and cold packs to cool near the poles.

And they seemed to enjoy playing with food dye!

We have two more stations (or three, including the CO2 station I mentioned above), one on clouds run by Nicolas, and one on ice-albedo-feeback run by Henning. Unfortunately I don’t have good pictures of those, either, but I will post pictures of our trial run soon, where they’ll be featured, too.

Let’s close this by looking at how we brought all our new experts back together (because each group only conducted one station, for which they had almost all morning) — by using the Monash Simple Climate Model! I’ve written before about how great it is in teaching (see here), and I am still a big fan!

The new “experts” on clouds, the ocean, the hydrological cycle, atmospheric CO2 and ice-albedo feedbacks explained their topics to the rest of their groups. And — surprisingly enough — in the model, you can switch on and off each of these processes individually and see what effect it has on climate!

I think this worked really well to engage students in discussions about the processes they had just explored, and how they work together. Although I want to work on the kind of questions that guide them through the model before the next class visits the school lab in January…

But all in all, I am very happy with how the launch went, and I am super grateful to my great team! Thanks, Jonas, Julian, Nicolas, Mirko, and Henning (from the left in the picture above)! Hope you are enjoying your well-deserved weekend!

And last not least: Thank you, Frank, for letting us borrow your pupils! They were the nicest group we could have hoped for!

Of cupcakes and ice cores

For a popular science presentation on climate change, I needed a simple illustration for how ice cores can be used as archives of past climates. Luckily, my sister and family were excited to do some early Christmas baking for climate science!

And playing with food colors is always fun…

I think I had too much fun playing, actually, the “ice core data” would have been a lot easier to interpret if the different layers were just laying flat!

I should probably noticed here already that the color pattern wasn’t as regular as it should have been for easy interpretation of the core data later…

But it was fun! And they rose beautifully even though we were a little afraid that the time between mixing in the baking powder and actually baking the muffins was kinda long (because we had to mix in all the different dyes…)

The really difficult part, it turns out, was the coring itself. I had wider-than-usual straws, but instead of just cutting out the core, it was really difficult to have them pierce through the crust, and they compressed the core much more than I had hoped.

You can kind of see where the core goes in the cross section, and how the different colors correspond to their old locations inside the cupcake. But somehow this worked much better in my imagination than it did for real!

And I have a new-found appreciation for food bloggers. It’s really difficult to take good pictures of food!

But in case you were wondering: They taste just like boring, non-rainbow muffins. And my niece liked them! :-)

Observing the “melting ice cubes” experiment with a thermal imaging camera

Remember the melting ice cube experiment? Great!

Experiment: Ice cubes melting in fresh water and salt water. By Mirjam S. Glessmer

If I had the chance to teach an intro to oceanography or some other class where I have time with students over a longer period (these days I am mostly giving one-off workshops), I would actually use the thermal imaging camera to make a different point with this experiment than the one I have usually recommended it for.
I would first do the classical experiment to talk about density-driven circulation. This could be done either using dye (levels of difficulty would be something like 1) easy: freeze dye into the ice cube. 2) medium: let them observe what happens with clear ice cubes and only add dye once they’ve realized that the fresh water ice cube is melting much faster, but have a hard time figuring out why. In this case, drop dye onto the melting ice cubes. 3) no dye at all, but let people focus on condensation pattern on the cups as well as shapes of the ice cubes. I tried that for the first time a couple of weeks ago and it worked really really well. I think that’s my favourite way of doing the experiment now!
After students have done that experiment and we have moved on to properties of seawater etc weeks later, I would bring the same experiment back when talking about how water is transparent to visible light, but not to all other wavelengths. Because students will likely assume that they will see the same kind of pattern that they saw with dye (or that they sketched when they drew the mechanism), but actually, unless the plume of dense water is flowing right along the edge of the cup, they won’t be able to see it because they really only see the temperature of the cup itself and can’t “look inside” the way they can with their eyes. So at first, I would assume, they’d be a bit bored and annoyed to be presented with the same experiment again, until they realize that now the point is a very different one. (Since I haven’t tried to use that experiment in that way, I am not quite sure how it will work, I think it would be important to either hold the melting ice cubes in the middle of the beaker. That way, there is no cold plume along the edge of the cup, and students see cold water appearing at the bottom of the cup “out of nowhere”. Alternatively, one could ask them to look at the cup from the side opposite to where the ice cube is (they always float to the edge somehow), but maybe that would be giving too much away already?). So now the point would be to explain why we can’t see the sinking plume on the thermal imaging camera, and dependency of transparency of sea water on wavelengths of light. This can lead to ocean color, remote sensing, camouflage colors of animals, all kinds of other stuff. I think that could actually be exciting! What do you think?

Melting ice cubes experiment — observing the finer details

If you don’t know my favourite experiment for practically all purposes yet (Introduction to experimenting? Check! Thermohaline circulation? Check! Lab safety? Check! Scientific process? Check! And the list goes on and on…), check it out here. (Seriously, of you don’t recognize the experiment from the picture below, you need to read up on it, it’s awesome! :-))

dyed_ice_cubes_02

Susann and I got funding from PerLe (our university’s project to support teaching innovation) to add a couple of cool new features to Susann’s “intro to meteorology” lecture, and doing a hands-on experiment with 50 students in a lecture theatre in their second lecture was only one of the first of many more to come.

We used the experiment to introduce the students to oceanic circulation, and this experiment is, in my experience, very engaging and sparks curiosity, as well as being very nicely suited as a reminder that things are not as easy as they seem to be when you see those nice plots of the great conveyor belt and all the other simplified plots that you typically see in intro-level lectures. Especially understanding that there are many different processes at play simultaneously, and that they have different orders of magnitude and might act in different directions helps counteract the oversimplified views of the climate system that might otherwise be formed.

I usually use dye to make it easier to observe what’s going on in the experiment (either by freezing it directly into the ice cubes as shown in the picture on top of this blog post, or by dripping it onto the melting ice cubes when students have started to observe that — counter to their intuition — the ice cube in the fresh water cup is melting faster than the one in the salt water cup).  We had dye at hand, but I decided on the spur of the moment to not use it, because the students were already focussing on other, more subtle, aspects that the dye would only distract from:

The shape of the ice cubes

In many of the student groups, the most prominent observation was that the shape of the melting ice cubes was very different in the fresh water and salt water case. In the fresh water case, the ice cube melted from the sides inwards: as a cylindrical shape with a radius that was decreasing over time, but in any instance more or less constant for all depths. In the salt water case, however, the ice cube melted upwards: The top did not melt very much at all, but the deeper down you looked the more was melting away. Why?

Condensation on the sides of the cup

Another observation that I prompted was in what regions the cups showed condensation. In the fresh water case, there was a little condensation going on everywhere below the water line, and sometimes there were vertical streaks down from where the ice cube was touching the wall. In the salt water case, there was only a small band of intense condensation close to the water level.

This, not surprisingly, looks very similar to what a thermal imaging camera sees when observing the experiment (as described in this post).

screen-shot-2017-06-11-at-17-12-55

Taken together, those two observations are quite powerful in explaining what is going on, and it seemed to be a fun challenge for the students to figure out why there was condensation on the outside of the cups in the first place (does condensation occur in warmer or colder places?), what it meant that different places ended up being warmer or colder, and how all of that is connected to global ocean circulation. Definitely an experiment I would recommend you do! :-)

Melting ice cubes & thermal imaging camera

I haven’t talked about my favourite experiment in a long time (before using it last week in the MeerKlima congress and suddenly talking about it all the time again), because I felt like I had said everything there is to say (see a pretty comprehensive review here) BUT! a while back my colleagues started playing with a thermal imaging camera and that gave me so many new ideas! :-)

I showed you this picture yesterday already:

img_9381

Here we see ice cubes melting in fresh water and salt water (and my very fancy experimental setup. But I am pretty proud of my thermal insulation!). Do you know which cup contains which?

Here are some more pics: The ice cubes before being dropped into the cups. Clearly dark purple is cold and yellow/white is warm (see my fingers?)

screen-shot-2017-06-11-at-17-12-29

After a while (5ish minutes), the cold meltwater has filled up the bottom of the freshwater cup while floating on top of the salt water cup:

screen-shot-2017-06-11-at-17-12-55

Looking in from the top, we see that the ice cube in salt water hasn’t melted yet, but that the other one is gone completely and all the cold water has sunk to the bottom of the beaker.

screen-shot-2017-06-11-at-17-13-20

When you check out the movie at the bottom of this post, you will notice that this experiment doesn’t work quite as well as I had hoped: In the saltwater cup, the ice cube floats against the wall of the cup and for quite some time it looks like there is a plume of cold water sinking in the salt water. I’m not quite sure what’s going on there. If it’s showing up like that because the cup is such a good thermal conductor, then why is the “plume” directional and not spreading in all directions? If there really is a plume, then how did it get there? It shouldn’t be! So many questions!

There really can’t be a plume of cold melt water in the salt water cup. For my workshop last week I made the plot below (which, btw, I don’t think anyone understood. Note to myself: Explain better or get rid of it!). So unless the plume is cold salt water, there is no way anything would sink in the salt water cup.

screen-shot-2017-06-11-at-17-23-02

So maybe we are cooling the salt water around the ice cube which then sinks and shows up because it is close to the wall of the cup? We can’t look “into” the cup with a thermal imaging camera, we can only see the surface of the cup (See, Joke? Maybe it is useful after all to learn all that stuff in theoretical oceanography ;-)). That’s also why we don’t see a plume of cold melt water in the freshwater case like we see when we have dyed ice cubes and see the melt water plume, like below:

dyed_ice_cubes_02

Anyway. Here is the video, in which you sometimes see my finger, pushing the ice cube away from the beaker’s wall to finally get to a state that looks like what I wanted to show you above:

https://vimeo.com/221156676

My workshop at MeerKlima.de

Today I ran a workshop at the MeerKlima.de congress in Hamburg: A congress for high school students, organised by a student committee. The large lecture theatre of the chemistry department at the University of Hamburg was crowded for the opening lecture by Mojib Latif:

For my workshop, however, we set a limit of 40 participants due to the size of the room (and the amount of stuff that I had lugged in from Kiel. Yesterday’s ice cubes did very well, btw!). And there were two TV crews and a photographer documenting the awesome ice cube experiment.

You can watch documentaries of the workshop here and here (both in german).

Sneak peak of those two documentaries, obviously only of the tiny little sequences featuring me:


And thanks to Johanna and Dirk for their support before, during and after the workshop!

I also got to watch another workshop by a colleague, who used the Monash Simple Climate Model (which I have talked about here) and I have got to say: That is such an awesome tool for teaching about models and/or the climate system! You will definitely hear more about it in the future as I incorporate it into my own teaching.

And last not least we had a phone call to the Meteor off Peru which rounded off a day full of bumping into people I hadn’t seen in a while. Always great to reconnect with old friends and colleagues!

It was great fun to be part of this congress, and it was a great way to experience first hand how science outreach can work in such a format. Since the congress was curated by the students themselves, many students were very interested and asked great questions. Also, the topics of the workshops corresponded closely to what students really wanted to see and hear. It would be amazing to see this scaled up next year, maybe over several days and with more parallel sessions, so that participating students really get to pick and choose exactly what topic they are interested in and that even more students get the opportunity to experience such an amazing congress!