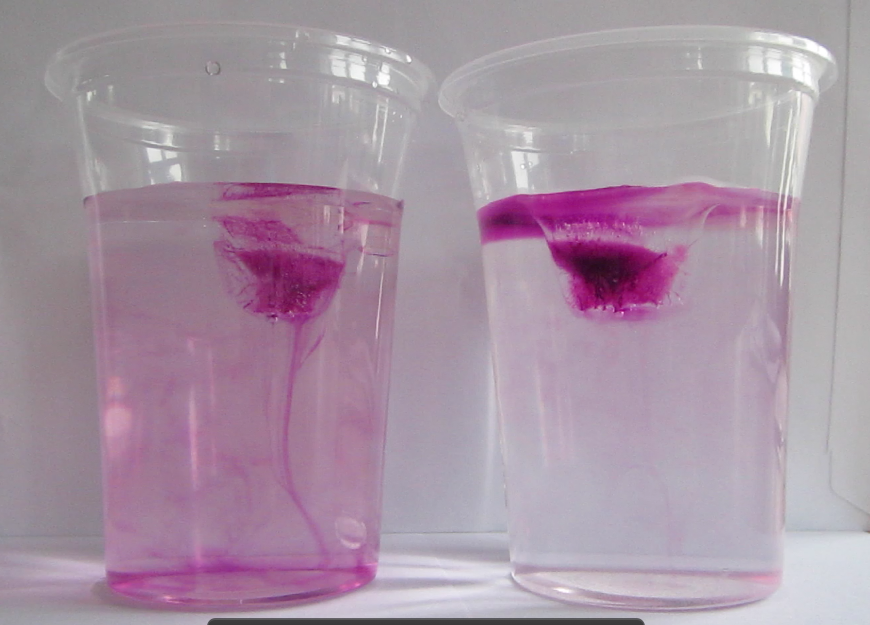
If you don’t know my favourite experiment for practically all purposes yet (Introduction to experimenting? Check! Thermohaline circulation? Check! Lab safety? Check! Scientific process? Check! And the list goes on and on…), check it out here. (Seriously, of you don’t recognize the experiment from the picture below, you need to read up on it, it’s awesome! :-))
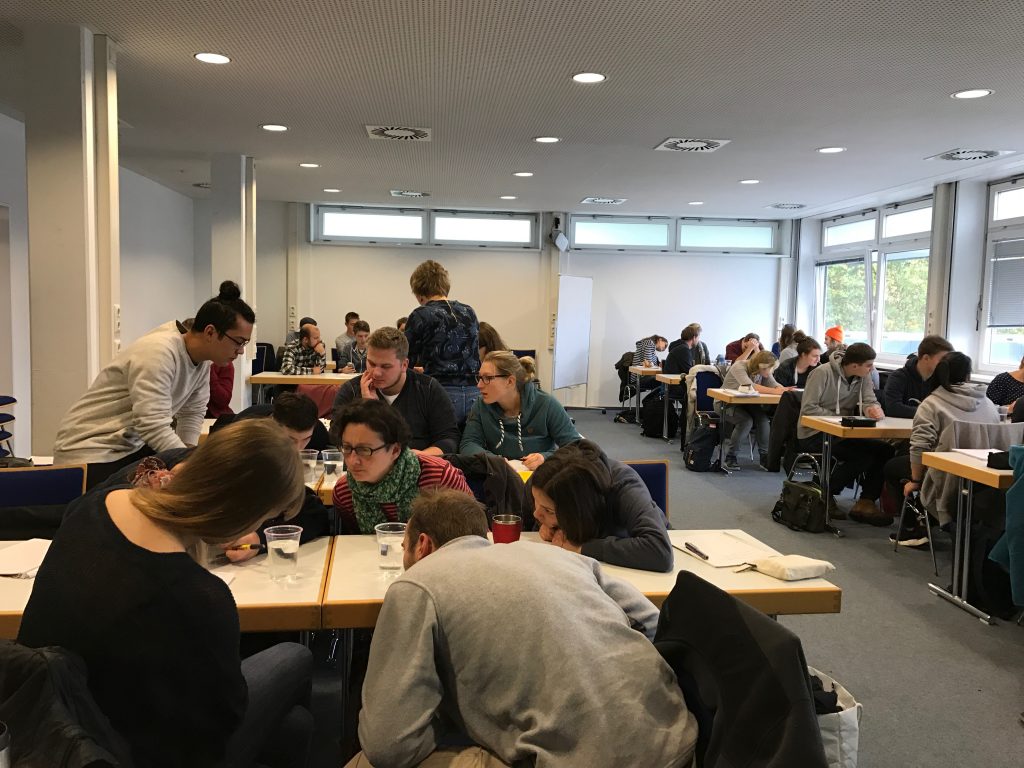
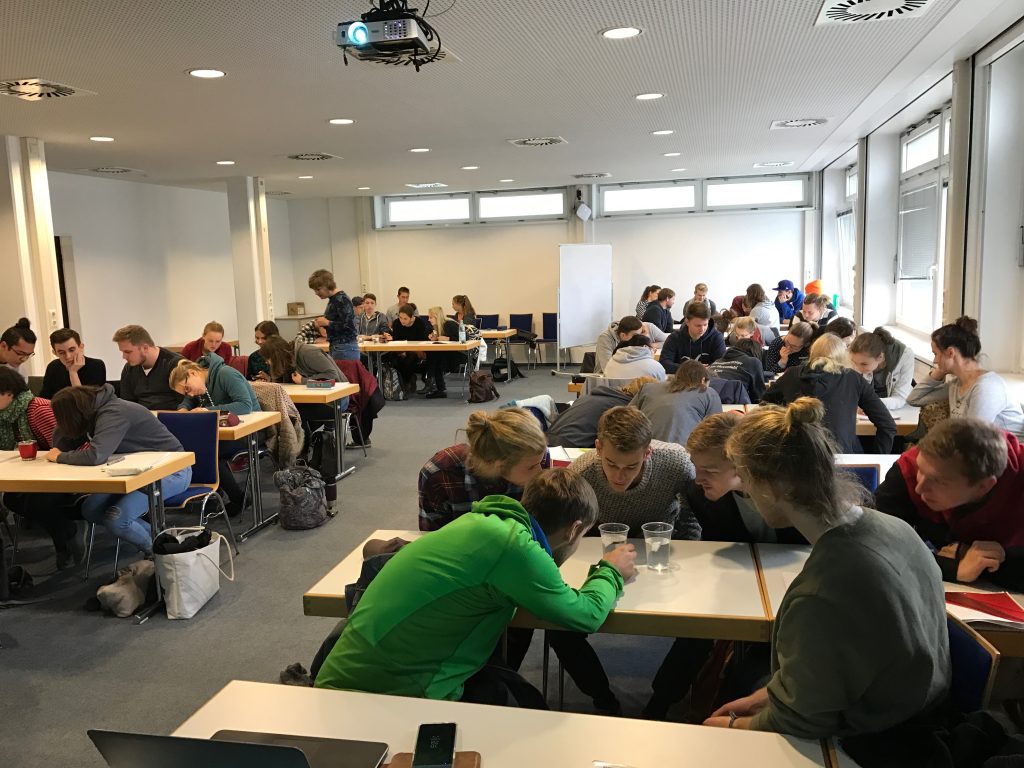
Susann and I got funding from PerLe (our university’s project to support teaching innovation) to add a couple of cool new features to Susann’s “intro to meteorology” lecture, and doing a hands-on experiment with 50 students in a lecture theatre in their second lecture was only one of the first of many more to come.
We used the experiment to introduce the students to oceanic circulation, and this experiment is, in my experience, very engaging and sparks curiosity, as well as being very nicely suited as a reminder that things are not as easy as they seem to be when you see those nice plots of the great conveyor belt and all the other simplified plots that you typically see in intro-level lectures. Especially understanding that there are many different processes at play simultaneously, and that they have different orders of magnitude and might act in different directions helps counteract the oversimplified views of the climate system that might otherwise be formed.
I usually use dye to make it easier to observe what’s going on in the experiment (either by freezing it directly into the ice cubes as shown in the picture on top of this blog post, or by dripping it onto the melting ice cubes when students have started to observe that — counter to their intuition — the ice cube in the fresh water cup is melting faster than the one in the salt water cup). We had dye at hand, but I decided on the spur of the moment to not use it, because the students were already focussing on other, more subtle, aspects that the dye would only distract from:
The shape of the ice cubes
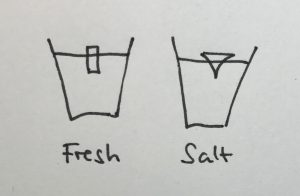
In many of the student groups, the most prominent observation was that the shape of the melting ice cubes was very different in the fresh water and salt water case. In the fresh water case, the ice cube melted from the sides inwards: as a cylindrical shape with a radius that was decreasing over time, but in any instance more or less constant for all depths. In the salt water case, however, the ice cube melted upwards: The top did not melt very much at all, but the deeper down you looked the more was melting away. Why?
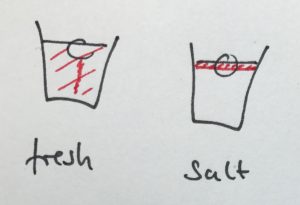
Condensation on the sides of the cup
Another observation that I prompted was in what regions the cups showed condensation. In the fresh water case, there was a little condensation going on everywhere below the water line, and sometimes there were vertical streaks down from where the ice cube was touching the wall. In the salt water case, there was only a small band of intense condensation close to the water level.
This, not surprisingly, looks very similar to what a thermal imaging camera sees when observing the experiment (as described in this post).
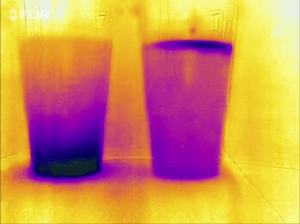
Taken together, those two observations are quite powerful in explaining what is going on, and it seemed to be a fun challenge for the students to figure out why there was condensation on the outside of the cups in the first place (does condensation occur in warmer or colder places?), what it meant that different places ended up being warmer or colder, and how all of that is connected to global ocean circulation. Definitely an experiment I would recommend you do! :-)
Pingback: Observing the “melting ice cubes” experiment with a thermal imaging camera – Mirjam S. Glessmer
Pingback: Melting ice cubes experiment published in kids’ journal Frontiers Young Minds | Dr. Mirjam S. Glessmer