Tag Archives: GEOF130

Student cruising

Why student cruises always end up being on the most beautiful days of the year, or: why student cruises are an important part of the education.

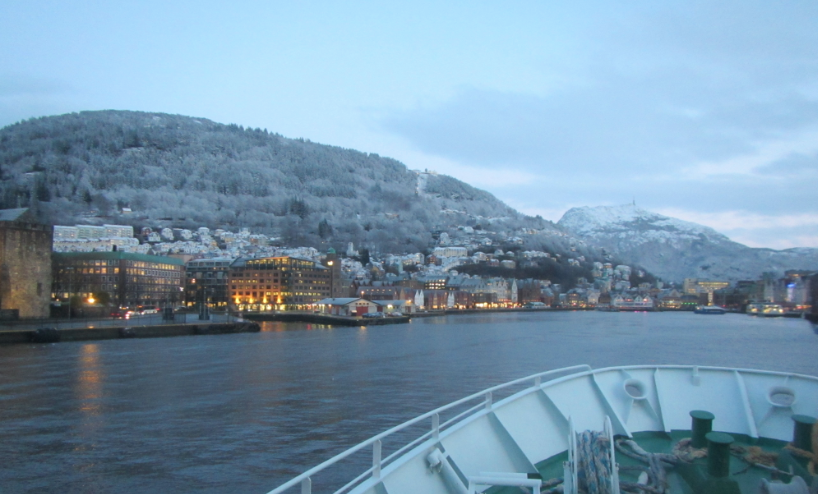
Remember the picture I showed in the last post, that was worthy of being on an Advent calendar or postcard? The one below?
IMG_5874

FS Håkon Mosby arriving back in Bergen in November 2013.

That was taken on this year’s GEOF130 student cruise.

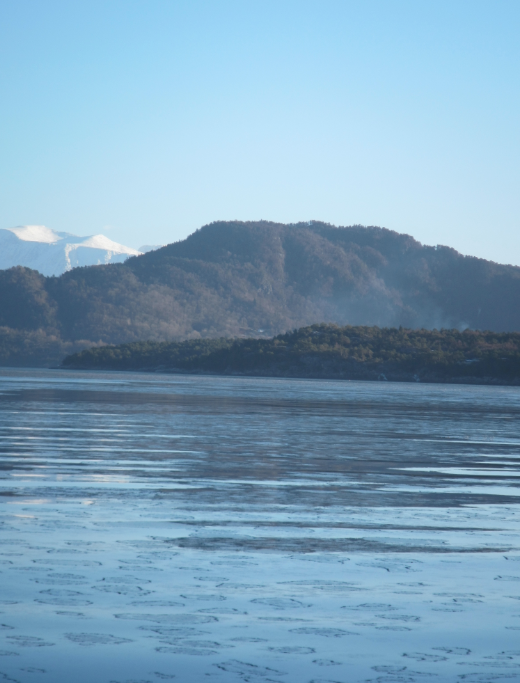
And remember the ice-on-Hardangerfjorden picture I shared a while back? This one?

Oh, taken on this year’s GEOF332 student cruise.

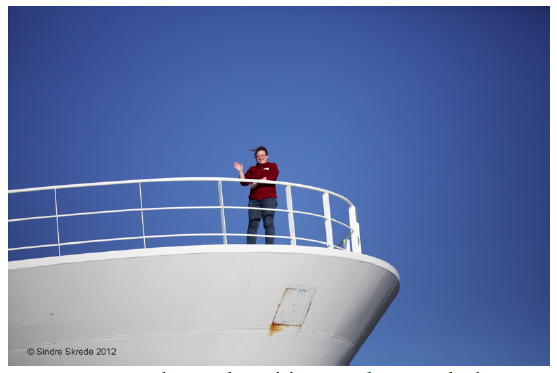
And the student cruise before, GEOF130 in 2012, looked like this:

See a pattern here?

So how come we always end up being out on the perfect day? Well, firstly, clearly I am that good. Or that lucky. But then, the perfect day only becomes the perfect day when you give it the chance.

What I mean is that on student cruises, it is easy for a day to become perfect. Because it is exciting to be on a research ship for the first time, to figure out how to measure oceanographic data, to develop a feeling for how much the ship is actually supposed to be rolling before you have any reason to become concerned, to see how your oceanography classes apply to the real world, to put on an orange one-fits-all survival suit, to gauge how you can influence the quality of the data by paying attention (or not), to get a break from your everyday life, to eat all the awesome food all the time, to visit the captain on the bridge, to see the familiar city from the water, to see a whole new world opening up to you, to experience what it could be like to be an oceanographer.

Especially in the “introduction to oceanography” lecture GEOF130, the student cruise is so much more than just knowledge transfer – it is an incredibly important part of building a professional identity that helps students to find motivation to sit through boring lectures and to fight through difficult exams because in the end they will then get to do this again: to go an another cruise and have more perfect days at sea.
 

Oceanographic concepts and language (part 1)

About teaching in a language that is a foreign language for both your students and yourself.

Most of my teaching so far has happened in English to mainly non-native English speakers with the occasional native speaker thrown in. One thing that I realized recently was that concepts that are definitely not common knowledge at home in Germany and that are described by technical terms in German, are absolute household terms in other language.

Let’s for example think about density.

In German, or Norwegian for that matter, “Dichte” or “tetthet” is not a concept that is used in everyday language very much, and that therefore needs to be explained in introductions to oceanography, and that typically is rather difficult to understand for the students. I usually introduce density both by talking about mass per volume, and then by showing experiments to visualize what differences in density can look like, for example by showing that soda cans with the exact same volume can still sink or swim depending on what’s inside.

In English however, people have an intuitive understanding of what density is – a measure of compactness. A densely populated area is an area where many people live close together. If a lecture is very dense, there is a lot of content for the amount of time you attend. A low-density floppy disk will not be able to contain as much information as a high-density one. So having this background, not a lot of transfer is needed to be able to talk about the density of water.

I am usually pretty aware that I am teaching in a language that is foreign to both the students and to me, and I try to compensate for that by explaining what I perceive as technical terms. But recently I had a native English speaker in one of my classes, and that person got really upset because I spent so much time on what that person thought was trivial. So I guess language awareness needs to go both ways – not only being aware of what kind of vocabulary students of certain nationalities probably won’t be familiar with, but also being aware of the vocabulary that I learned as technical terms and that are not perceived as technical terms by students of other nationalities.

Dear readers, have you come across this? What other terms can you think of that we should be aware of?

Water not in solid body rotation yet

Confusing students even more by discussing how momentum is being transferred from the tank to the water.

As you remember, we are preparing for the Ekman experiment and need to spin up the tank to solid body rotation.

We had started discussing how, when observed from the co-rotating camera, particles seem to be slowing down relative to the coordinate system underneath the tank as we are approaching solid body rotation.

And this is where I usually confuse the students even more, because I start talking about how momentum is being transferred from the tank to the water. For that, I point out how when observing the tank from the non-rotating framework, the particles further away from the center are moving faster than the ones closer towards the center…

(and on the screen: particles closer to the center are moving faster than the ones further away).

Why is that?

Well, for exactly the same reason we can use this setup to simulate Ekman spirals: Because when the tank is sped up or slowed down, this initially creates friction with the water inside. And as the layer that is in direct contact with the tank is brought to the same speed as the tank, it changes its velocity relative to the next layer, which creates friction and influences the movement of this second layer. And so on and so forth.

I think that it is really useful to point this out, and in some of the groups students jump at it and understand where I am going right away, but in other groups I just cannot phrase it in a way that they understand me. Or maybe they are just not as fascinated as I am by being able to see how friction inside water propagates momentum and hence don’t get excited? Who knows.

[Thanks, Pierre, for your help with the filming!]

Water in solid body rotation.

Spinning up a tank until all water particles move with the same angular velocity.

Before running the Ekman spiral experiment, the tank needs to be spun up to solid body rotation. Even though the concept itself is not difficult, it seems to be difficult to determine when a body of water has reached the point where it rotates as a solid body. So here is my attempt to sort my thoughts well enough to explain it better next time I teach this experiment.

Firstly: Solid body rotation of water in a tank basically means that every water molecule is at rest relative to the tank (neglecting thermal movement). This means that over any given period of time, particles that started out on a straight line going radially outwards from the centre will still be on straight line going radially outwards from the centre, with the same radii as initially.

But since we are usually not rotating with the tank, this is pretty hard to observe from a non-rotating frame. Enter the mounted camera rotating with the tank (and, I think, the confusion).

When we start up the rotation of the tank, the water is initially at rest in the frame of the lab. This means that for a counter-clockwise rotating table, particles on the water surface appear to be moving clockwise when observed on the screen.

As time goes by, the water inside the tank starts spinning with the tank, and with it the particles on its surface. On the screen, this appears as though the particles are slowing down.

When the particles don’t move any more relative to the coordinate system underneath the tank, the water is moving with the same speed as the tank and solid body rotation has been reached.

Part 2 will shortly be uploaded, looking into how momentum is being transferred from the tank to the water.

Ekman spiral in a tank.

Tank experiment showing (the effects of) the Ekman spiral.

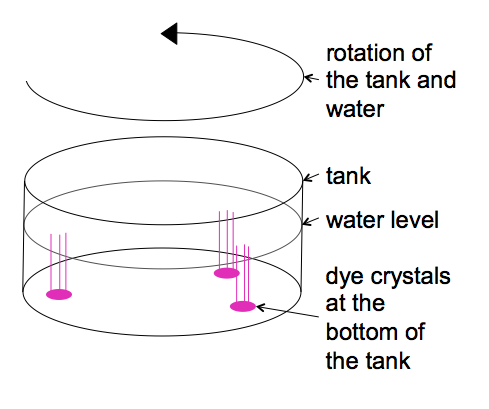
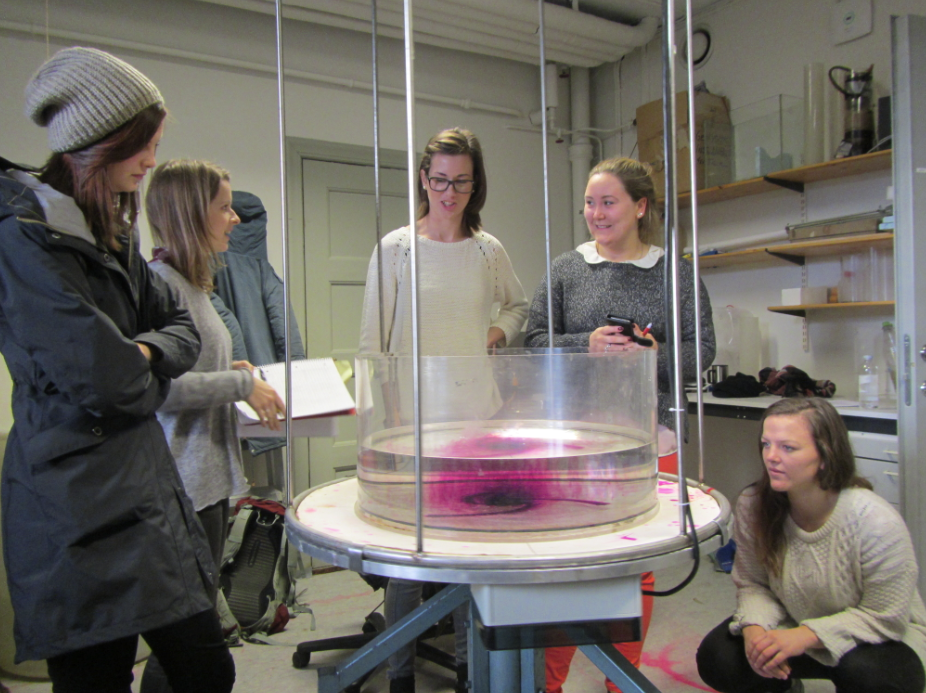
One experiments that has been run in GEOF130 forever is the “Ekman spiral” experiment. A tank filled with water is spun up to solid body rotation on a rotating table.

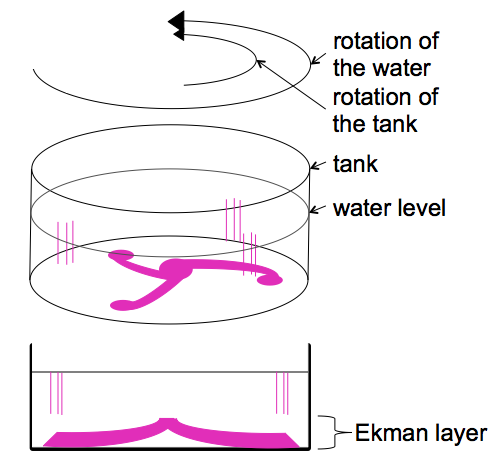
Then the tank is slowed down. The resulting friction between the water body and the tank creates a bottom Ekman spiral.

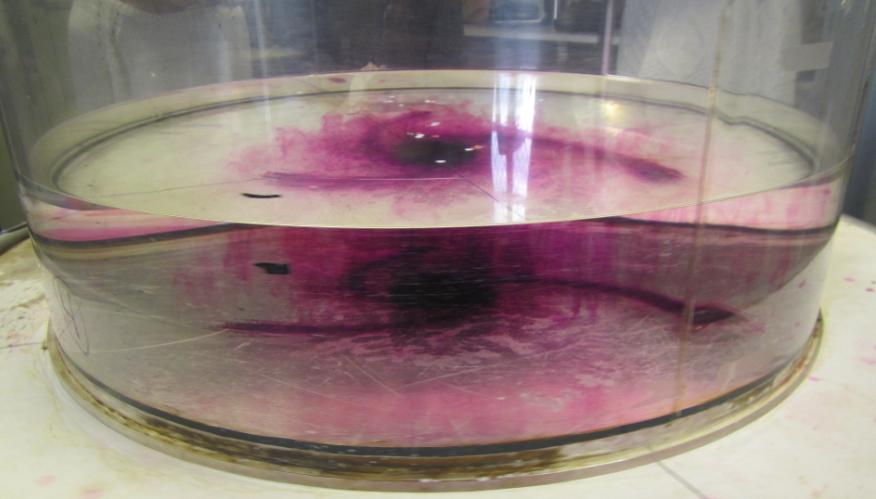
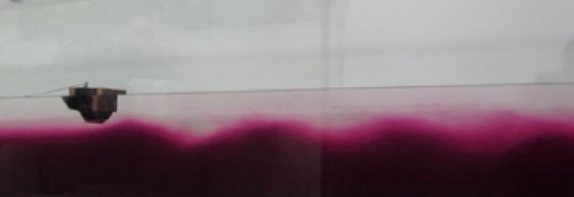
In the lab, you can observe the Ekman depth by looking into the tank from the side:

I’m showing you here what they see, except that you have a big advantage: The camera was mounted on the rotating table, so instead of watching the tank rotate in front of you (which makes it really difficult to focus on features without getting seasick) you are actually rotating with the tank.

It is very difficult to capture on video or photo, but Pierre and I are doing our best.

Stay tuned for a nice Ekman movie coming up soon!

Ship-generated internal waves

A tank experiment showing ship-generated internal waves.

When entering a fjord from the open ocean by ship, it can sometimes be noted that the speed of the ship changes even though apparently nothing else changed – the wind didn’t change, the position of the sails didn’t change, the settings on the engine didn’t change – whatever was driving the ship didn’t change. And yet, the ship slowed down. How can that be?

According to the legend (that I like to propagate in my classes), when this phenomenon was first noticed, people attributed it to sea monsters latching onto the ship and slowing it down. Or if not monsters, than at least mollusks and other not-quite mostery monsters. But then Bjerknes came along and, together with Ekman, set up experiments that explain what is taking all the energy away from propulsion. I’ll give you a hint:

Yes – the ship excites internal waves at a density interface. Since the stratification in a fjord is much stronger than in the ocean, driving into a fjord means loosing a lot more energy towards the generation of internal waves.

See the movie here:

Velocity of shallow water waves.

The experiment we run to discuss the velocity of shallow water waves.

In this post, I discussed how it took us several years to modify an experiment to make it both student and teacher-friendly. But what can you actually see in that experiment?

The movies below show the type of standing waves that are excited in the tank. This movie for 24 cm water depth (Ha – this is going to come back and haunt me! I’m not actually sure what the water depth in this experiment is. It looks like this is the case with the highest water level we have run. But if you want to know for sure go ahead, measure the period, calculate the phase velocity (the tank is 175 cm long) and then calculate the water depth. Good practice! ;-))

And then this movie shows the experiment with a lower water level (12 cm? 8? I don’t remember).

It’s interesting to see how much more difficult it is to excite a nice standing wave if you have less water in the tank. Intuitively that makes sense, but does anyone have a good, not-too-theoretical explanation?

Seesawing of standing waves.

Improving one of the experiments run in the GEOF130 lab.

One experiment that has been run in GEOF130 forever is the “standing wave”, where a wave is excited in a long and narrow tank and then, for different water depths, the period is measured and the velocity calculated in order to compare it to the one calculated from the shallow water wave equation.

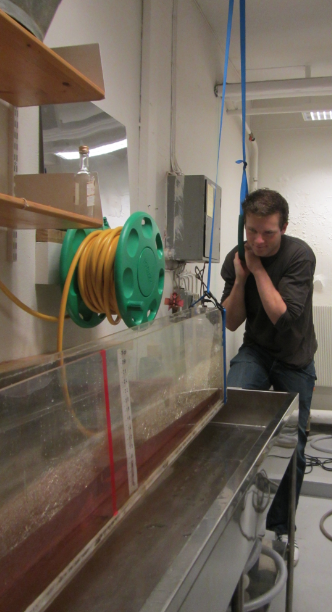
Traditionally, the standing wave is excited by lifting one end of the tank, letting the water settle down, and carefully putting the tank back down. This, however, means that someone has to lift a pretty heavy weight. So Pierre and I were quite proud of ourselves when we constructed a pulley system last year and now instead of lifting the weight up, someone could hang on a rope instead.

However, this was still hard work, and even though the picture shows a student doing the lifting, for most lab groups it was actually Pierre who did it.

But then this year, we came up with a much simpler solution and I don’t know how we didn’t see this before now. As Pierre remarked: We talk about seesawing standing waves ALL THE TIME. How did it not occur to us that the simplest setup would be a seesaw? So now we have two wooden blocks underneath the tank, one supporting it in the middle and one underneath the end where the operator is standing. So all that needs to happen now is a slight lift of the tank and then a slight downward push to bring it back in the horizontal.

So much easier!

How sound is refracted towards the regions of minimum speed.

Students acting out the process of sound being refracted towards the region of minimum speed.

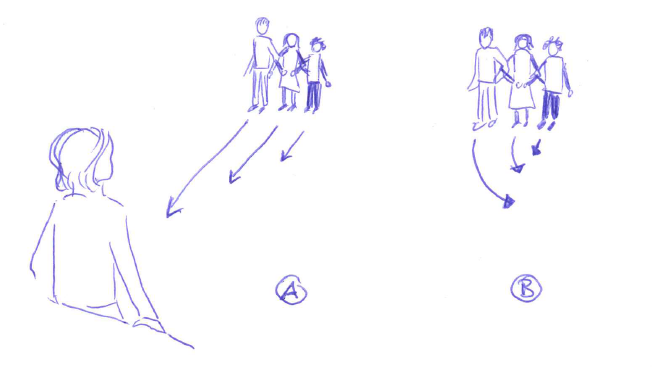
We’ve been talking about refraction lately. Waves get bent in the direction of lower velocity. This holds for light and sound and even ocean waves. However, students find it conceptually difficult to understand why waves are being bent towards lower rather than higher speeds, so I came up with this very simple demonstration.

Students, arms joint, are acting as a wave crest. Students on the one side of the student chain are told to move very slowly, students on the other side are asked to move quickly towards the instructor. Everybody takes care to not hurt anybody, so if tension builds up in the chain, everybody has to react to reduce the tension. What happens is that the “wave crest” of students changes direction towards the side of the slowest motion.

Easy visualization and – since it involved students getting up, joining arms and doing something – also very memorable. Win – win!

Another easy example: When you are sliding on an icy road and your foot gets caught in grass or gravel or something on one side (== region of lower velocity), you start skidding towards the side with the obstacle, not towards the middle of the icy road.

Water seeks its level.

A solution for the siphon problem of the fjord circulation experiment.

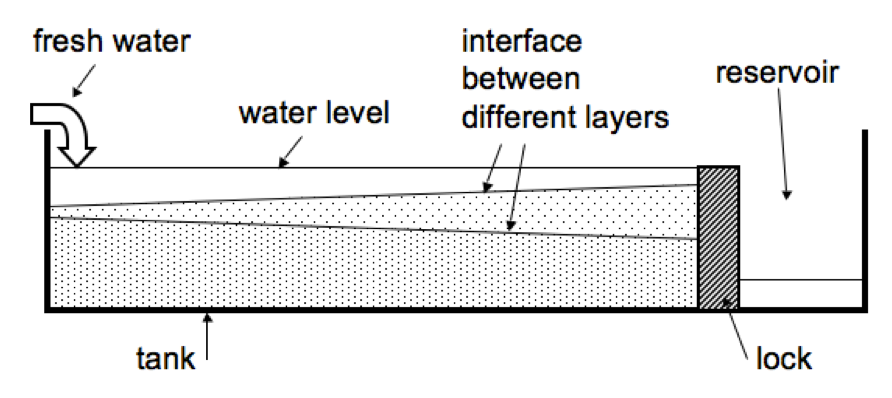
After having run the fjord circulation experiments for several years in a row with several groups of students each year, Pierre and I finally figured out a good way to keep the water level in the tank constant. As you might remember from the sketch in the previous post or can see in the figure below, initially we used to have the tank separated in a main compartment and a reservoir.

 But there were a couple of problems associated with this setup. Once, the lock separating the two parts of the tank fell over during the experiment. Then there are bound to be leaks. Sometimes we forget to empty the reservoir and the water level rises to critical levels. In short, it’s a hassle.

So the next year, we decided to run the experiment in a big sink and tip the tank slightly, so that water would just flow out at the lower end at the same rate that it was being added on the other side. Which kinda worked, but it was messy.

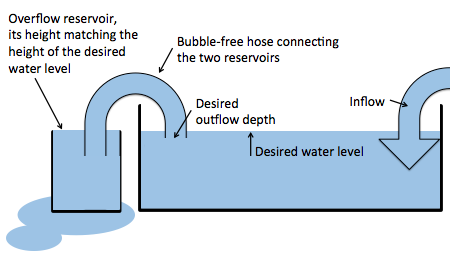
So this year, we came up with the perfect solution. The experiment is still being run in a sink, but now a hose, completely filled with water, connects the main tank with a beaker. The hight of the rim of the beaker is set to the desired water level of the big tank. Now when we add water to the big tank, there is an (almost – if the hose isn’t wide enough) instant outflow, so the water level in the tank stays the same.

Tankausfluss

New setup: A bubble-free hose connecting the tank and a reservoir to regulate the water level in the tank.

This way, we also get to regulate the depth from where the outflowing water is being removed. Neat, isn’t it?