Tag Archives: density

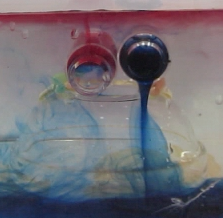
Cylinder collapse on a cone

Water running uphill during spin-down – how much more awesome can it get?

After hours, when all but the most curious students had left, Rolf and I ran another collapsing cylinder experiment, this time on Rolf’s old disk player turned rotating table.

IMG_9097

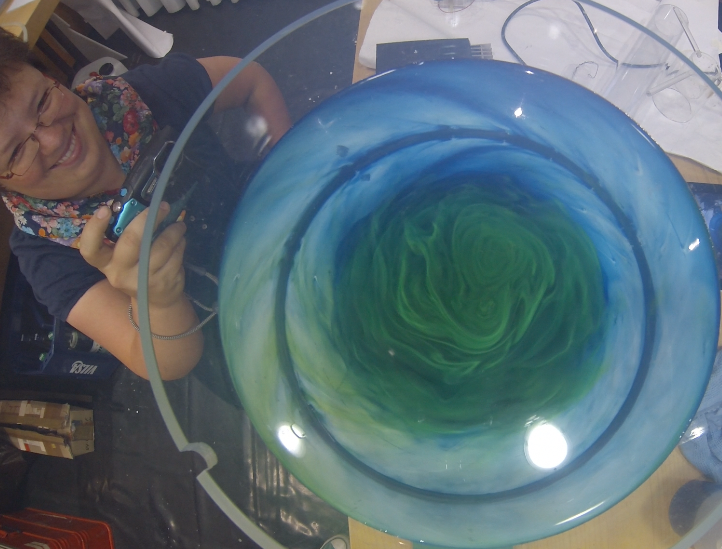
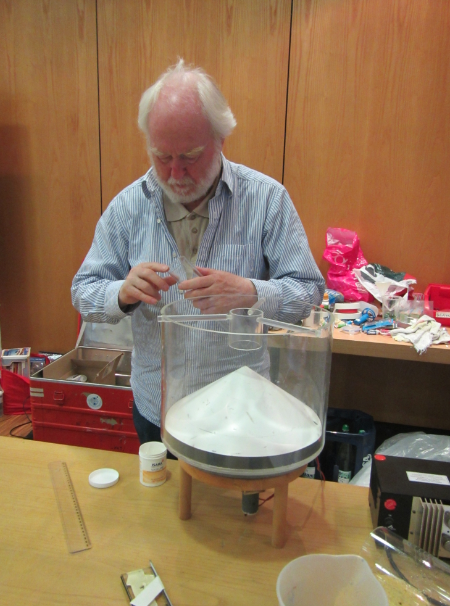
Rolf setting up the experiment

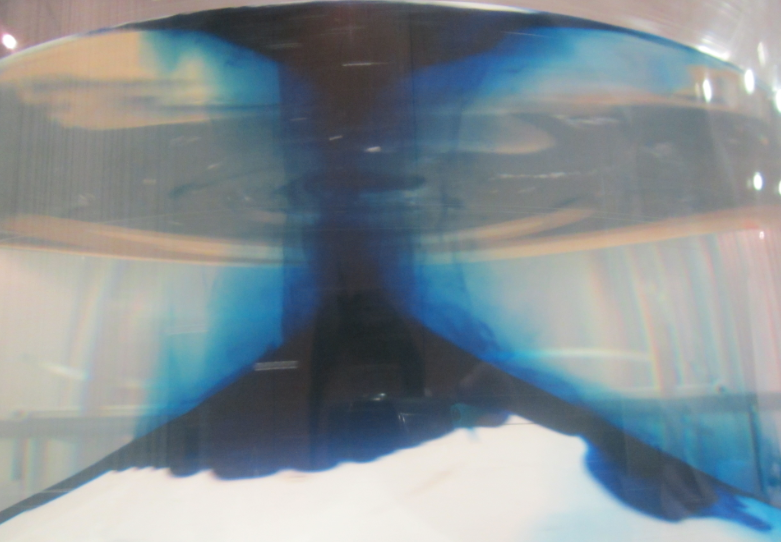
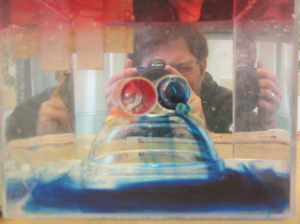
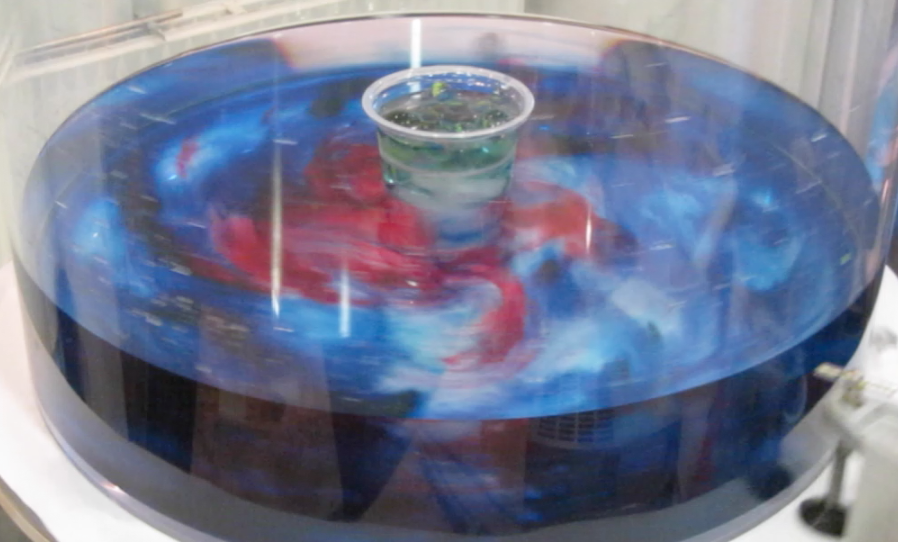
Rolf has a cone-inset for the round tank, and we set a cylinder on top of the cone and filled it with dyed salt water. The rest of the tank was filled with fresh water and the whole system spun up into solid body rotation. Then the cylinder was pulled out and here is what happened:

IMG_9107

Column sitting on top of the cone!

The column sat right on top of the cone! And stayed there, and stayed there, and stayed there. Slowly a bottom boundary layer started creeping down the slope, so we decided to add more color.

IMG_9119

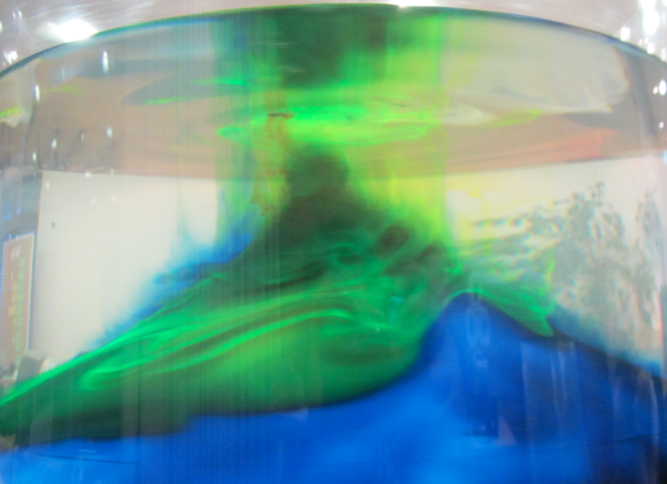
Still only one column on top of the cone

Nice to see that, for a change, we calculated all the parameters correctly! But then The Boss himself had done the calculations this time round…

IMG_9120

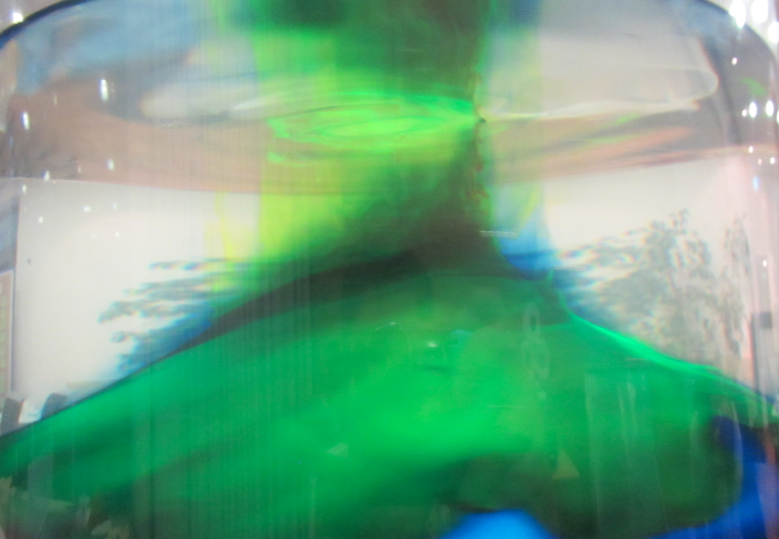
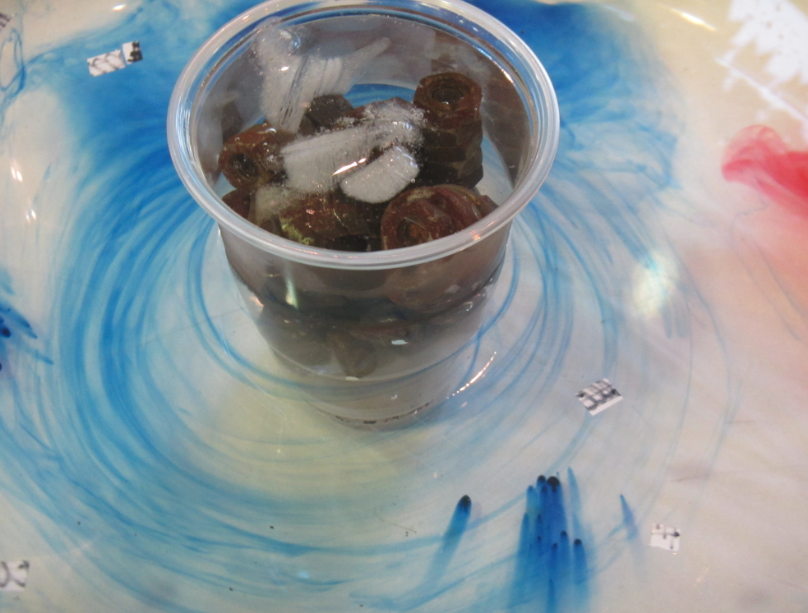
The column creeping back up the slope during spin-down

But the most fascinating thing happened during spin-down when we had stopped the tank: The column slowly withdrew up the slope again! Our two fascinated students were absolutely wowed (and that’s saying something – they were really impressed with the salt fingers earlier already).

Watch the movie below for some impressions of the experiment.
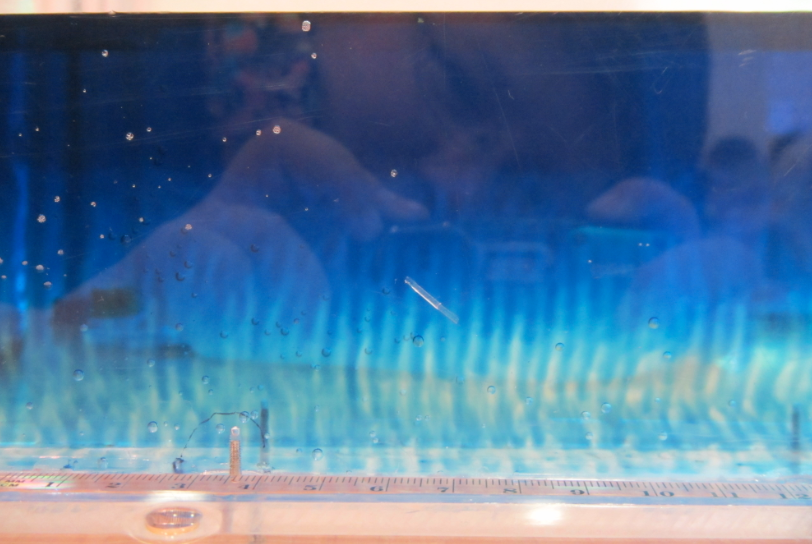
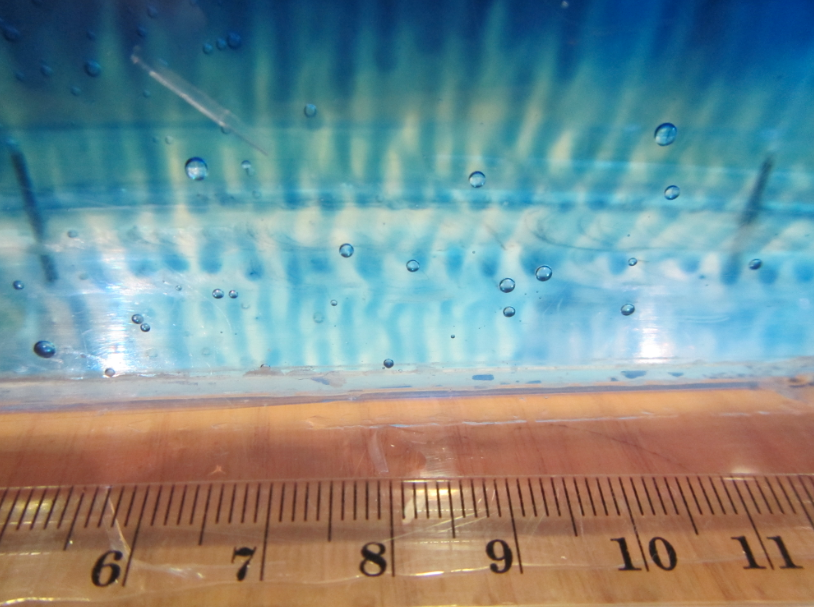
Salt fingering

My absolute favorite experiment ever: salt fingering.

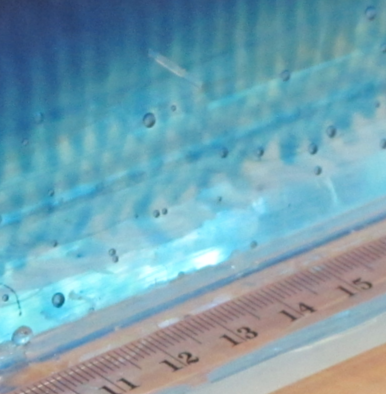
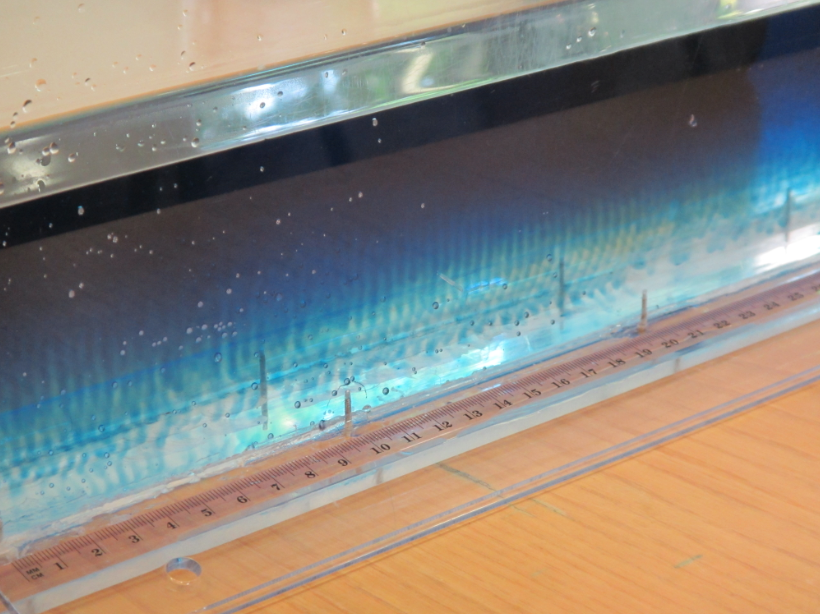
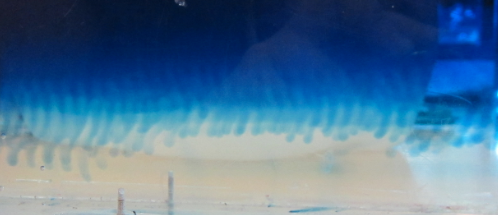
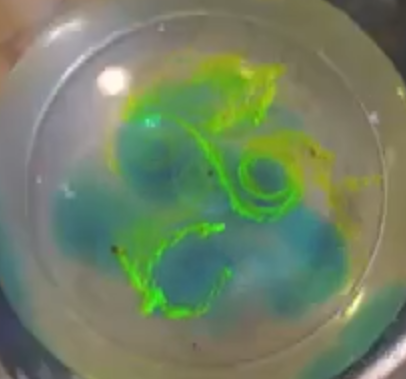
I know I’ve said it before about another experiment, even today, but this is my absolute favorite experiment and I still get endlessly fascinated. I’ve written about salt fingering before, and given tips on run the experiment, but today we tried a different setup.

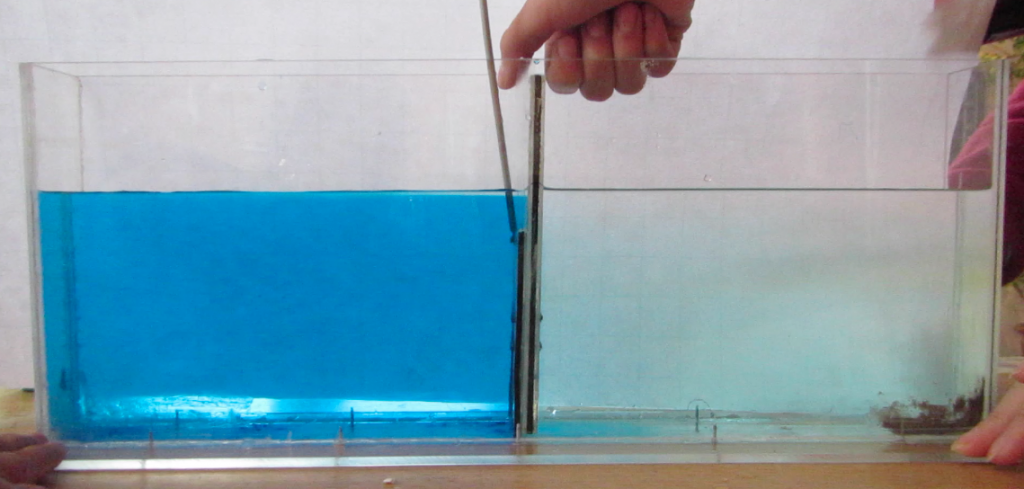
We used the same tank as in the “influence of salinity and temperature on density“, put warm, dyed water on the one side of the dam and cold fresh water on the other side.

Contrary to Rolf’s advice, we didn’t aim for specific temperatures and salinities to hit the density ratio in a specific way, but just went for really hot and really cold.

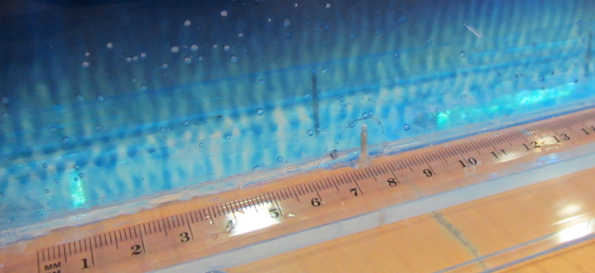
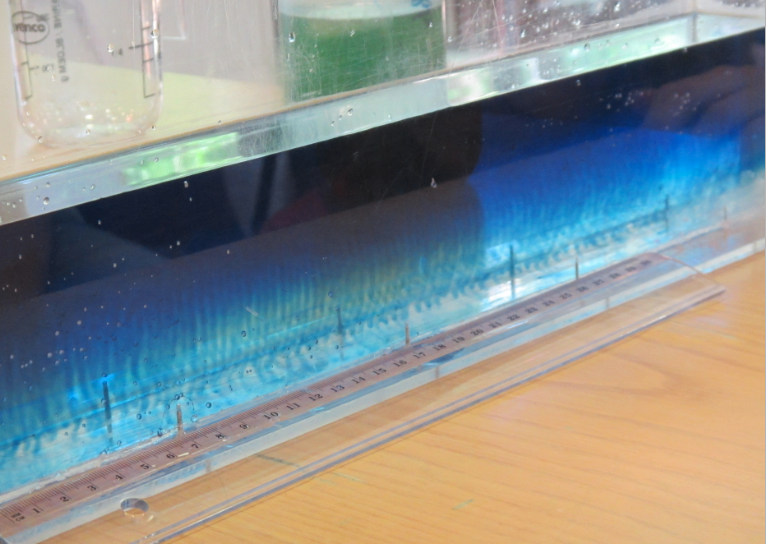
We pulled the parting out, and after a couple of minutes, salt fingers started to develop.

Unfortunately, they are really difficult to take pictures of.

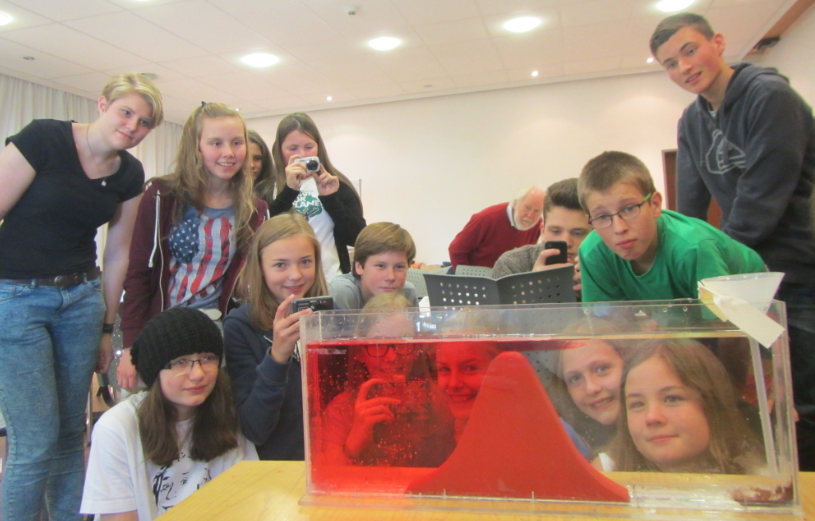
But a lot of students watched and will hopefully remember what they saw.

And even if not – I thought it was awesome and Rolf said they were the best salt fingers he had seen yet – even though we just winged it ;-)

Hetonic explosion

Trying to tweak conditions to force a set number of vortices.

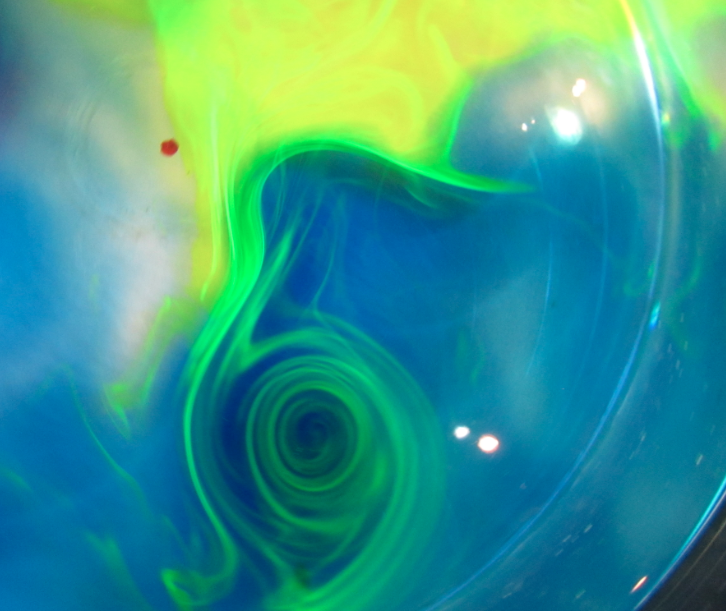
We’ve done the hetonic explosion again. This time the group was super careful to calculate the Rossby radius correctly, and then to set up the experiment accordingly. We aimed for a single column like in our tilting of a frontal surface under rotation experiment.

We did manage to create one main vortex, but we saw at least two additional smaller vortices. And since we know how vortices are created, it is pretty likely that there were four in total.

But never mind, it is still a very nice experiment that we are happy to do over and over again!

Movies will come up once I have time to actually write the posts – we do have numerical simulations that we want to compare our experiments with. Stay tuned!

Thermally driven circulation

One of my all-time favorite experiments.

The salt group got a bit bored from watching ice cubes melt, so I suggested they look at temperature differences for a change, and they ran the “leaking bottles” experiment.

MVI_8938

Thermally-driven circulation.

Watch a movie combining their four different setups below!

Hadley cell circulation – slow rotation

In order to not be in the eddying regime, this time we are rotating our tank as slowly as possible.

Since we ran the Hadley cell experiment the other day, I’ve been obsessed with running it again, this time with the slowest rotation possible in order to visualize a different flow regime – one were the heat transport happens through an overturning circulation rather than through eddies.

Unfortunately the camera we had mounted above the tank only started up halfway through the experiment (no idea how that happened!), so today you’ll only get snippets of this experiment. But all the more reason for us to run it again soon!

And I promise you’ll get a discussion of the differences between this and the Hadley cell experiment with the higher rotation rate soon. I just don’t have the time or mental space to write more than a couple of incoherent sentences while I’m still at the JuniorAkademie

Hadley cell experiment

Cooling and rotation combined. (deutscher Text unten)

I can’t believe I haven’t blogged about this experiment before now! Pierre and I have conducted it a number of times, but somehow the documentation never happened. So here we go today! Martin and I ran the experiment for our own entertainment (oh the peace and quiet in the lab!) while the kids were watching a movie. But now that we’ve worked out some of the things to avoid (for example too much dye!), we’ll show it to them soon.

This is a classical experiment on general atmospheric circulation, well documented for example in the Weather in a Tank lab guide. The movie below shows the whole experiments, though some parts are shown as time lapse.

Für unsere eigene Unterhaltung haben Martin und ich dieses Experiment gemacht, während die Kinder mit allen Gruppen gemeinsam einen Film gesehen haben. Himmlische Ruhe im Labor! Aber wir werden es bald auch der Gruppe vorführen.

Dieses klassische Experiment zeigt, wie die großskalige atmosphärische Zirkulation in der Hadley-Zelle angetrieben wird und ich weiß auch schon, wie wir es beim nächsten Mal noch eindrucksvoller hinbekommen als bei diesem Mal!

Hetonic explosion

Or, an experiment on this blog often known as “slumping column”. (deutscher Text unten)

If you don’t scale your tilting of frontal surfaces under rotation experiment correctly, you get a phenomenon called “hetonic explosion”: the formation of a cloud of baroclinic point vortices. From the densities, the rotation rate, the dimensions etc you can calculate the Rossby radius and determine how many eddies you will generate. In our case, though, the calculation went wrong by a factor 10 (9.81, to be precise) and what we ended up getting is shown below.

Watch the movie below for the whole experiment (though most of it in time lapse).

Heute haben wir ein sehr spannendes Experiment gemacht. In einem Drehtank hatten wir in der Mitte einen Zylinder mit gefärbten Salzwasser und außen herum klarer Süßwasser ins Gleichgewicht gedreht. Dann wurde der Zylinder entfernt und die Säule blauen Wassers musste ein neues Gleichgewicht finden.

Im Film oben zeigen wir das Experiment – zum Teil allerdings im Zeitraffer. Viel Spaß!

Forced internal waves in a continuous stratification

Plus all kinds of dyes. (deutscher Text unten)

Using the continuous salinity stratification created yesterday, Rolf and Daniel conducted a really cool experiment: They forced internal waves and watched them develop. I’ve converted their movie into a time-lapse; watch it below.

Mit der kontinuierlichen Salzschichtung, die Daniel und Rolf gestern gebastelt haben, haben sie danach noch weiter experimentiert. Sie haben einen durch einen kleinen Motor angetriebenen Stempel in die Schichtung eingeführt und auf und ab bewegt. Das Wellenfeld, das sich dadurch entwickelt hat, sieht man im Film oben im Zeitraffer (einige kurze Abschnitte zwischendurch zeigen auch Echtzeit). Farbkristalle, die nachträglich hinzugefügt wurden, helfen, die Strömungen zu visualisieren.

Creating a continuous stratification.

And watching internal waves – a data-model comparison. (deutscher Text unten)

In an experiment similar to the one done by the group looking at the effects of temperature and salinity on density, the wave group, supported by Rolf, started looking at how to create a continuous stratification through internal wave action. Two water masses, one saline and one fresh, were separated in a tank. When the separation was removed, an internal wave developed.

Salinity and tank dimensions were recreated similarly in the tank and in a model, and you can watch the comparison below. Impressive, isn’t it?

Mit der Unterstützung von Rolf hat die Wellengruppe angefangen zu untersuchen, wie eine kontinuierliche Salzschichtung durch Vermischung durch interne Wellen erstellt werden kann. Genau die gleichen Bedingungen wie im Tank (Dimensionen und Salzgehalt) hat Rolf auch in seinem Modell losgelassen und hier ist die Simulation zum Vergleich. Eindrucksvoll wie ähnlich sich die Natur und die Modelllösung sind, oder?