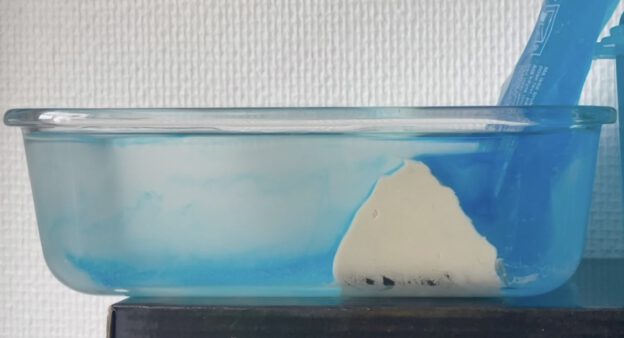
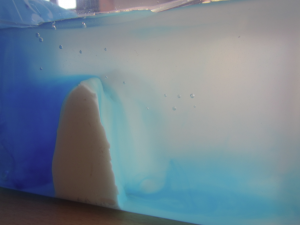
Since our Denmark Strait tank experiment from 2013 (see here in a post from 2014!) is still the one I refer to when I want to point to pictures of such an overflow experiment, I decided to do the experiment again to take new (and hopefully better) pictures. Three experiments later, I am not sure if the pictures are any better, but I tried…
Because sometimes one overflow simply isn’t enough.
Finn’s group came up with – and ran – an overflow experiment with many different densities and even more colors. While the movie didn’t turn out too well, the idea was pretty awesome.
Rolf went ahead and modeled the experiment right away. And because the plume didn’t go across the second ridge in a dramatic enough fashion, he did the same experiment again, this time with a higher density contrast.
Salinity – the higher, the redder, the lower, the bluer. Density higher than in the figure above. Figure courtesy of Rolf Käse
If you compare those two figures, you notice that the second one is a lot more diffusive than the first one. To test whether the model was doing well, we obviously had to run both experiments in the tank, too. Watch the movie below to see how they turned out:
Turns out that also for us, the run with the higher density contrast is a lot more diffusive. Kelvin-Helmholtz-instabilities develop on the first down slope of the first ridge, and generally a lot more mixing is going on. To get an impression of the regions of high mixing and recirculation, rather than guessing from the diffusing salinities, Rolf displayed the horizontal velocity:
Along-tank velocity. Blue to the left, red to the right. Figure courtesy of Rolf Käse.
Notice the high mixing whenever the plume is running down a slope, and then the recirculations in the valleys. Pretty awesome, huh?
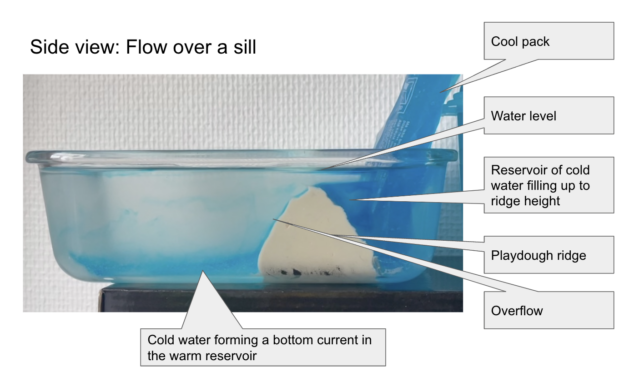
Ha, this is a bad pun. We are modeling the Denmark Strait Overflow – but in a non-numerical, small-scale-and-playdough kind of way.
More than a year ago, Kjetil and I ran that experiment with a group of high-school students and when writing a post about a much more sophisticated version of this experiment I realized I never documented this one in the first place. So here we go!
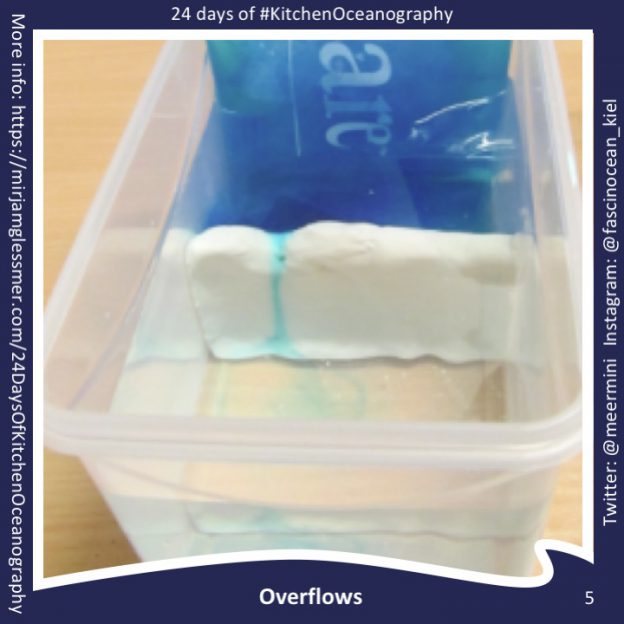
The set-up: Tupper ware with a modeling clay ridge (“let’s call it Greenland-Scotland-Ridge”) across, filled with water to a level above the ridge, cooled with a sport’s-injury cooling pack in “the North”.
Dye is added to the “northern end” of the tank (i.e. the end where the water is being cooled by a sport’s injury cooling pack). As the water cools, it becomes denser and fills up the reservoir on the northern end until it spills over the clay ridge.
The overflow. See the blue, dense reservoir on the left and the dense water spilling over the ridge.
This is a very simple demonstration of how overflows actually work.
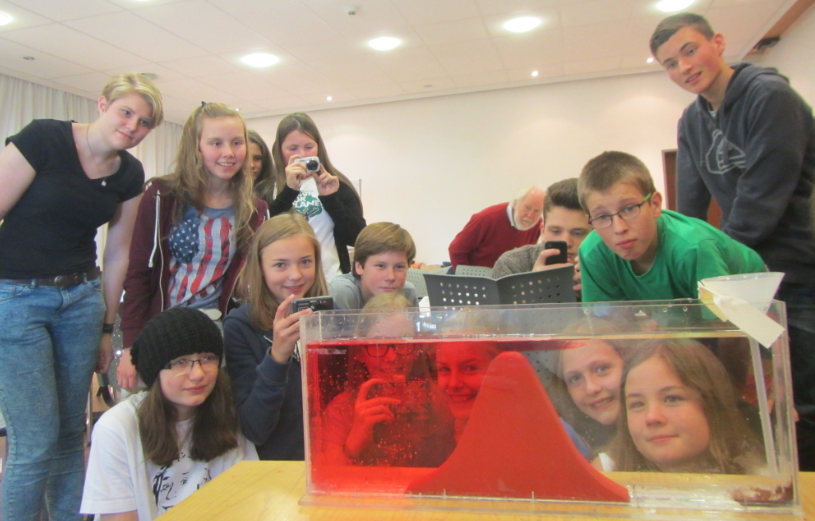
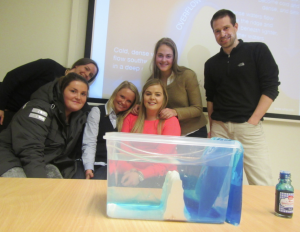
Kjetil, his Master student Eli and some of the high-school students. Can you see the sketch of the Denmark Strait Overflow on the slide in the background? (Plus, for everybody who is interested: This is the food coloring I have been using right there in the front right!)