#TeachingTuesday: Some things I read about making good lecture videos

Just imagine you had written an article on “Student Satisfaction and Learning Outcomes in Asynchronous Online Lecture Videos”, like Choe et al. (2019) did. What excellent timing to inform teaching decisions all around the world!

Choe et al. compare 8 different video styles (all of which can be watched as supplementary material to the article which is really helpful!), 6 to replace “normal lectures” and two that complement them, to investigate the influence of video style on both how much students are learning from each, and how they feel watching them.

The “normal lecure” videos were different combinations of the lecturer and information on slides/blackboards/tablets/…: a “classic classroom” where the lecturer is filmed in front of a blackboard and a screen, a “weatherman” style in front of a green screen on which the lecture slides are later imposed, a “learning glass” where the lecturer is seen writing on a board, a “pen tablet” where the lecturer can draw on the slides, a “talking head” where the lecturer is superimposed on the slides in a little window, and “slides on/off” where the video switches between showing slides or the lecturer.

And the good news: Turns out that the style you choose for your recorded video lecture doesn’t really affect student learning outcomes very much. Choe et al. did, however, deduce strengths and weaknesses of each of the lecture formats, and from that come up with a list of best practices for student engagement, which I find very helpful. Therein, they give tips for different stages of the video production, related to the roles (lecturer and director of the video), and content covered in the videos, and these are really down-to-earth, practical tips like “cooler temperatures improve speaker comfort”.  And of course all the things like “not too much text on slides” and “readable font” are mentioned, too; always a good reminder!

One thing they point out that I wasn’t so clear to me before is that it’s important that the lecturer is visible and that they maintain eye contact with the camera. Of course that adds a layer of difficulty to recording lectures — and a lot of awkward feelings and extra work in terms of what to wear and actually having to shower and stuff — but in the big scheme of things if it creates a better user experience, maybe it’s not such a big sacrifice. Going forward, I’ll definitely keep that in mind!

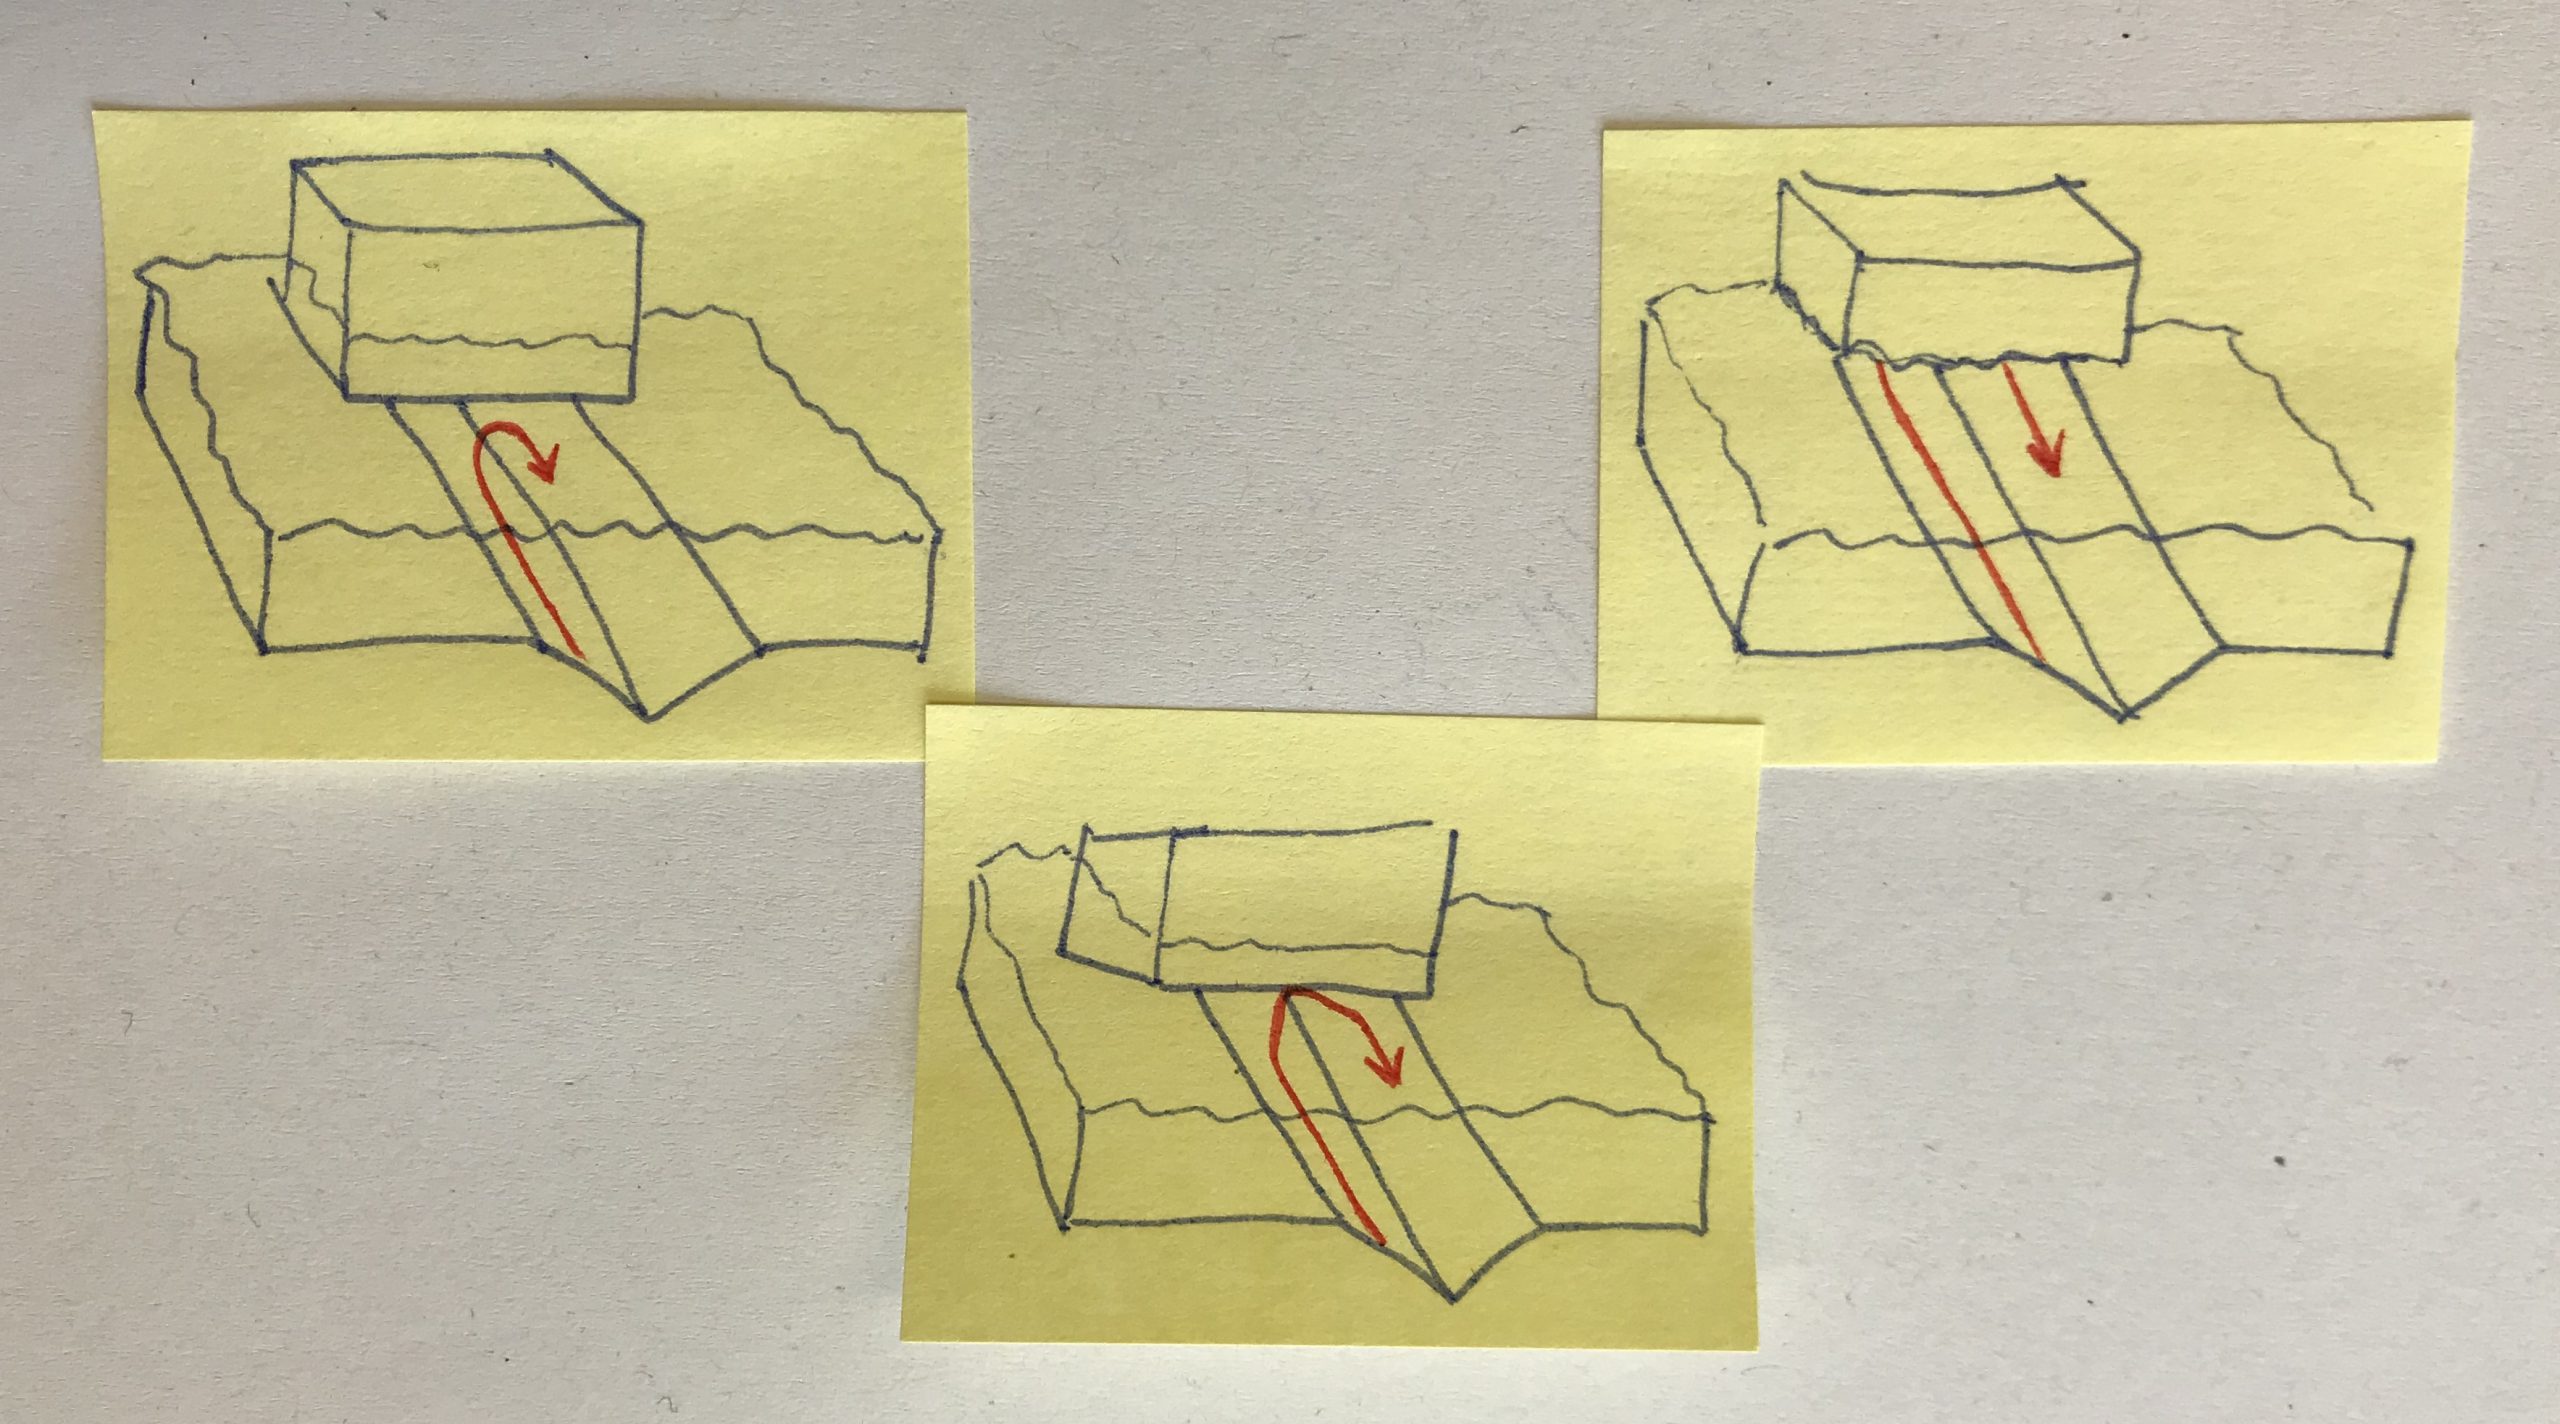
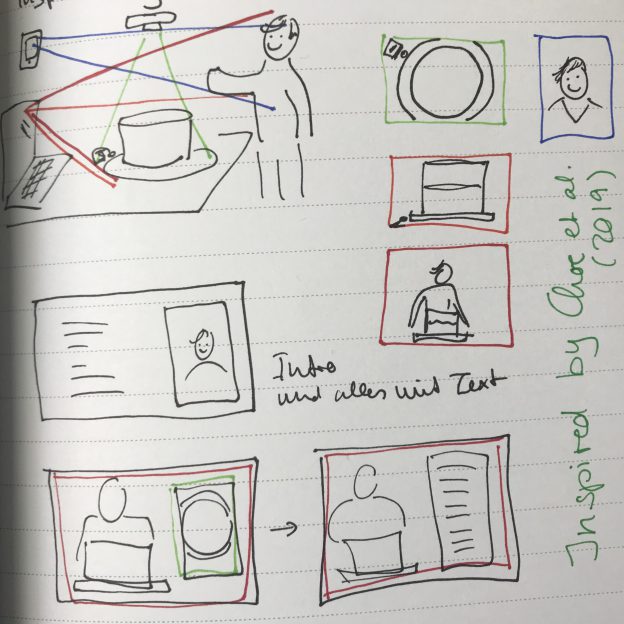
Especially making the distinction between the roles of “lecturer” and “director” was a really helpful way for me to think about making videos, even though I am playing both roles myself. But it reminds me of how many considerations (should) go into a video besides “just” giving the lecture! If you look at the picture above, you’ll see that I’ve started sketching out what I want to be able to show on a future video, and what that means for how many cameras I need, where to place them, and how to orient them (portrait or landscape). When I made the (german) instructions for kitchen oceanography, I filmed myself in portrait mode, thinking of posting them to my Instagram stories, but then ended up editing a landscape video for which I then needed to fill all the awkward space around the portrait movie. Would have been helpful to think about it in these terms before!

Choe et al. even include a “best practice” video in their supplementary material, which I find super helpful. Because even though in some cases it might be feasible to professionally produce lectures in a studio, but that’s not what I (or most people frantically producing video lectures) these days have access to. So seeing something that is professionally produced but that doesn’t (seem) to require incredibly complicated technology or fancy editing is reassuring. In fact, even though the lecturer appears to have been filmed in front of a green screen, I think in the end it’s not too unsimilar to what I did in the (german) instructions for kitchen oceanography mentioned above: A lecturer on one side, the slides (in a portrait format) on the other.

In addition to the six “lecture” videos, there was a “demo” video where the lecturer showed a simple demonstration, and an “interview” video, where the lecturer was answering questions that were shown on a screen (so no second person there). Those obviously can’t replace a traditional lecture, but can be very useful for specific learning outcomes!

The “demo” type video is the one I am currently most interested in, since that’s where I can best contribute my expertise in a niche where other people appreciate getting some input. Also, according to Choe at al., students found that type of video engaging, entertaining, and of high learning value. All the more reason for me to do a couple more demo videos over the next couple of days, I’m already on it!
References:

Ronny C. Choe, Zorica Scuric, Ethan Eshkol, Sean Cruser, Ava Arndt, Robert Cox, Shannon P. Toma, Casey Shapiro, Marc Levis-Fitzgerald, Greg Barnes, and H. Crosbie (2019). “Student Satisfaction and Learning Outcomes in Asynchronous Online Lecture Videos”, CBE—Life Sciences Education, Vol. 18, No. 4. Published Online: 1 Nov 2019
https://doi.org/10.1187/cbe.18-08-0171
Such a pretty #friendlywaves!

My long time Twitter friend Anne shared these beautiful pictures and I absolutely had to do a #friendlywaves post where I explain other people’s wave pictures.

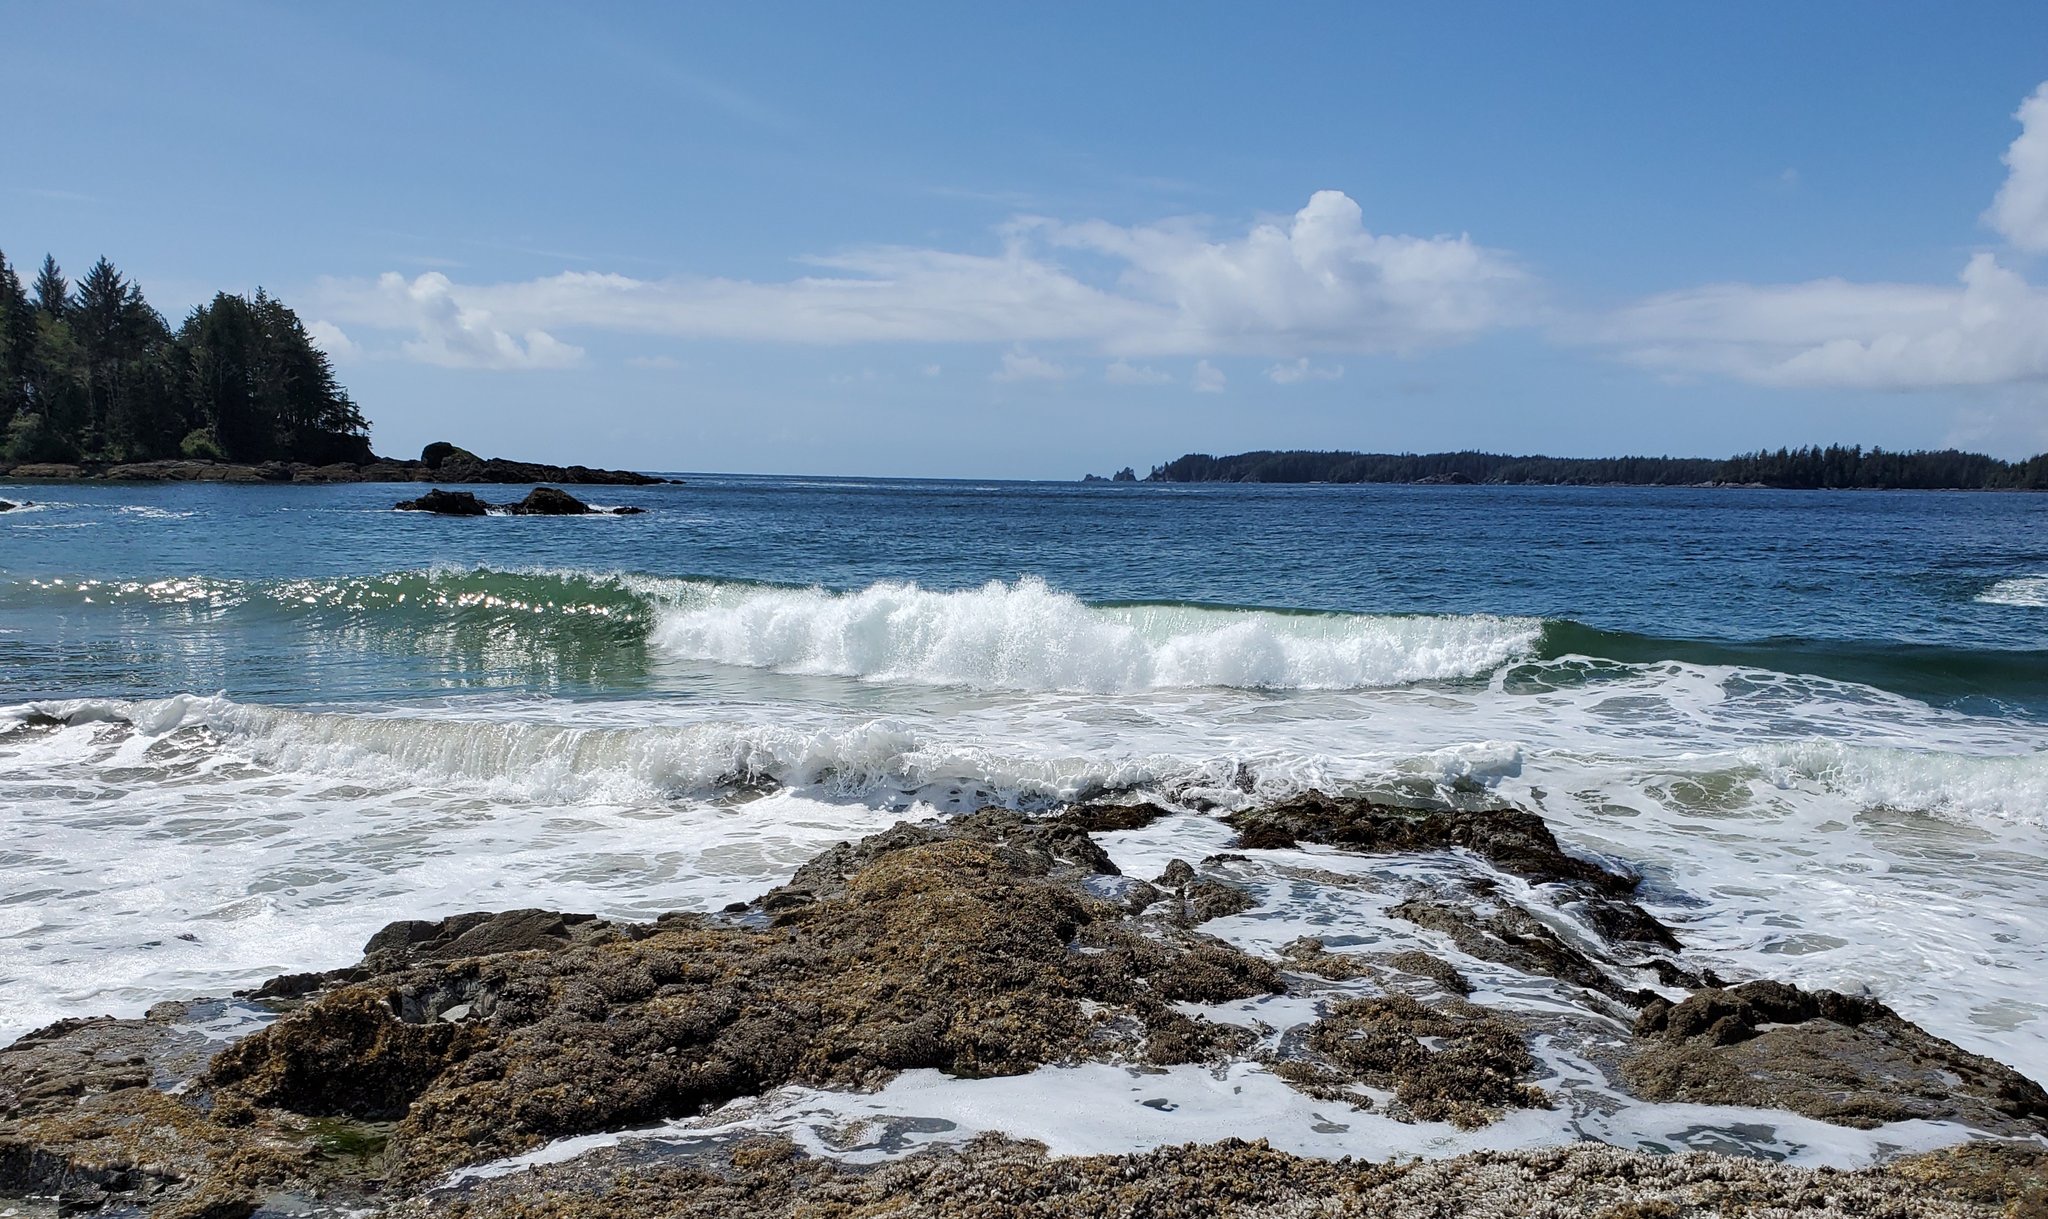
Take a moment to admire the beautiful picture below. Wouldn’t you love to be there? I certainly would!

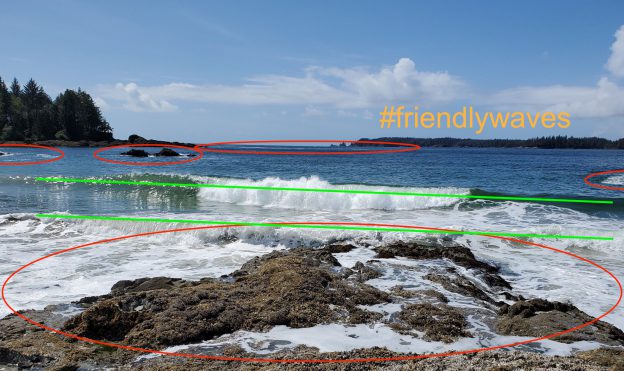
What can we learn from this picture? First — it’s a windy day! Not stormy, but definitely not calm, either. See how the water outside of the surf zone is dark blue and looks a little choppy? That’s the local wind doing that.

And then there are the waves that we see breaking in the foreground. Without knowing where the picture was taken, I would think that they traveled in from a large water body where there was a long fetch so they could built up over quite some distance. And then they meet the coast!

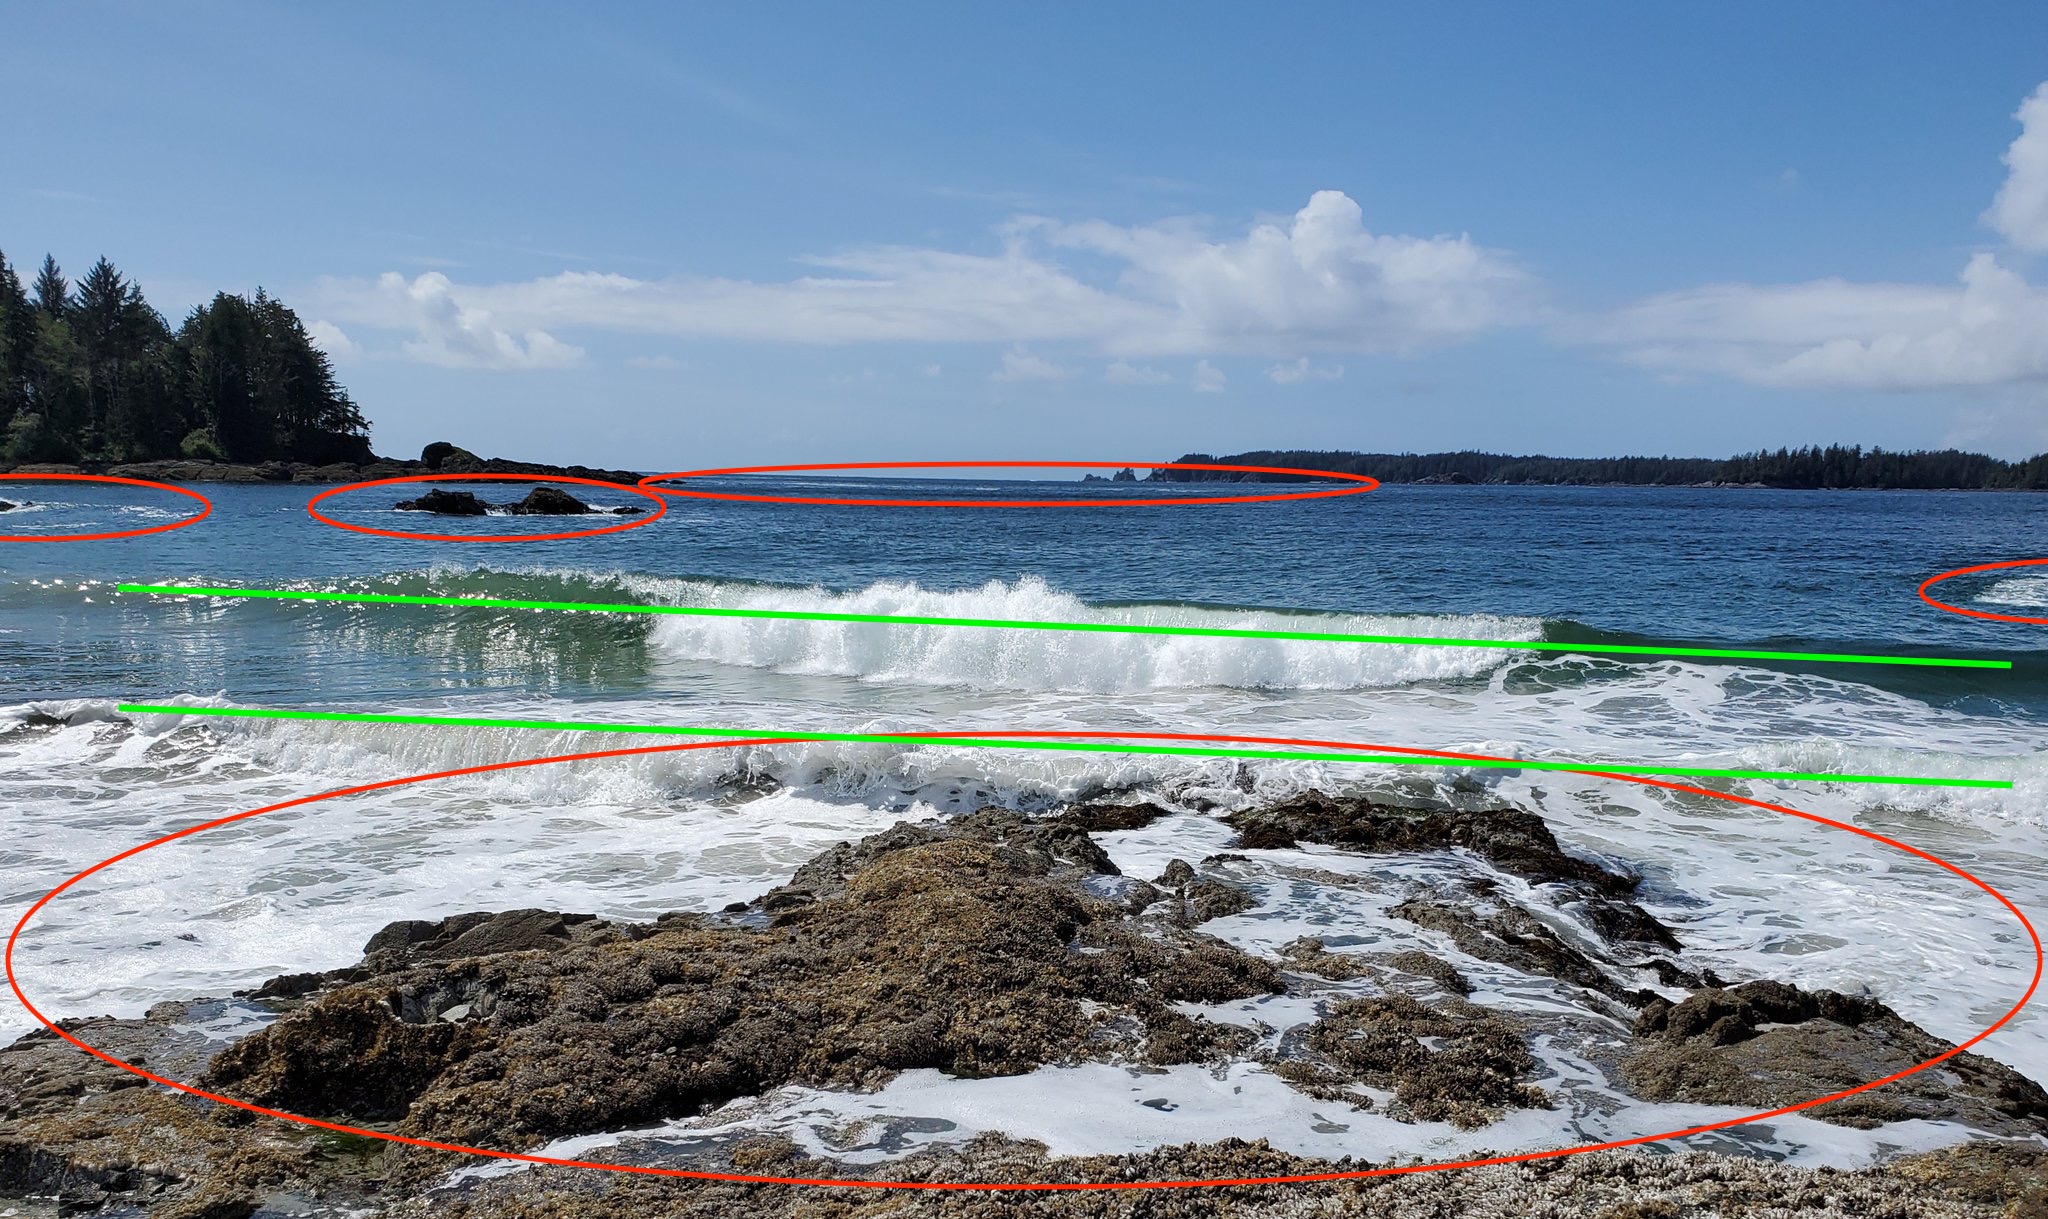
You see breaking waves of two kinds: the one marked with red ovals below, where there is hardly any buildup of the wave before it meets a rock and breaks into white, foamy turbulence. The other type of breaking waves, the ones where I marked the crests with green lines, build up over a short distance before they break because there is a more gradual decrease in water depth. The stope is still quite steep so the waves change from deep water (where they can’t feel the sea floor and have a fairly low amplitude, so we can’t distinguish wave crests further offshore than the two I marked in green) to shallow water waves that feel the sea floor and build up to break.

In contrast, let’s look at the lovely picture below.

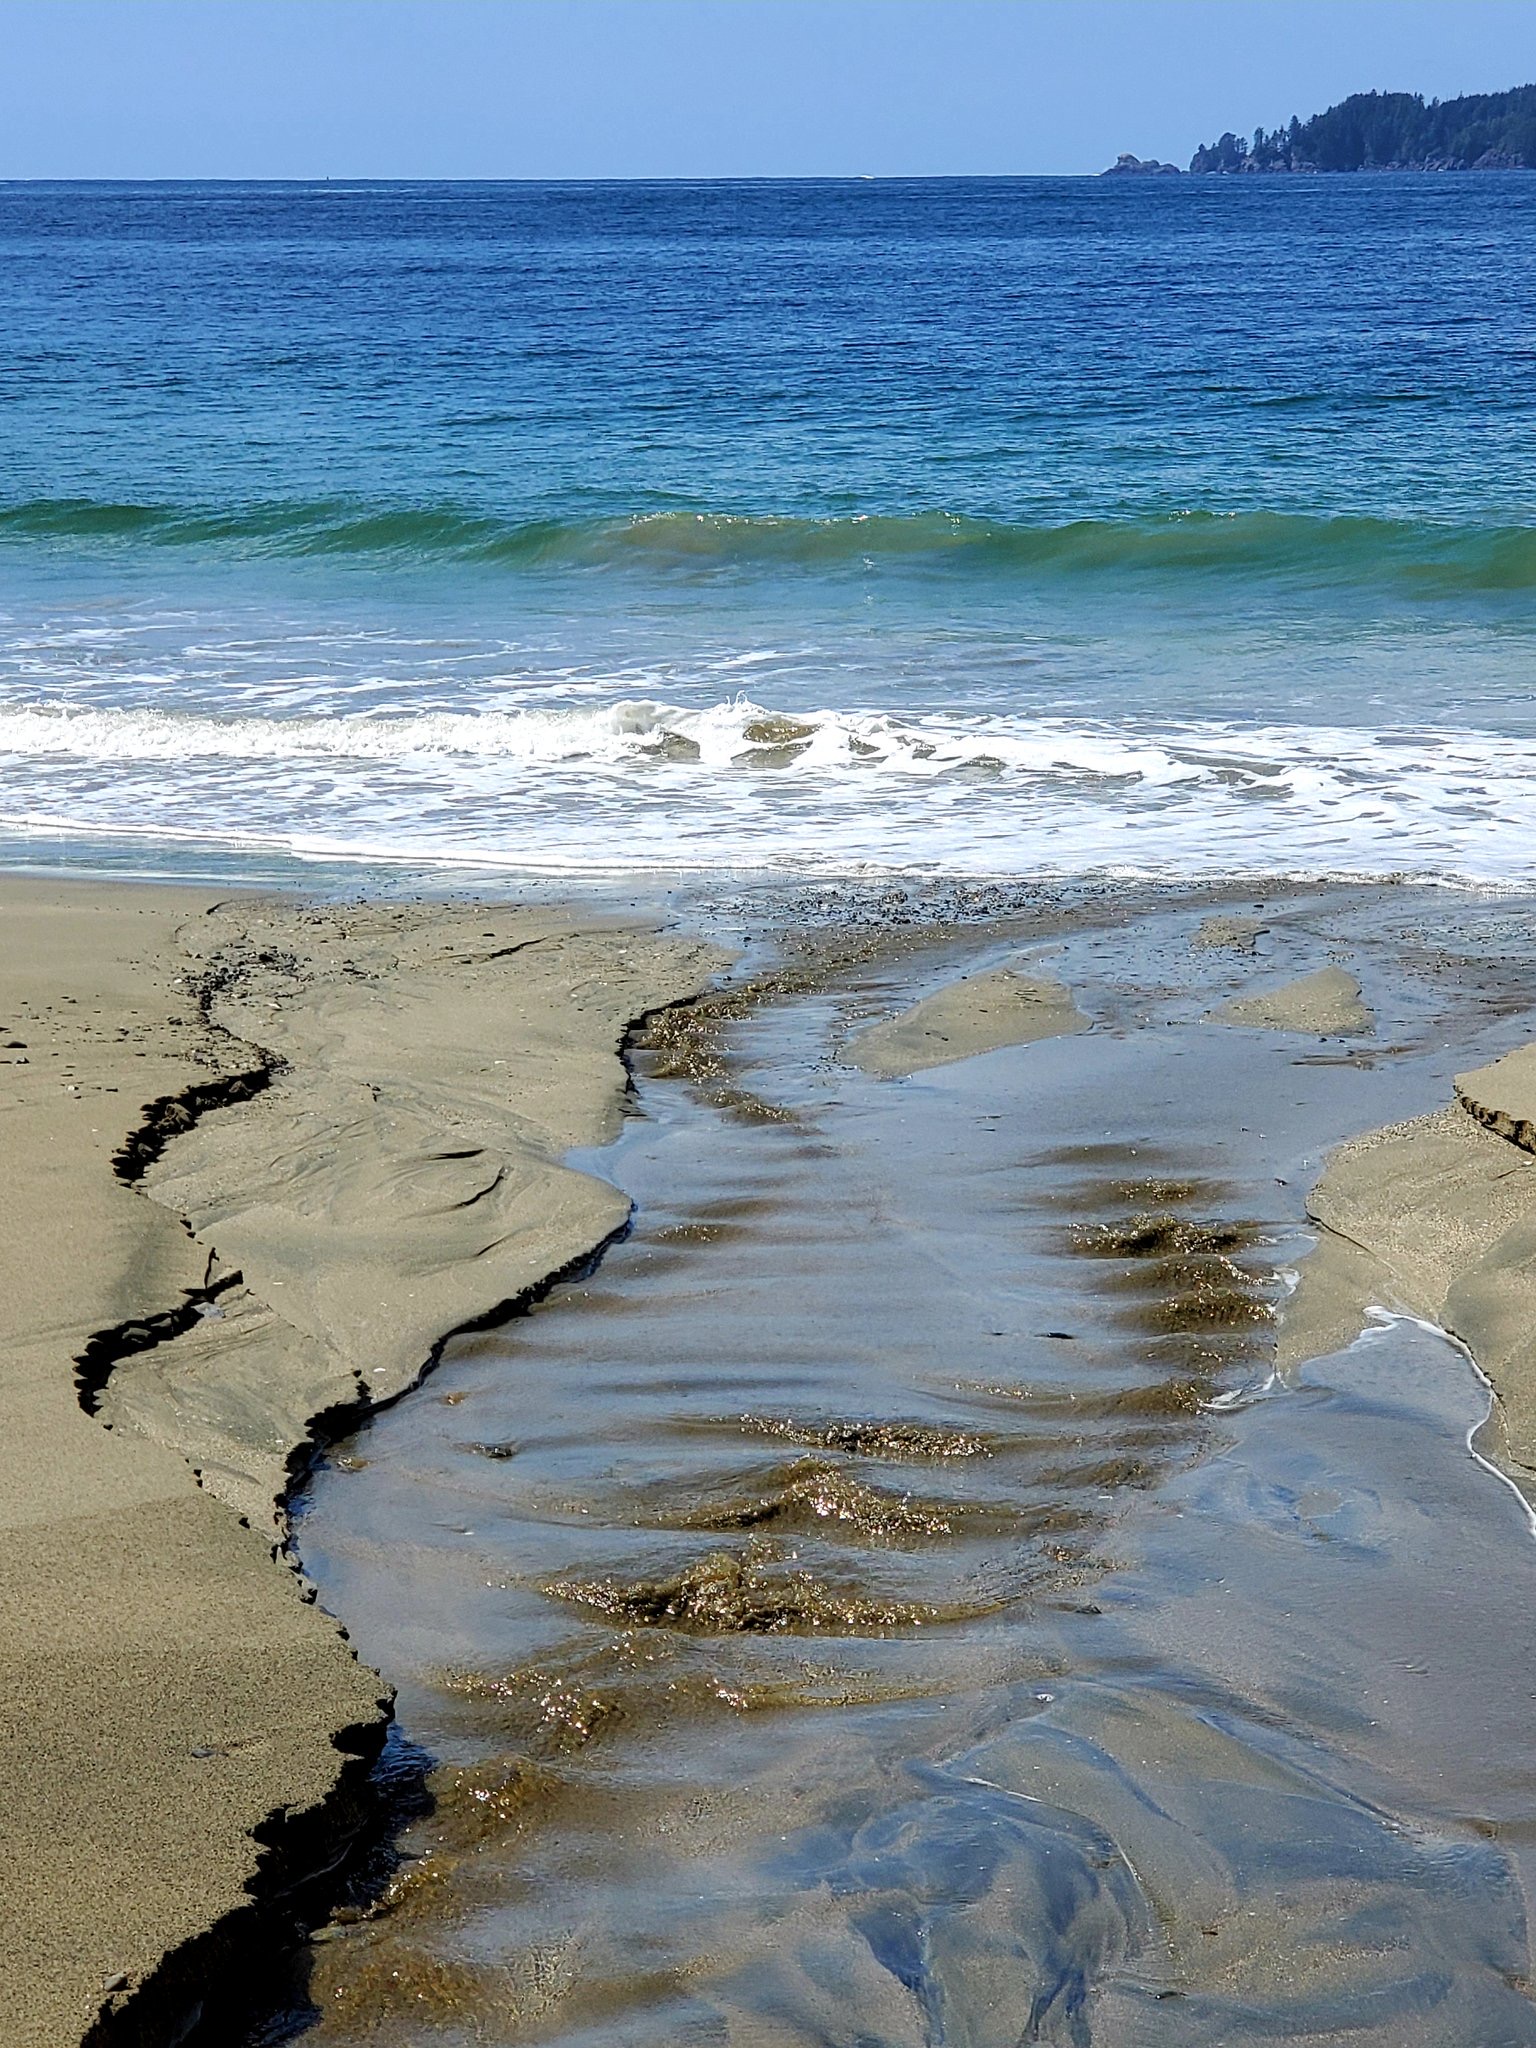
Here, we have a sandy beach on which the waves can run out. There slope right at the water’s edge is not very steep, but seeing that we can only really spot two wave crests there has to be a change in gradient. About where the offshore wave crest is in the picture below, or possibly a little further offshore, the water depth must suddenly increase, otherwise there would be more wave crest visible further offshore. Since there aren’t any, water must be a lot deeper there.

But what I found really cool about the picture above are the trains of standing waves in the little stream that flows into the sea here. I find it so fascinating to see standing waves break in the upstream direction — so completely unintuitive, isn’t it? So much so that I dug out some pics from January for you and posted them last Friday in preparation for today’s post. Sometimes I actually plan my posts, believe it or not!

Standing waves don’t move in space because the flow of the current they are sitting on is exactly as fast as they are moving, only in the opposite direction. What is happening in the picture is that in those standing waves sit on ripples in the sand. The waves become so steep that they are constantly falling back down onto the current, get carried up the ripples again, in an endless loop. So fascinating!

March’s #SciCommChall: My personal branding statement

For March’s #SciCommChall, Alice gave us a super cool challenge with really helpful instructions to come up with our own “personal branding statements”. And here I am following her instructions and coming up with my own personal branding statement. A little late, but better late than never…

1. Write down three words you’d use to describe yourself. Take your time and be honest.

So after a lot of contemplation, I think my three words are enthusiastic, curious, and driven.

Curious: I get very easily fascinated by all kinds of different stuff, and I am always interested in exploring new things, learning new skills, visiting new places.

Enthusiastic: As I said, I get very easily fascinated by stuff. And then enthusiastic about it, or you might say obsessed. See evidence of that in my wave watching posts.

Driven: What I mean by that is that once I decide I want something, I am super stubborn and will work hard to get it. For example, once I had decided that my goddaughter was going to get a wave watching book for her christening, I made it happen. Another word to describe that side of me might be pigheaded ;-)

2. Find someone you trust (your partner or a friend) and ask them to describe you in three words. Compare the lists and see what they have in common.

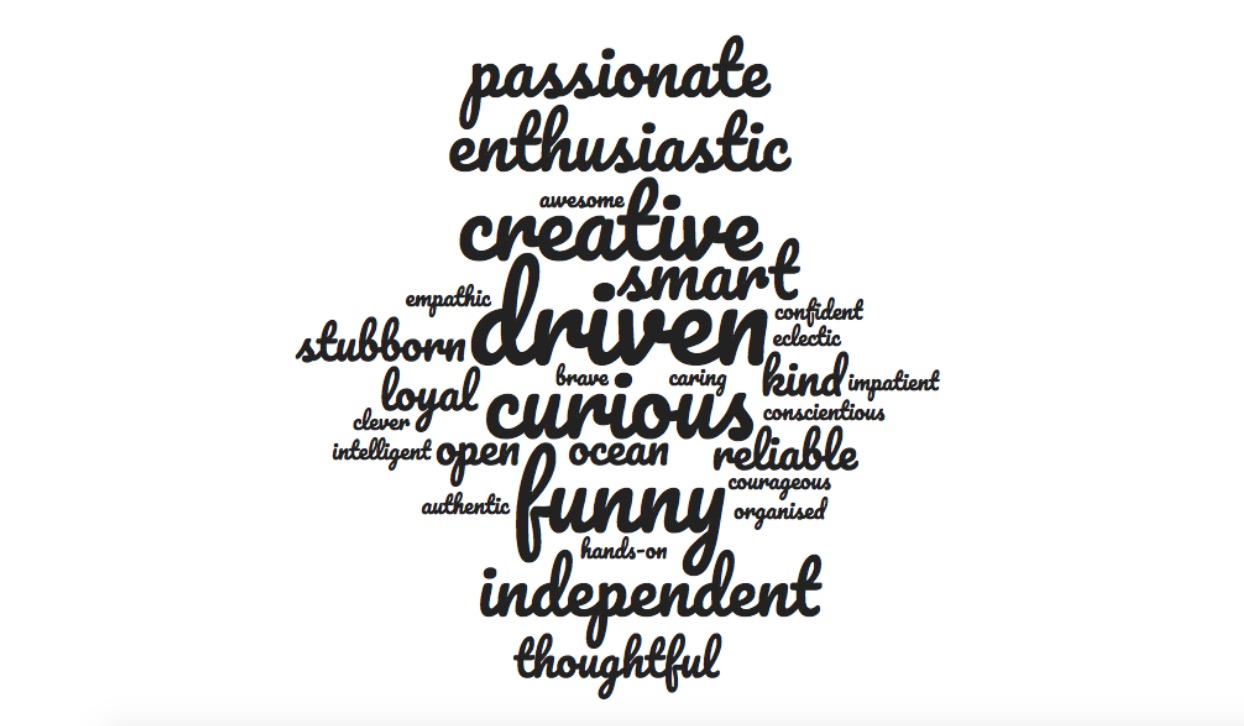
For N=27, this is how my friends describe me (font size proportional to how often a word was mentioned. More or less, at least, since I got answers in English, German, and Norwegian and translated them all to English to be able to cluster them…).

I love how curious and driven are also how my friends see me, along with creative, passionate, enthusiastic and funny! And stubborn ;-)

3. List your core competencies. What are your unique skills and talents that are valuable to others? What accomplishments and experiences define you? Include awards, degrees, and promotions.

Elaborating on this is kinda boring in a blog post. Check out my CV if you are interested in the formal stuff…

But I think what I am really good at is sharing my excitement for topics or causes and getting other people interested in them and excited about them, too. I’m also really good at building networks because I’m not afraid to cold-contact people or to follow up with people I’ve met. I remember people’s interests & projects and am very good at connecting people that should meet.

4. List your goals. What do you want to accomplish this year, this decade?

This year as well as this decade: Sharing my fascination with the ocean!

This year is all about bringing ocean experiences to people that either can’t travel to the ocean, or that can travel but can’t meet up with people to learn from them. I’ve already been doing that by creating a 1-day kitchen oceanography course for kids (in german) or by writing up examples of how to do field courses without having student groups in the field. But there is more in the pipeline already, like an article I contributed to in a popular science magazine, and I have even more things planned. The main thing I want to work on over the next couple of days is to create videos of experiments using the DIYnamics setup because we would be using them with students right now if it was possible, and I have one at home! And I am hoping that those videos can be integrated in such a way that students watch them in preparation for a video call with me, where they can “remotely control” me doing the same experiment again, except modified in whatever way they’d like. What do you think, good idea?

Building on those ideas, my long term goal is to live in a lighthouse, overlooking the ocean. Sometimes I’ll open my home for workshops on ocean topics (for example on kitchen oceanography or wave watching, but also on how to communicate about ocean and climate topics, and many others), other days I’ll observe the ocean by myself or with select, few people, and communicate about that via my blog, maybe livestreams, maybe new technologies that’ll exist by then. Doing this kind of work — building a community around ocean exploration and understanding — is really what makes me extremely happy and I don’t see myself ever not wanting to do this any more.

5. Write out your (core) values.

My core values. Such a difficult question. It is very important to me that I can be my authentic self when it comes to my work and beyond: following my curiosity and sharing things that bring me joy are essential to me, as is building community and being in constant discussion with like-minded people and those that give me new perspective on things. Also experimenting with new topics or skills, being creative, having control over what I work on and how & when I do it. It is also very important to me that even though I love working a lot and traveling for long periods for work, this has to be in balance with time with family and friends (luckily there are so many of my friends that I work with, so traveling to work with them is a win-win!).

6. Create your own personal branding statement. This is a two-sentence description of who you are and what you can contribute. Don’t rush it, composing this statement is not an easy thing to do. Once you’re satisfied, stick it somewhere you’ll see it every day. It’s good affirmation.

Funnily enough this came out very similar to previous “about me” statements I had written for resumés and other such occasions:

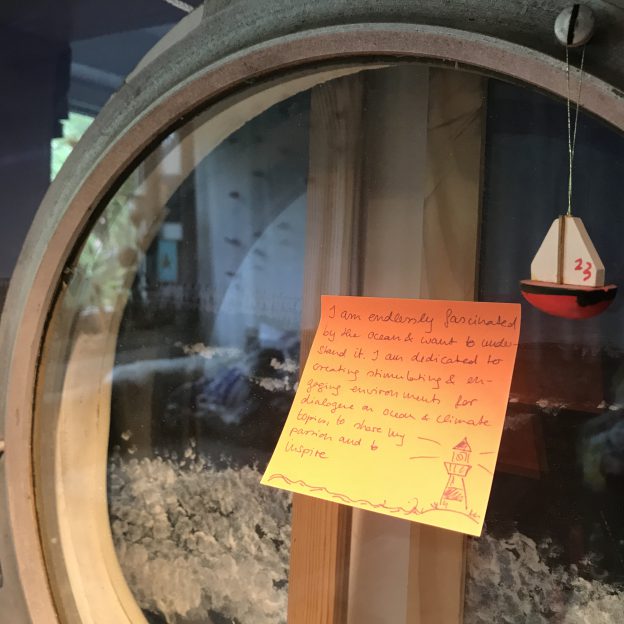
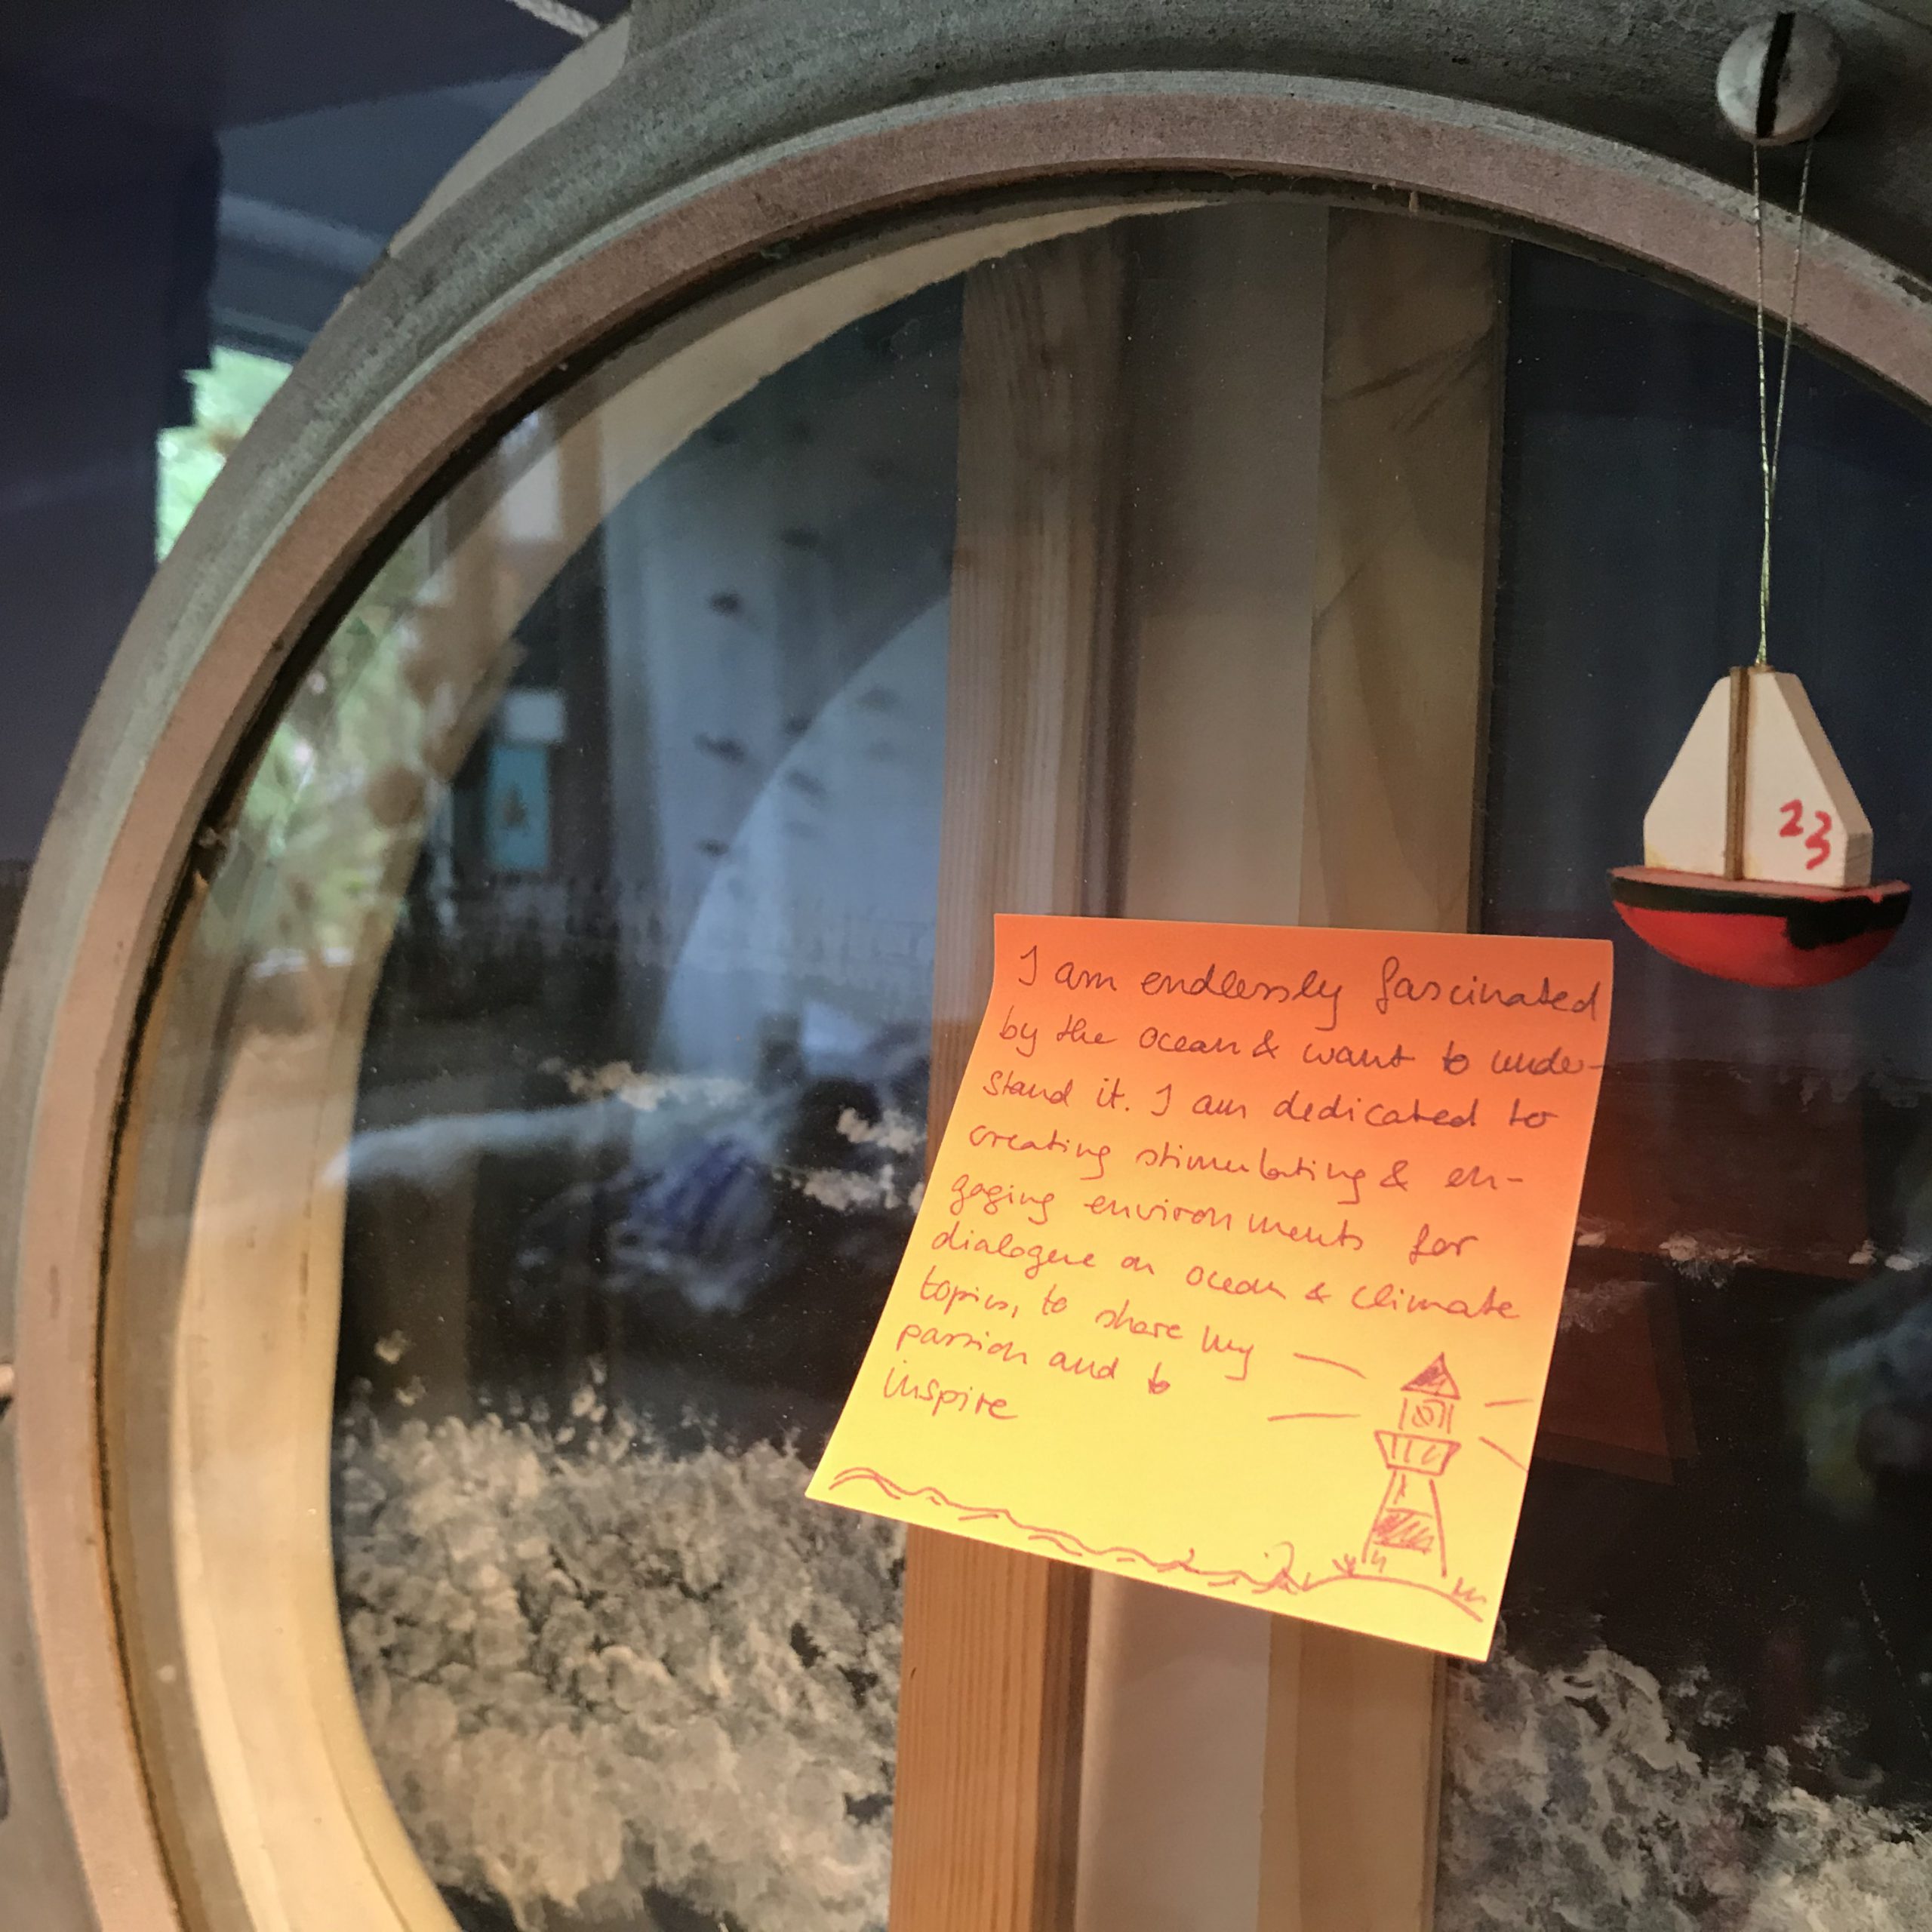
“I am endlessly fascinated by the ocean and want to experience and understand it. I am dedicated to creating stimulating and engaging environments for dialogue on ocean and climate topics to share my passion, and to insprire”

I put it up on my porthole which is right next to my current work desk at home / my sewing and other handcrafts table / my dining table (actually, only table in my home). And I like it! Thanks for the idea, Alice! :-)

Birds make for super interesting wave watching!

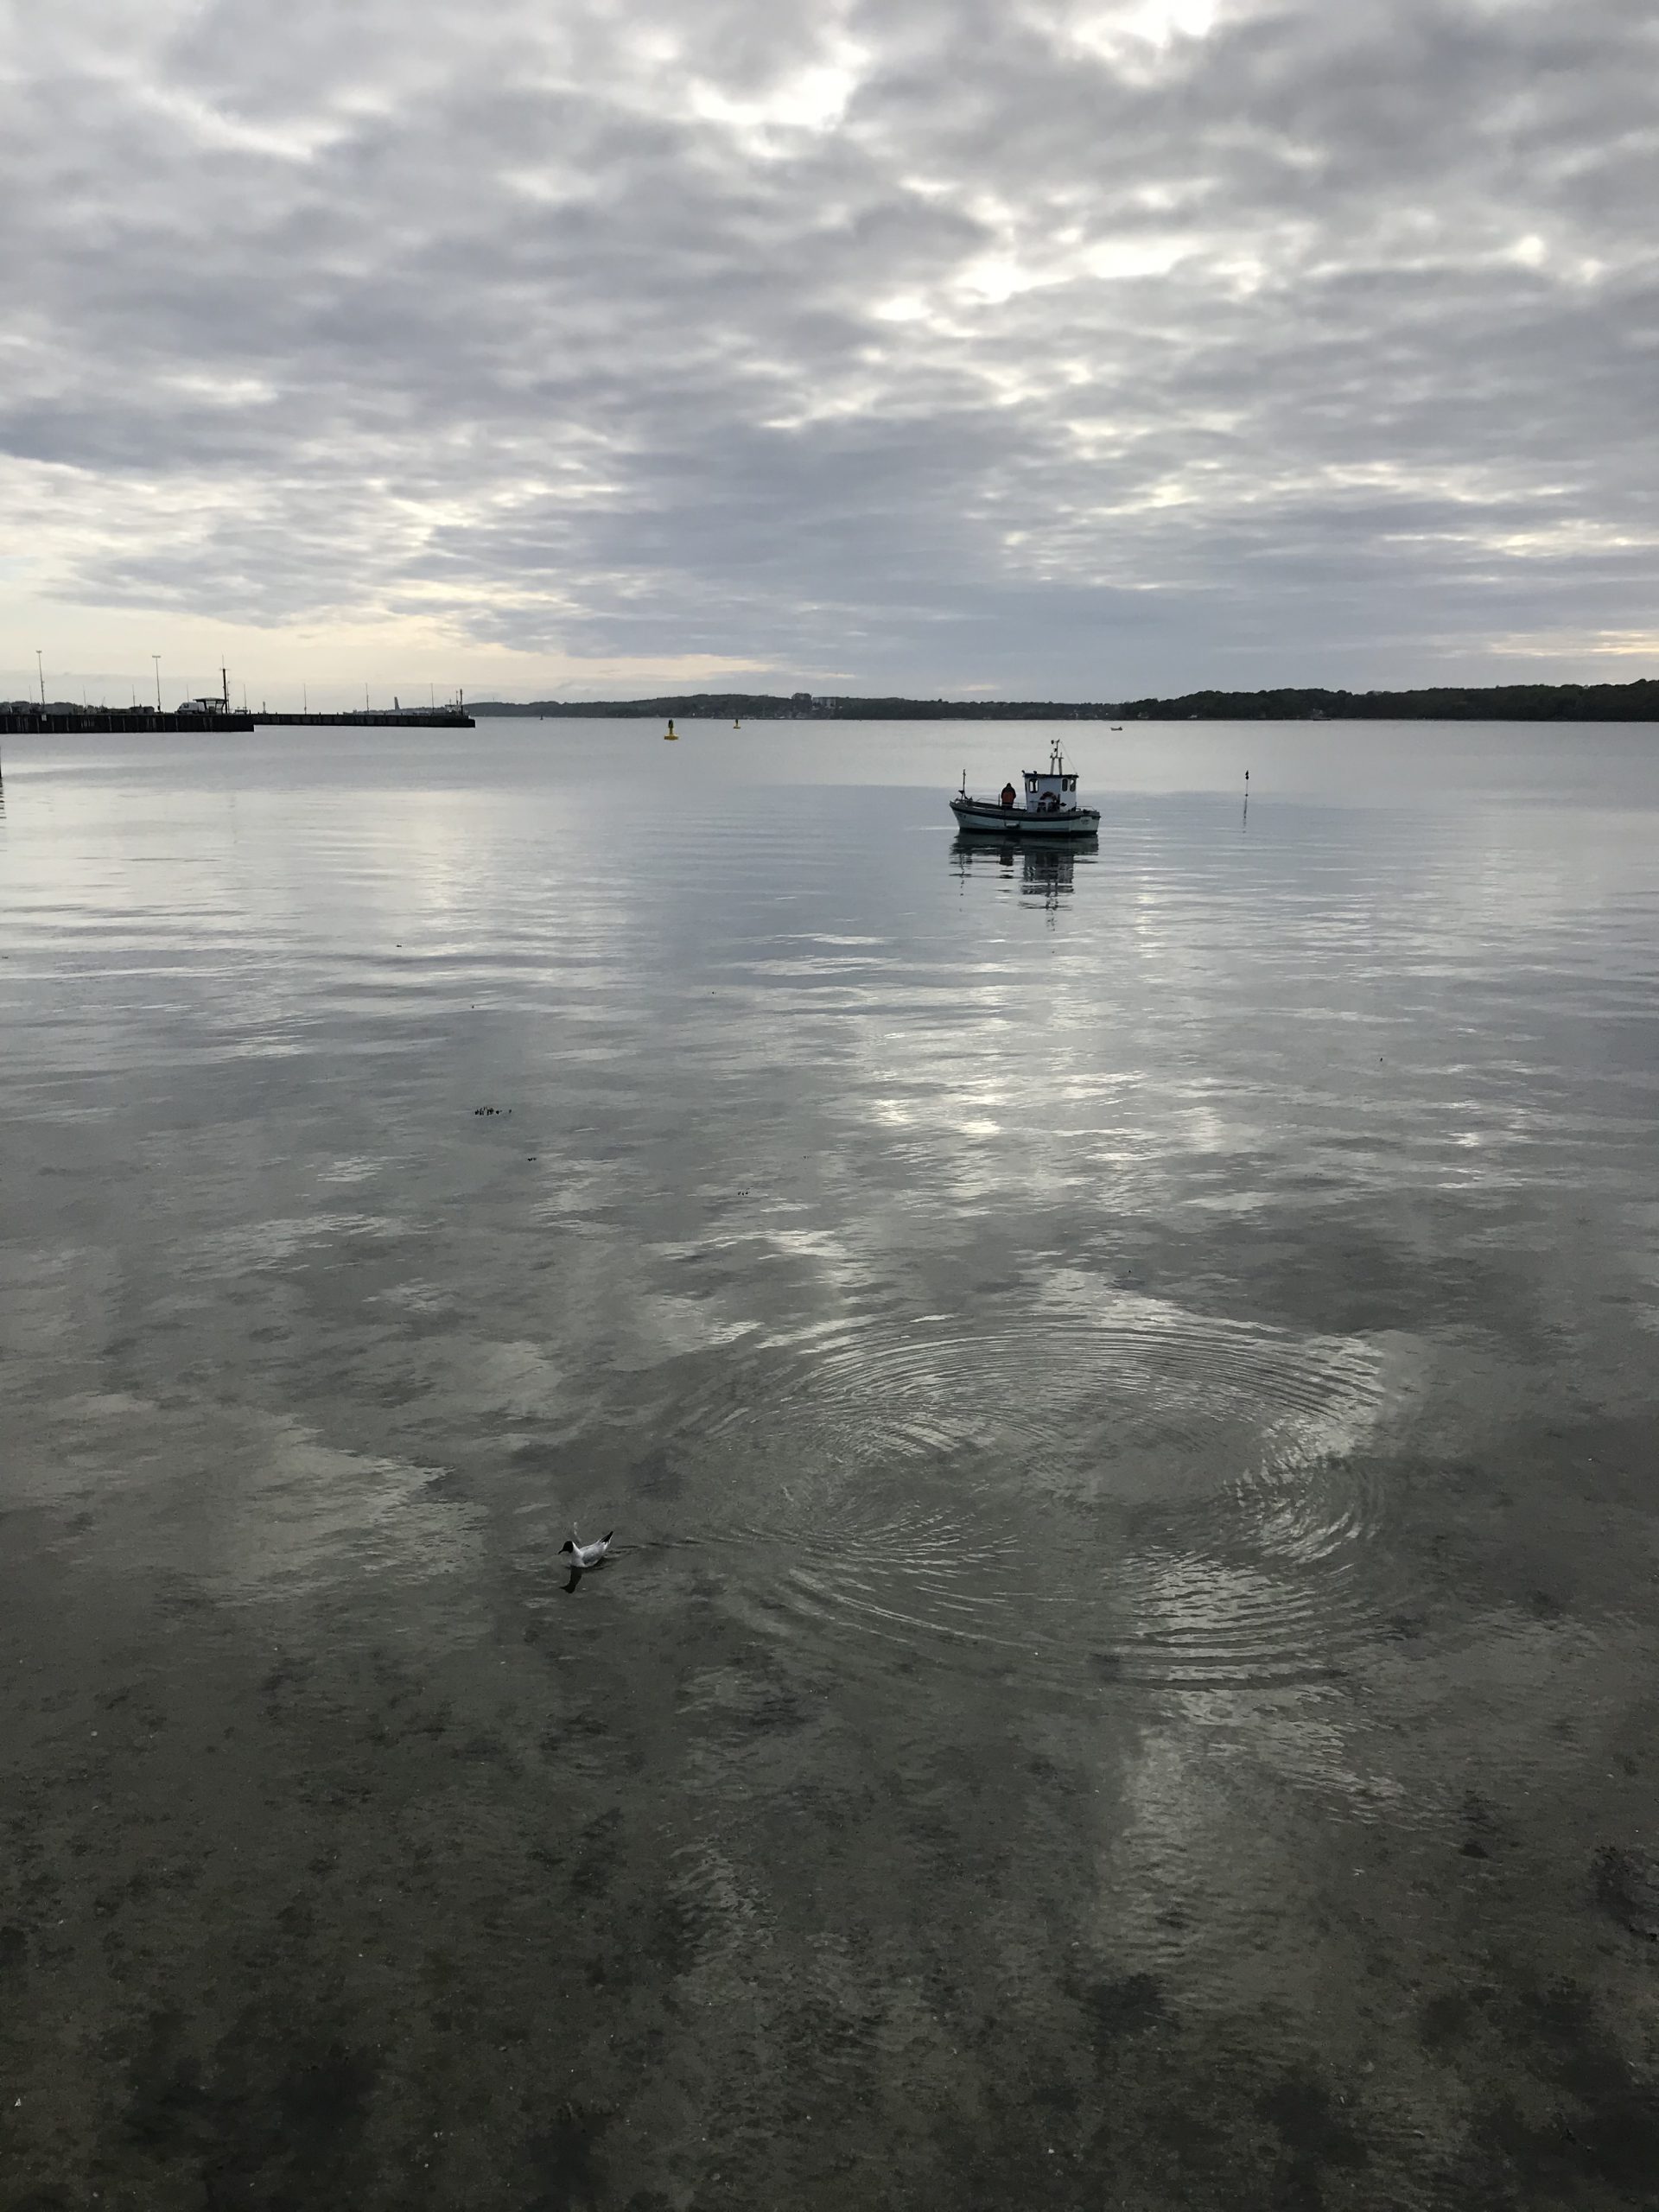
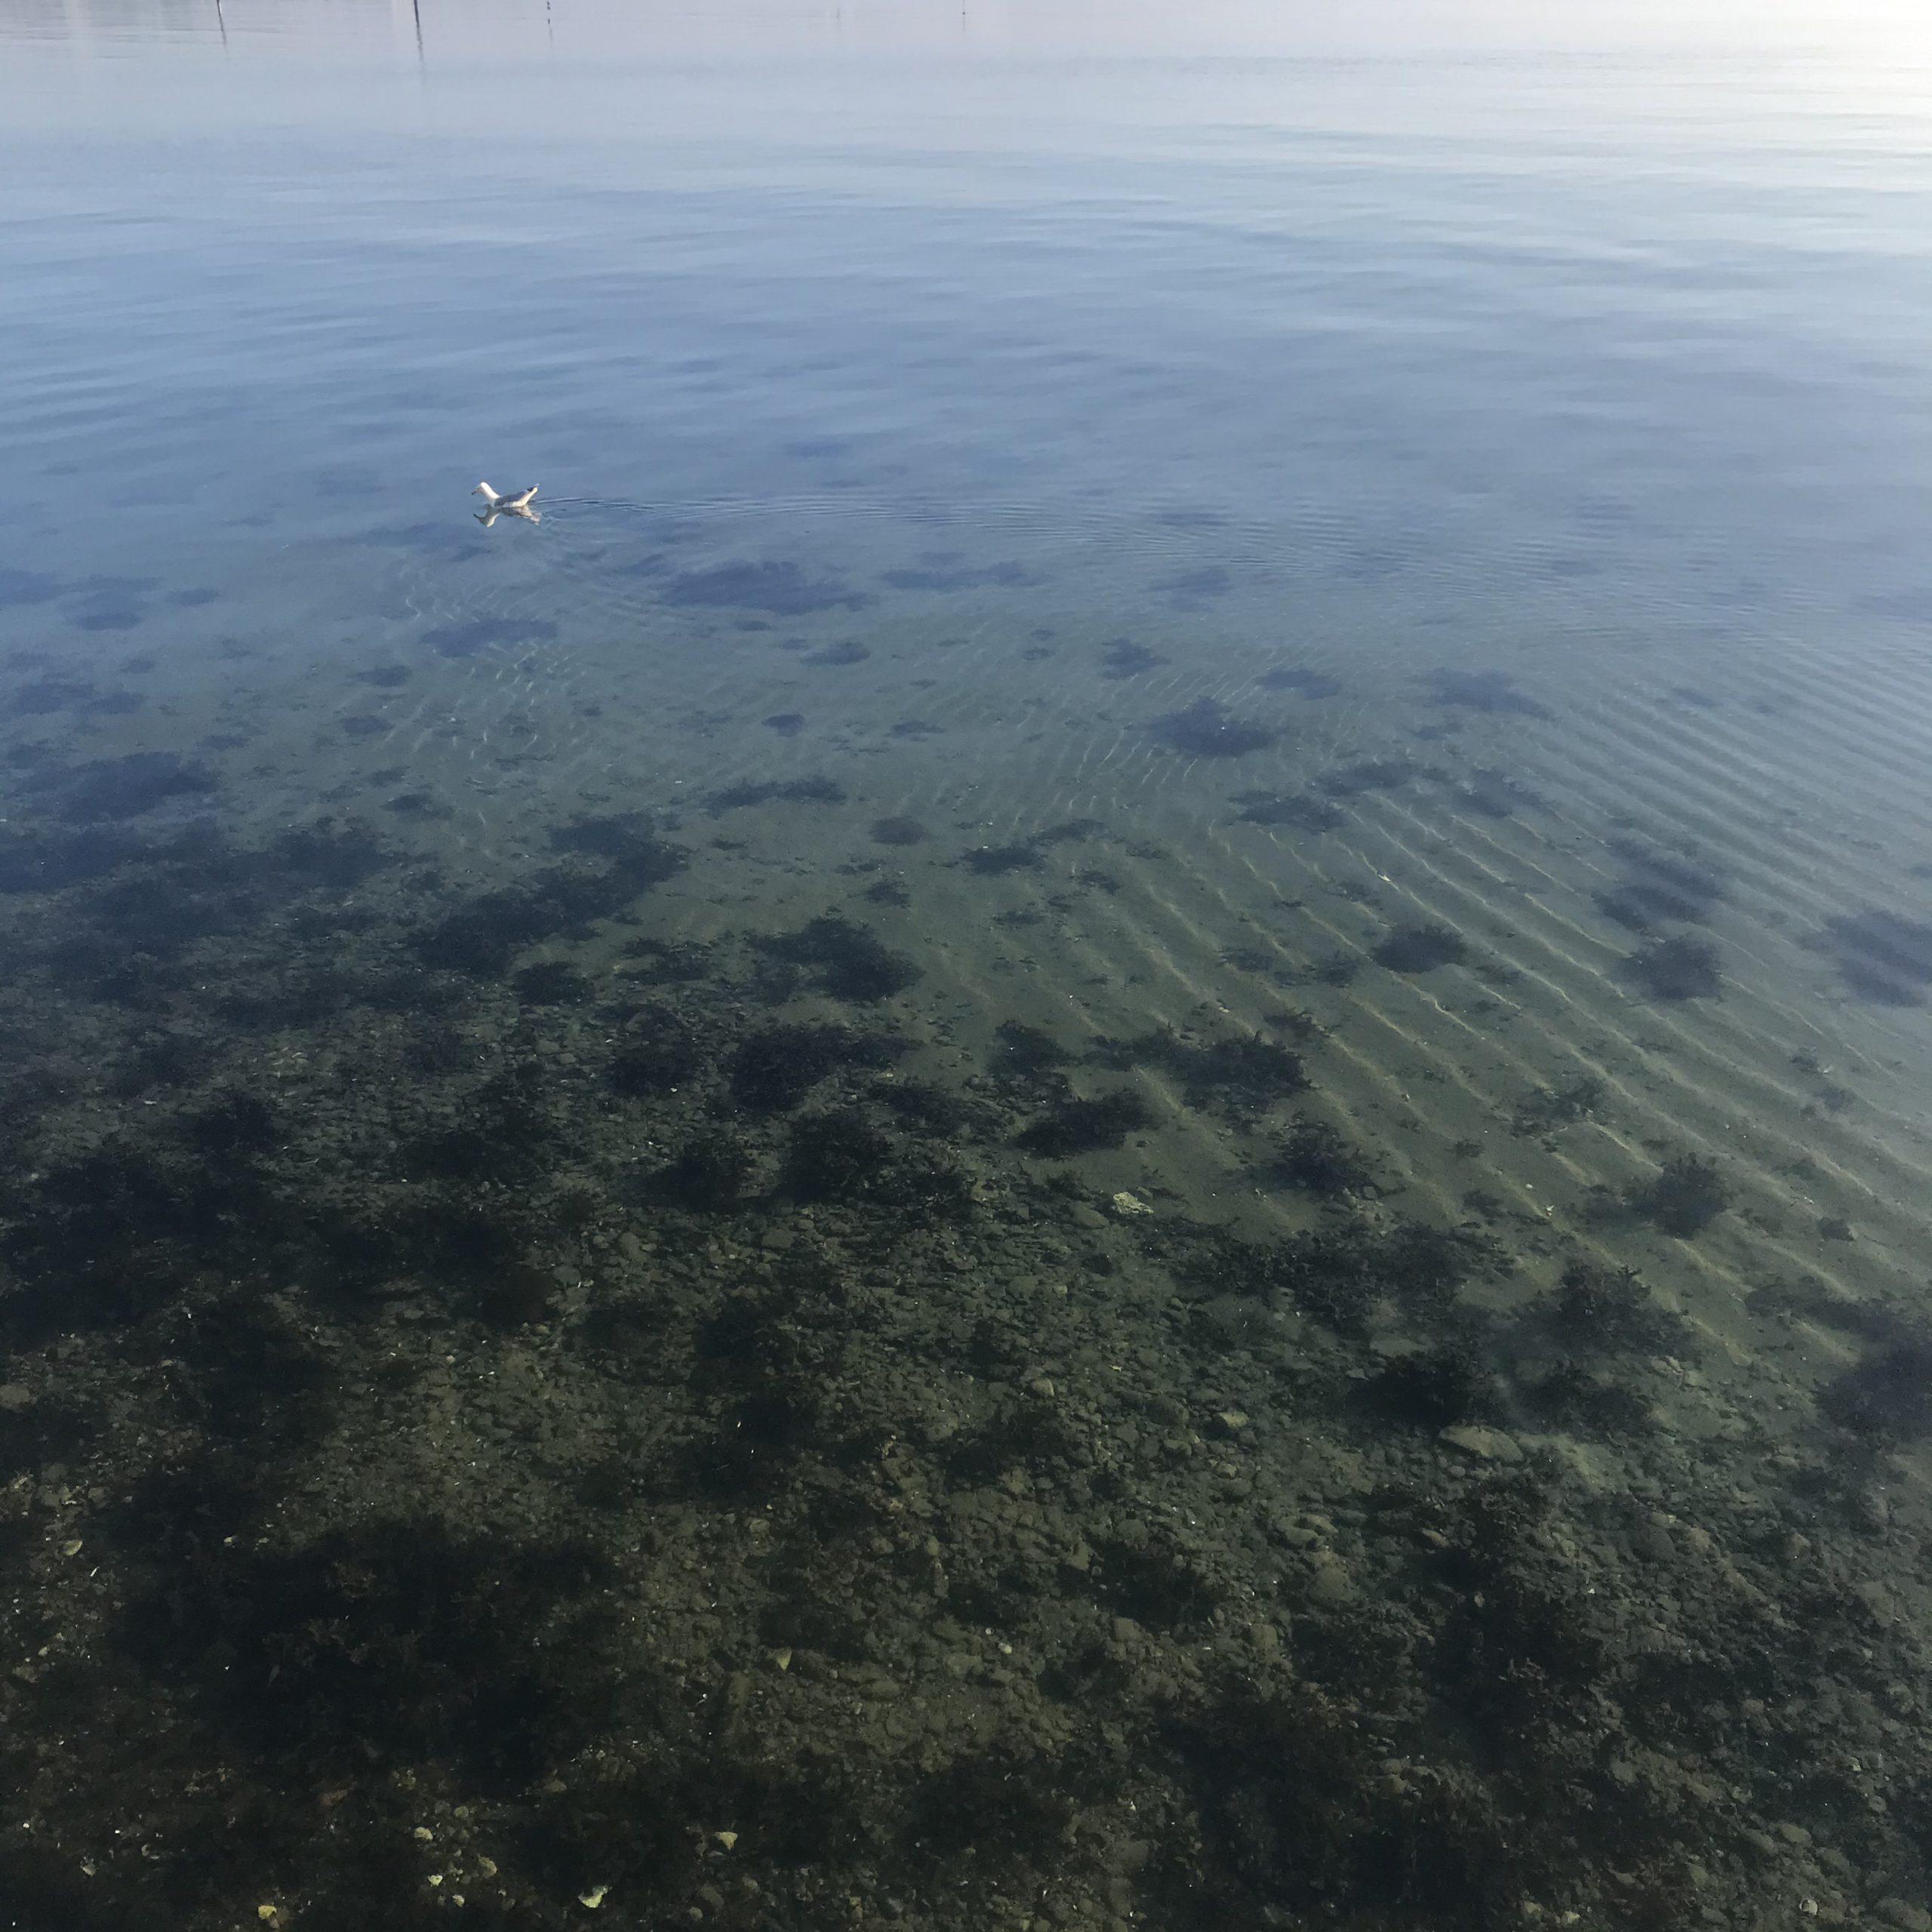
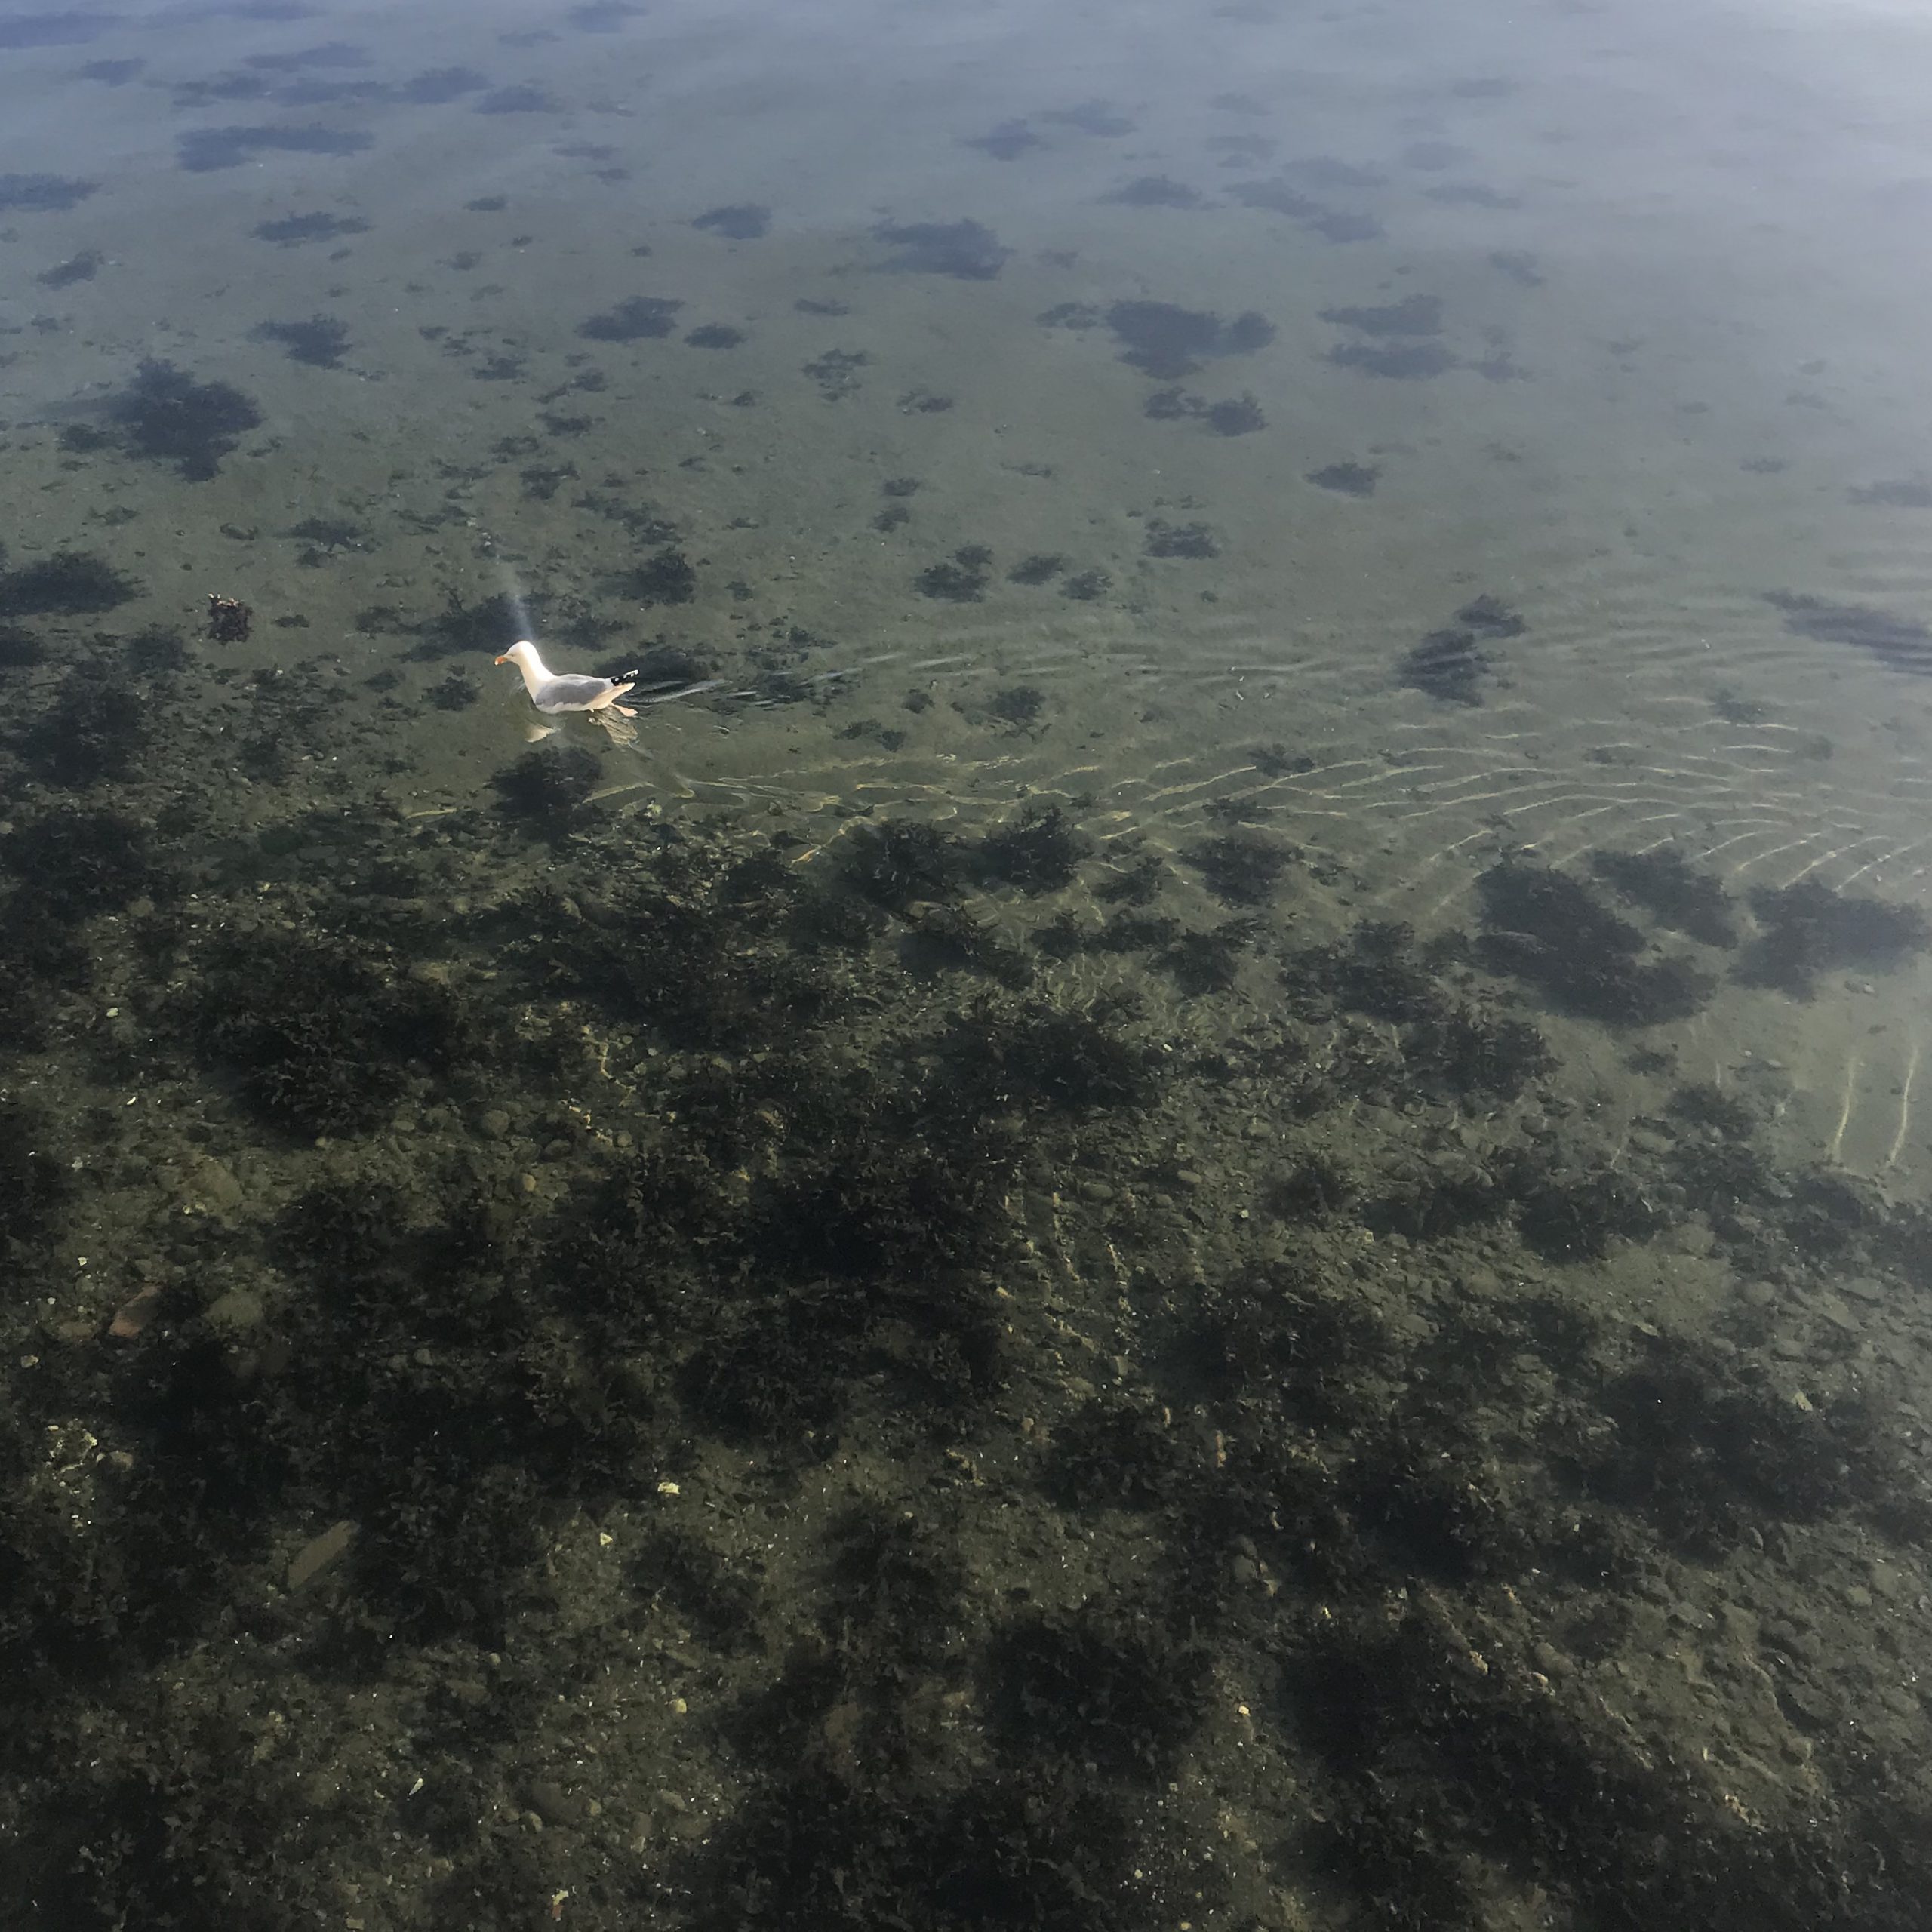
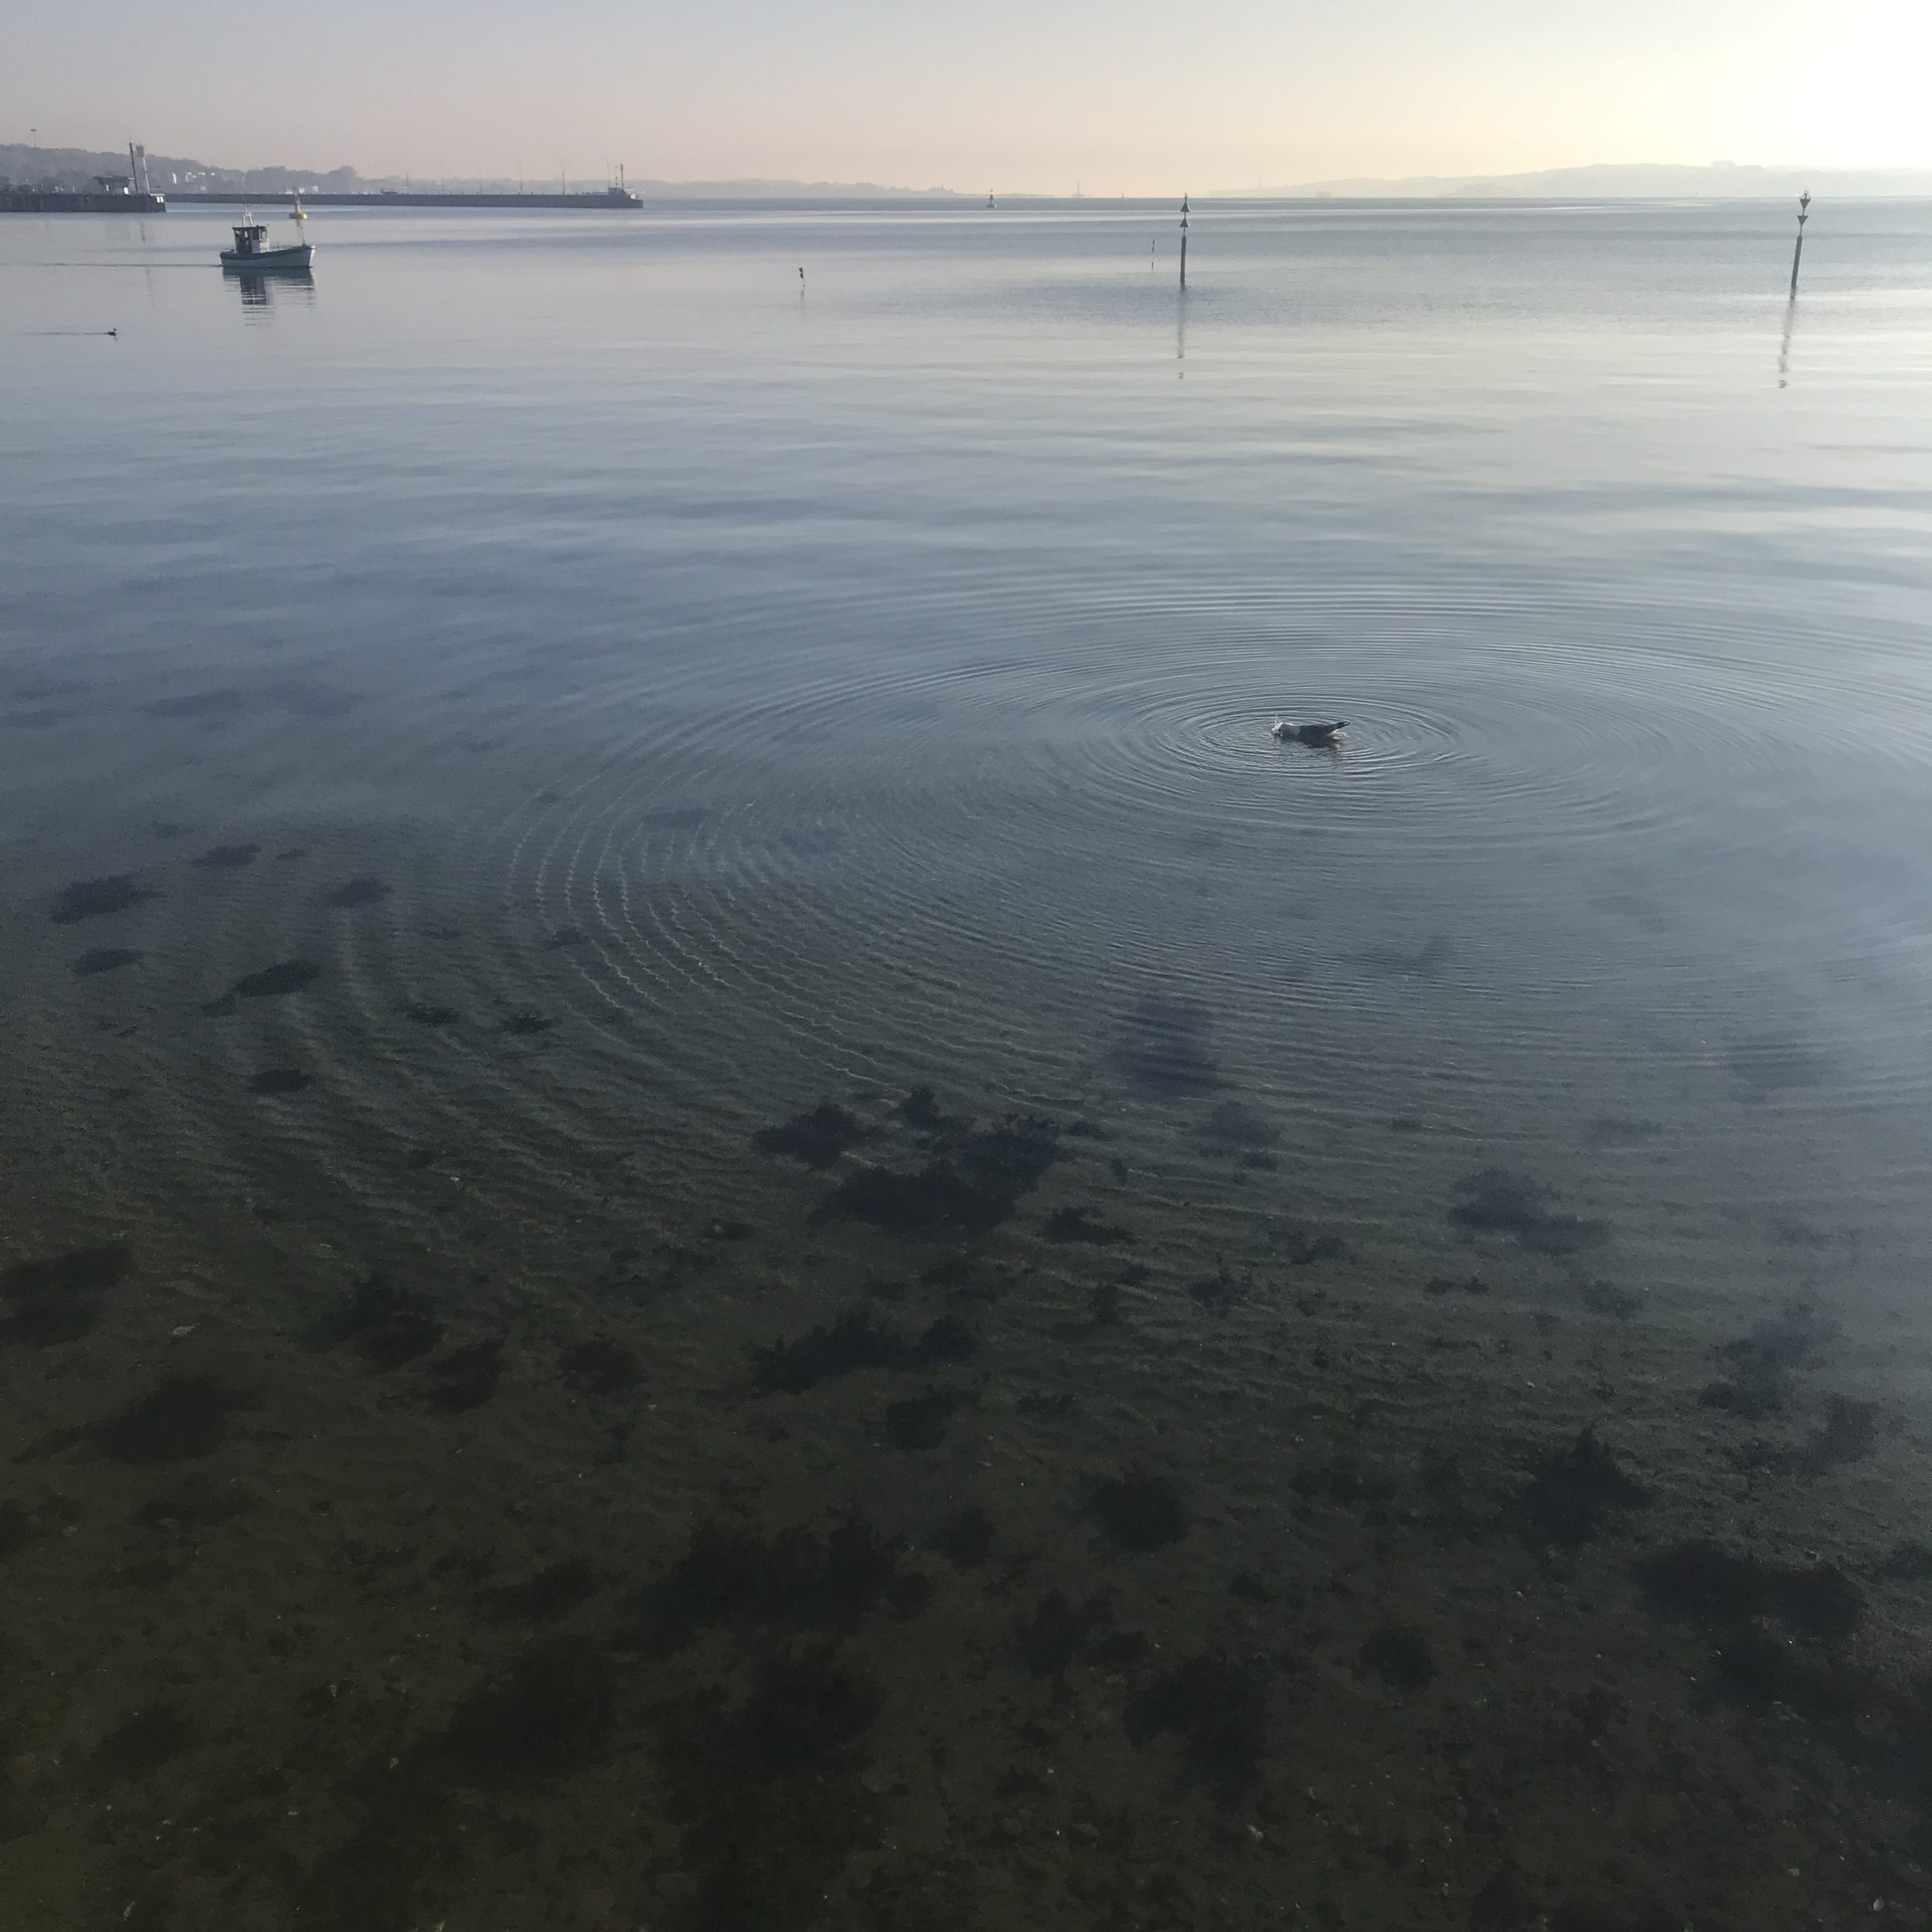
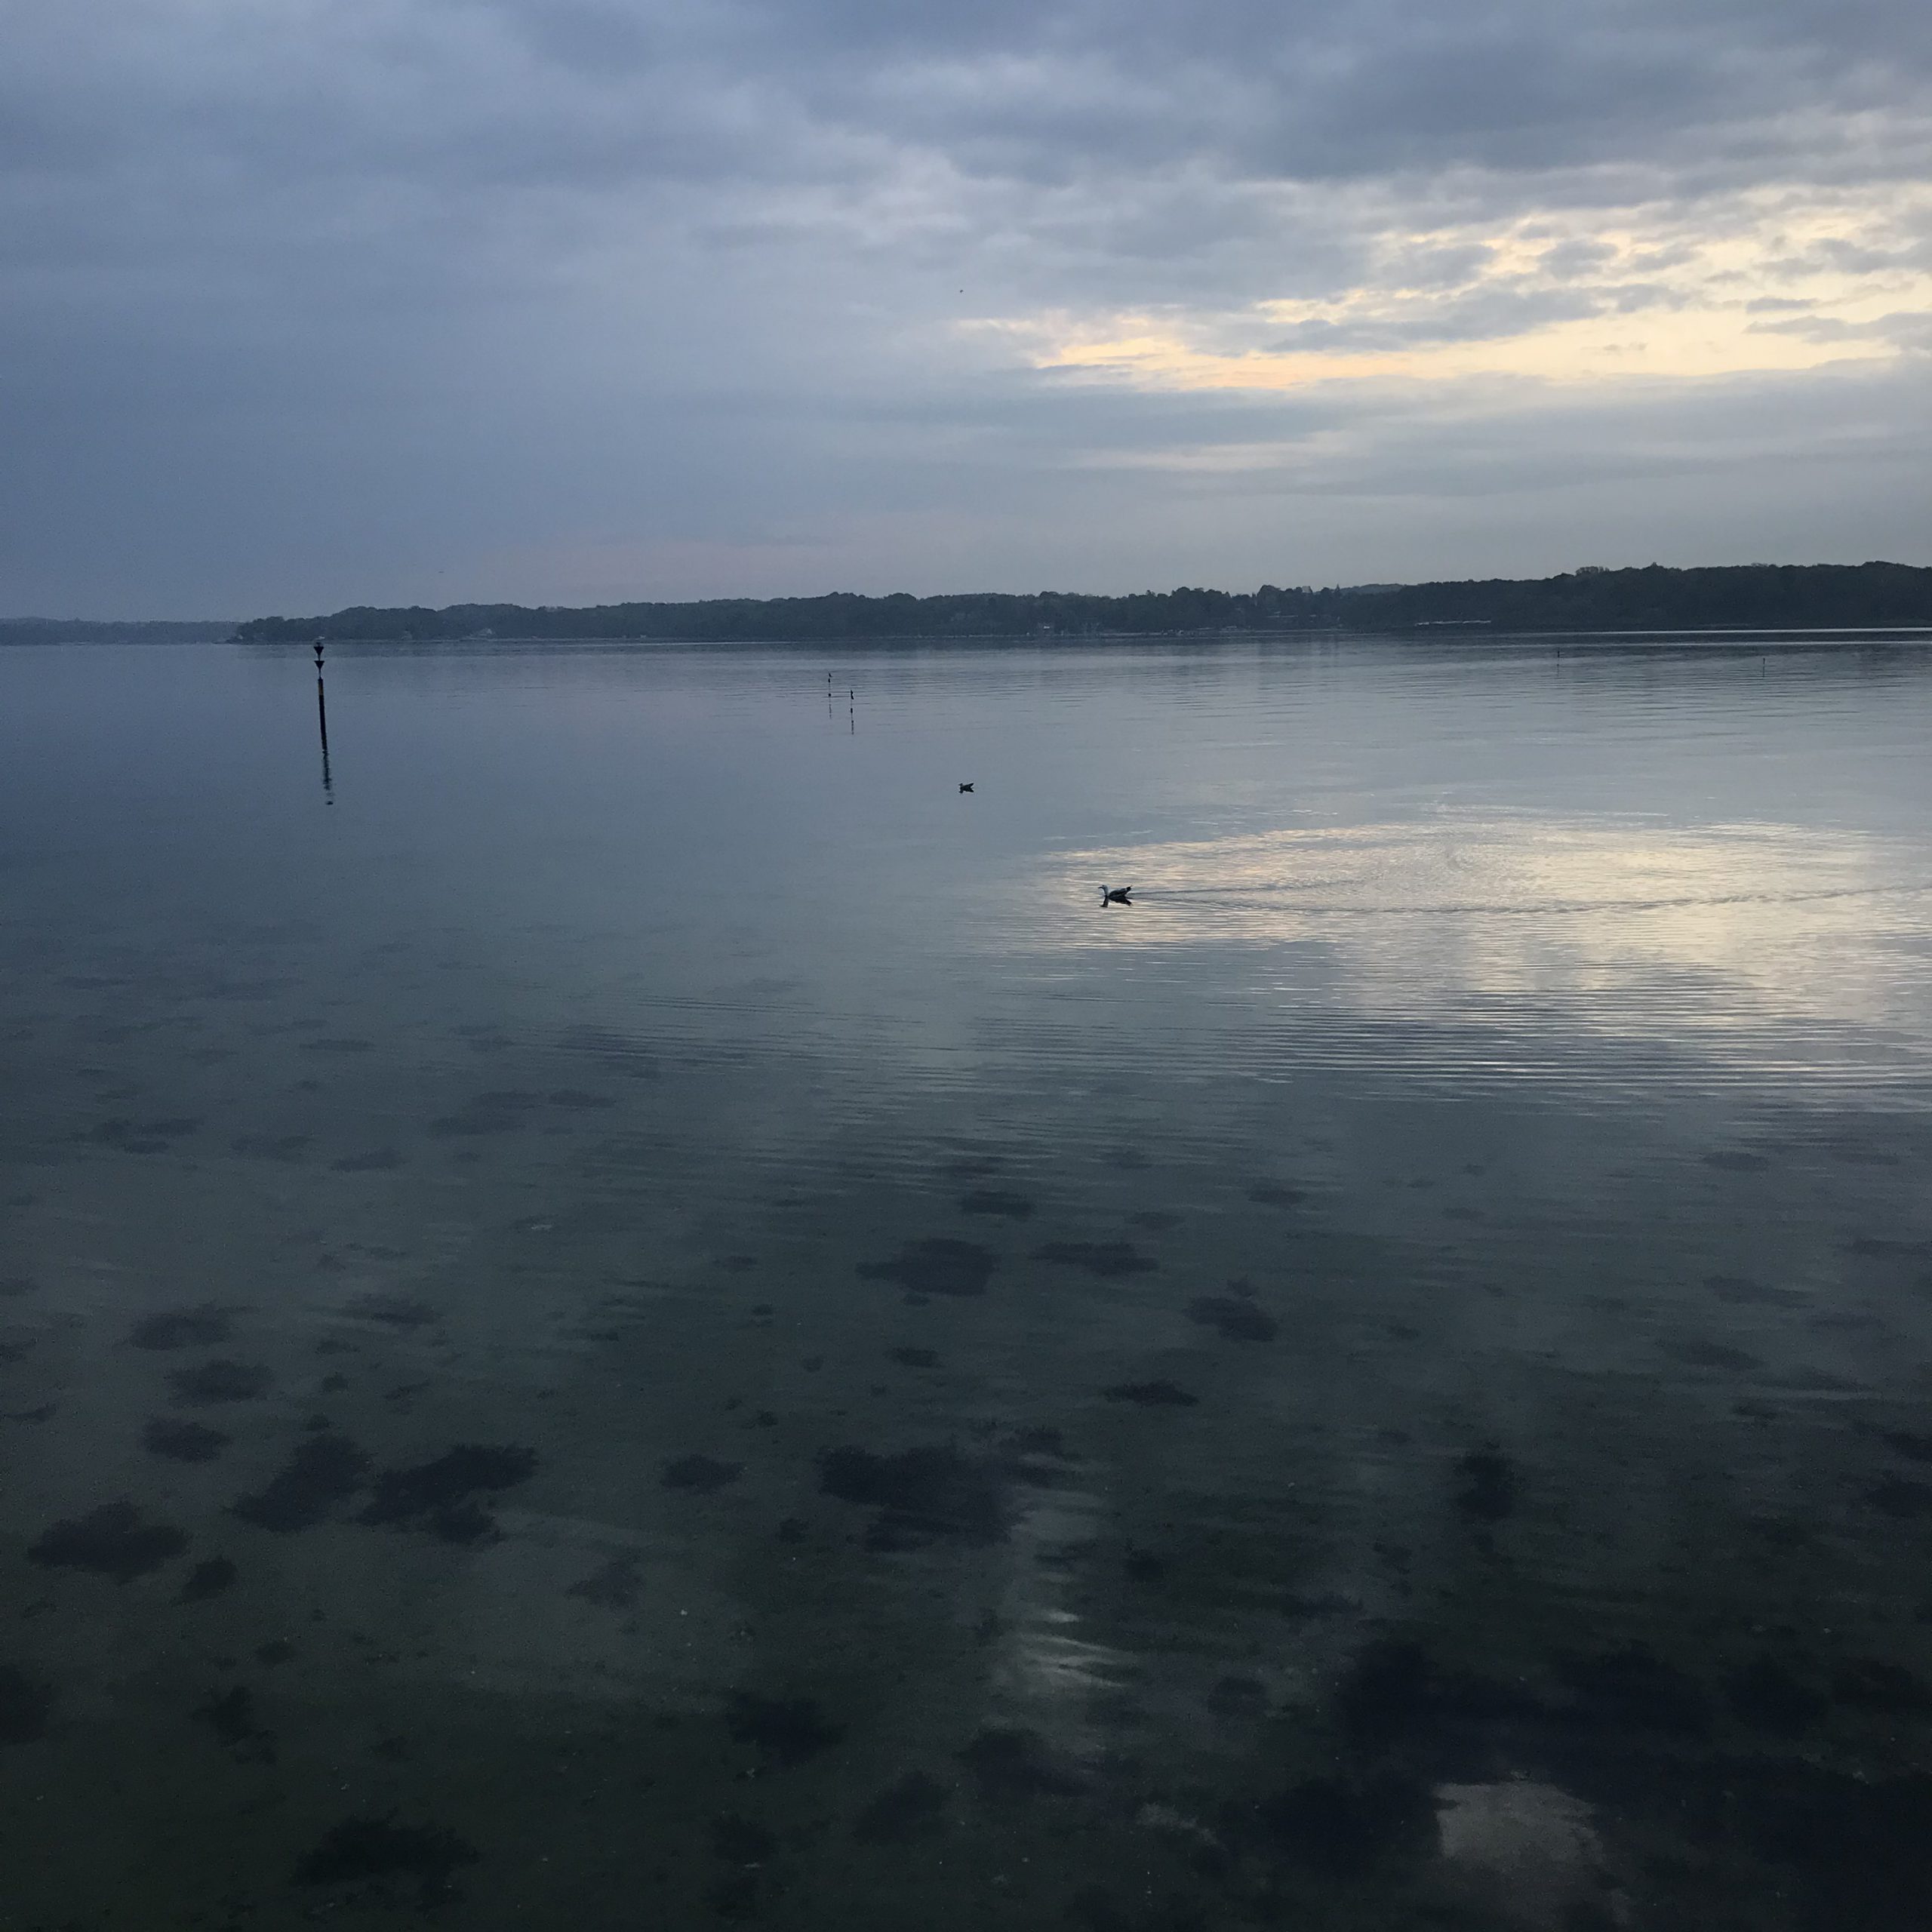
My perfect Saturdays start like this: Early morning walk along the water, followed by coffee while blogging about waves. Today’s focus: The cool waves that birds make!

First, let’s look at the weird way in which seagulls take off from water. They make a big splash which develops into ring-shaped waves. So far, so good. But…

…that’s usually not all that happens: They usually hit the water a couple more times before they fully take flight, thus leaving a trail of circular waves radiating from each of the points where they hit the water.

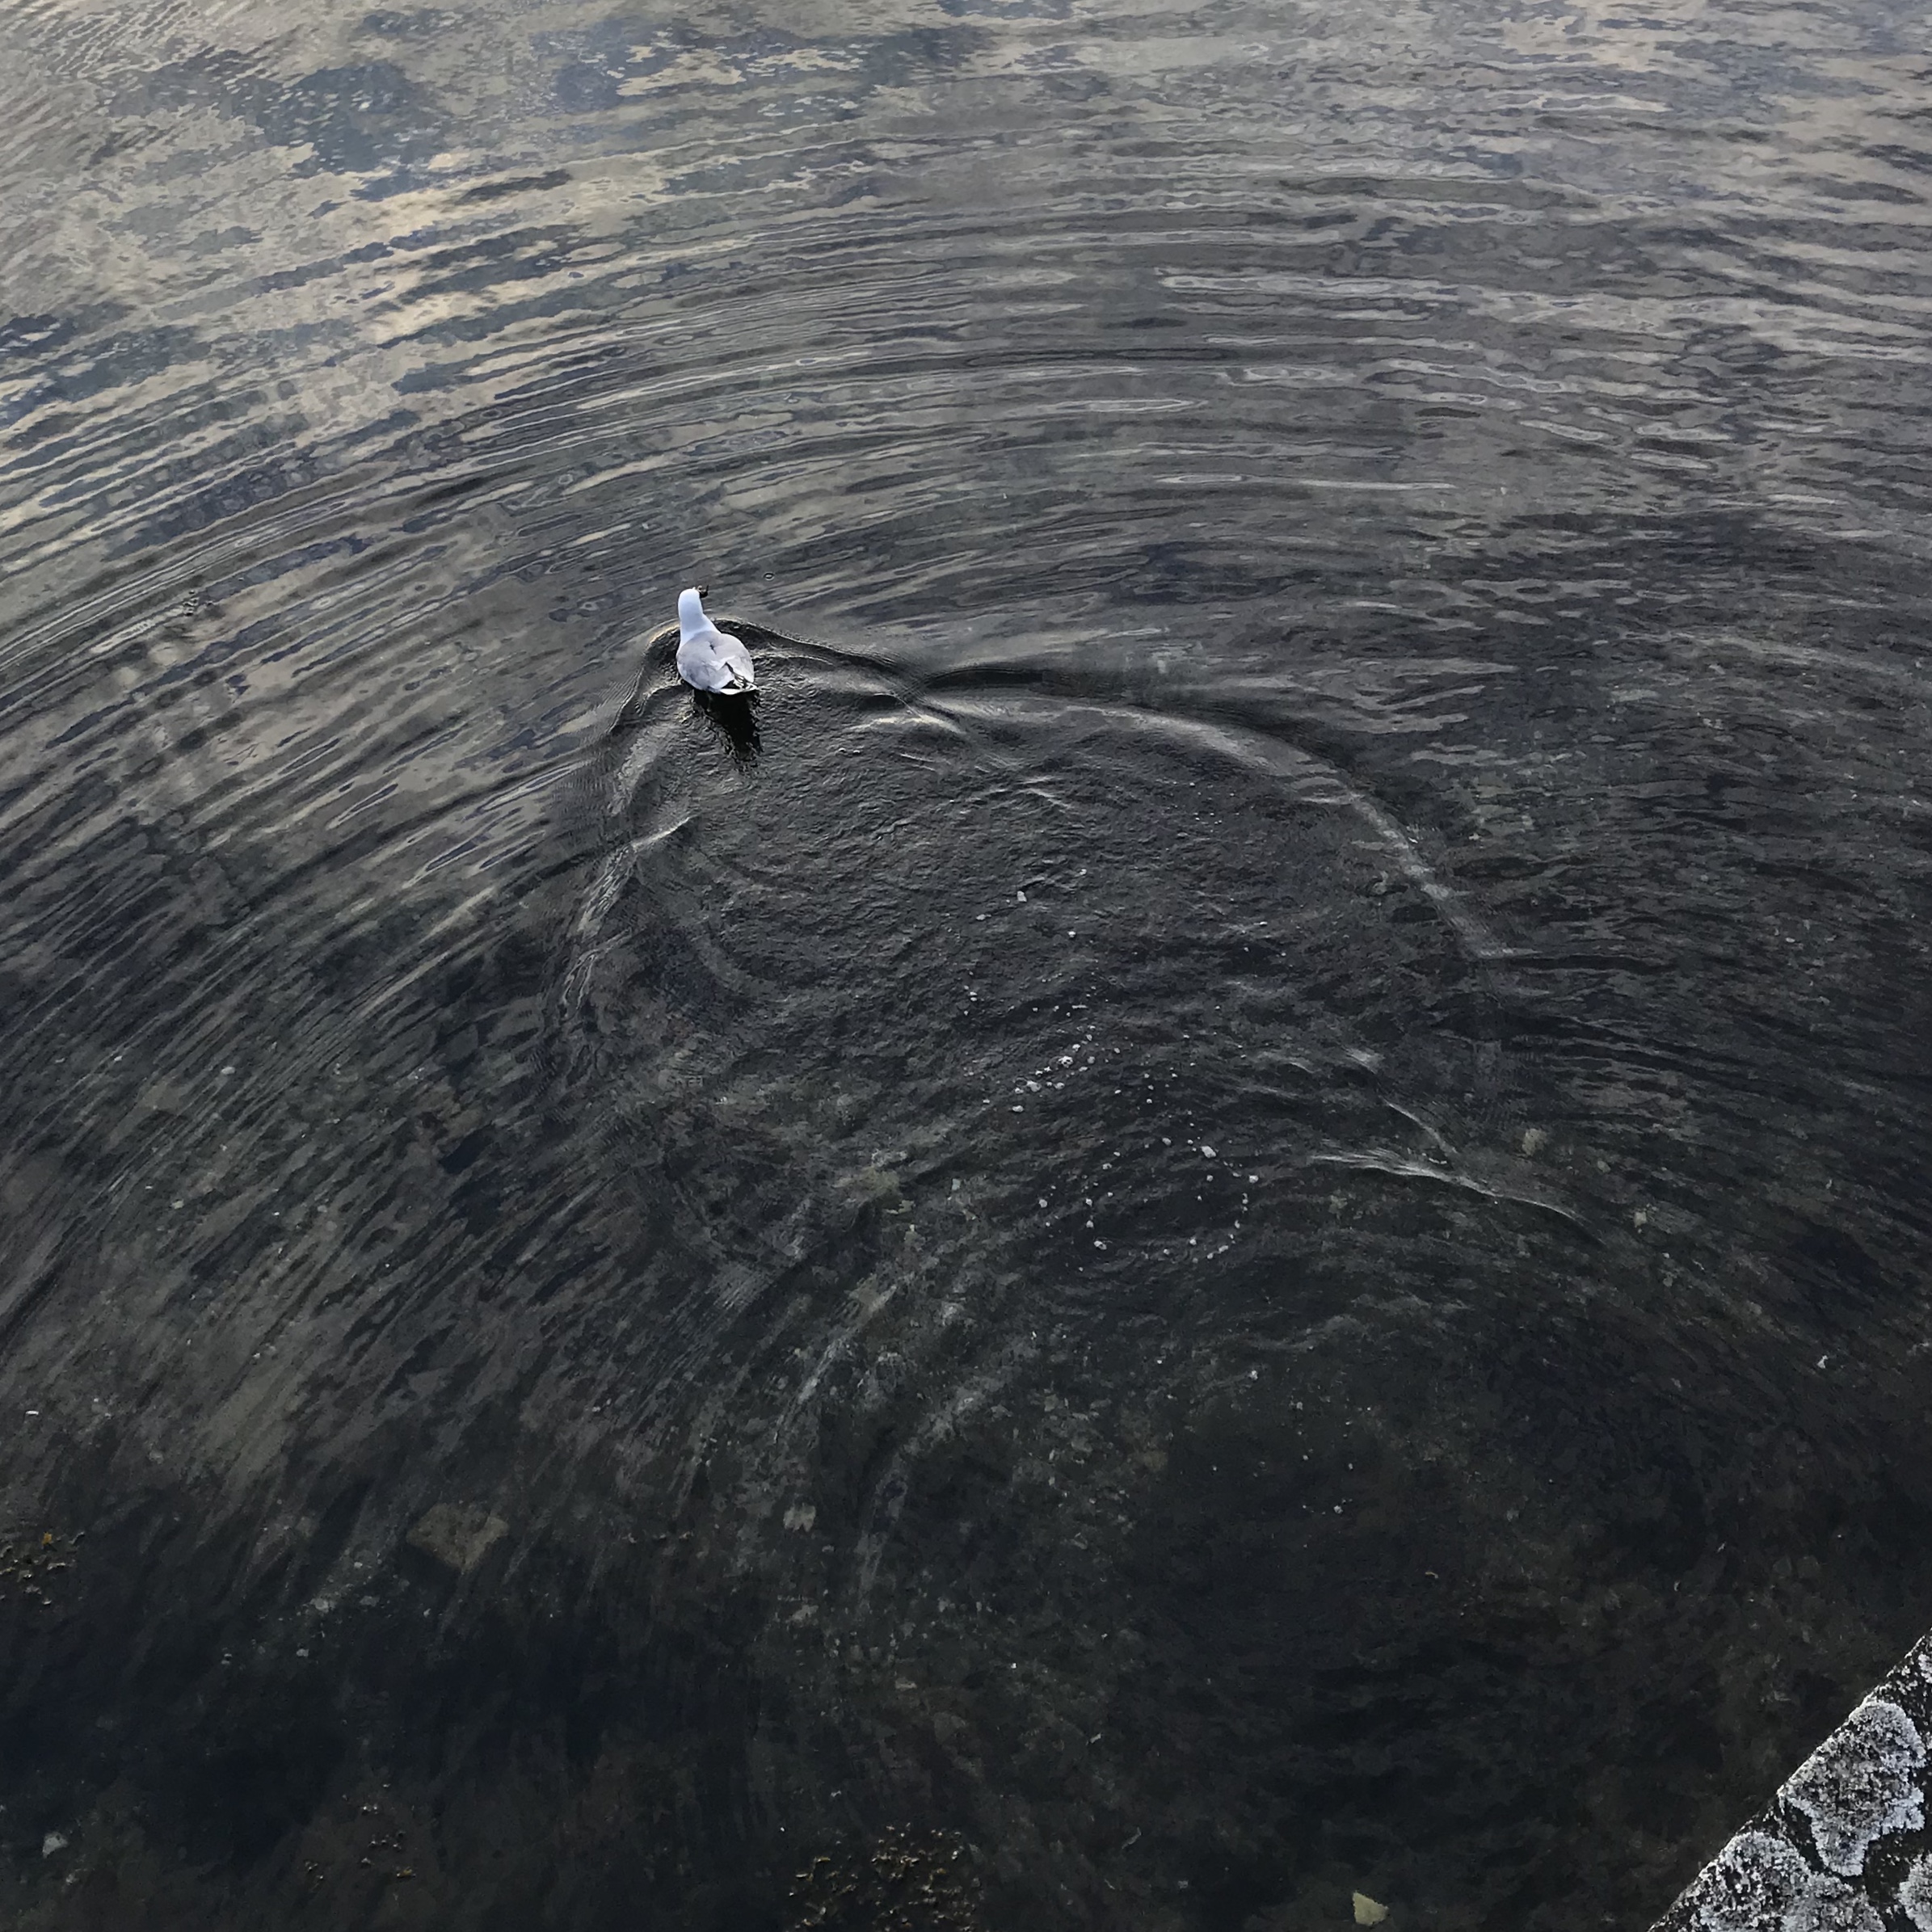
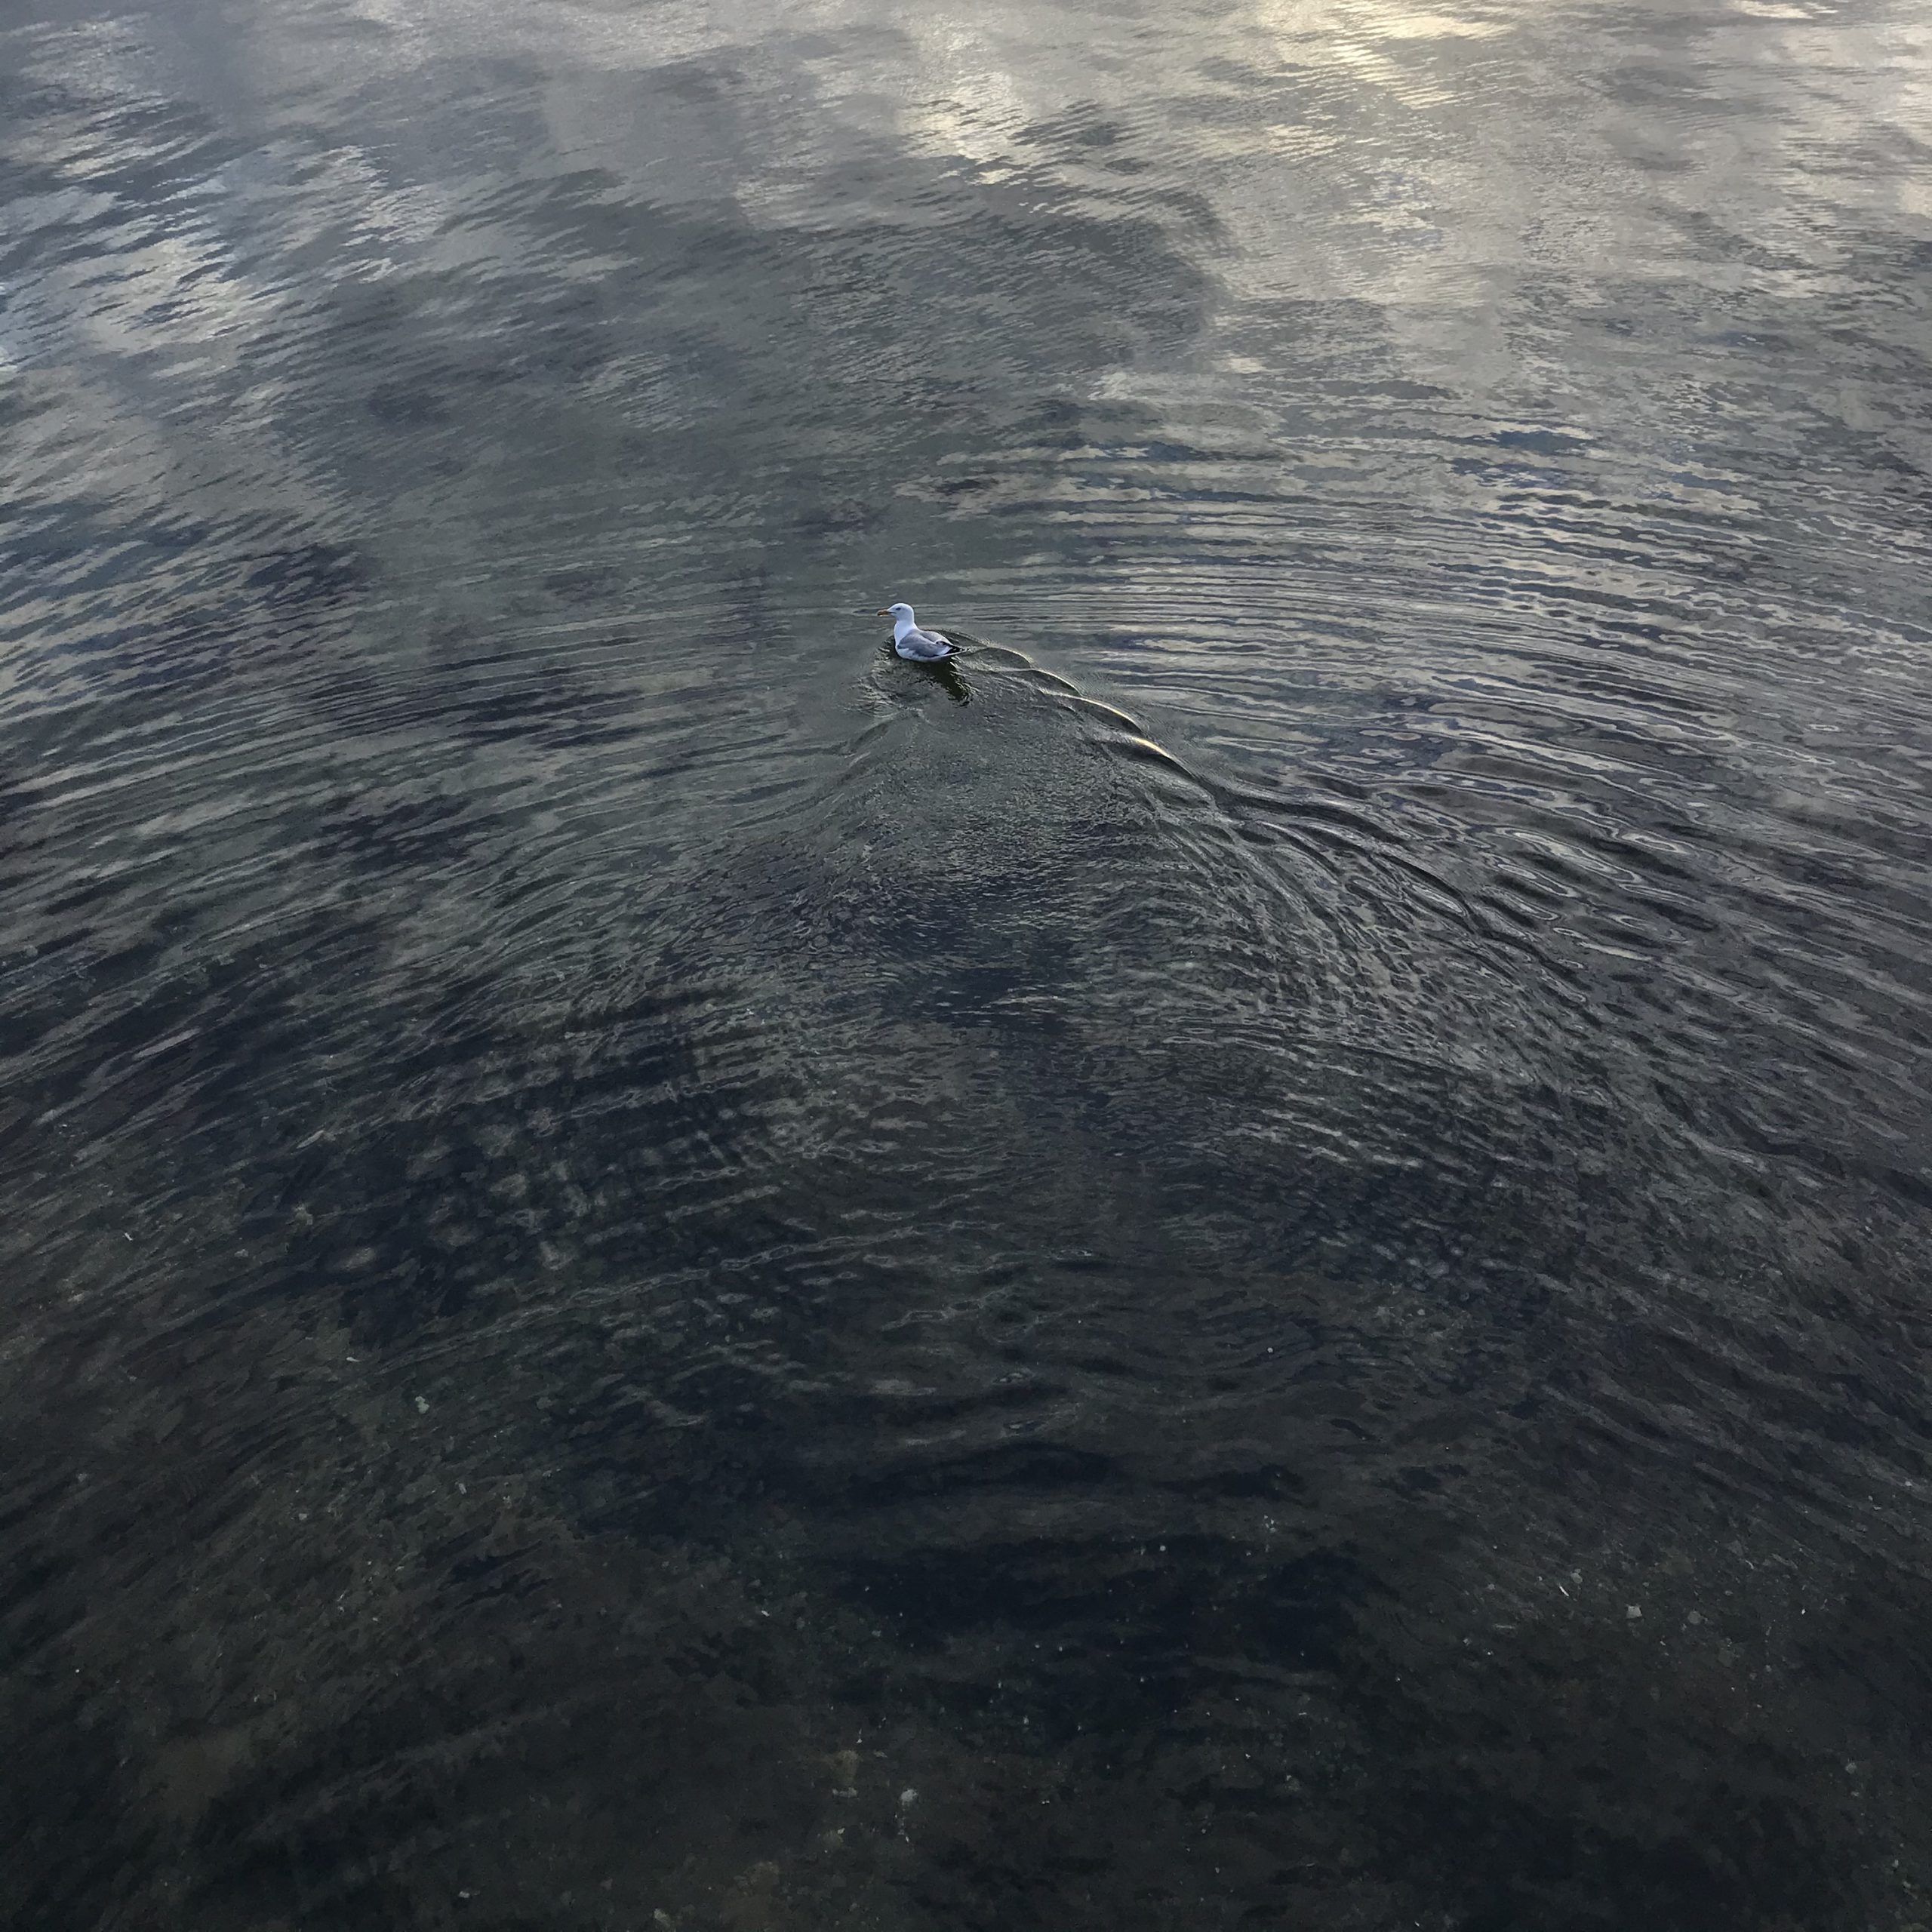
This morning, there was a seagull sitting very close to the sea wall (which you see in the lower right corner of the picture), probably eating or washing its feathers; in any case radiating off waves. When I looked down, it flew up, hit the water once, landed again, and then began to swim away.

And you can see all of this in the waves!

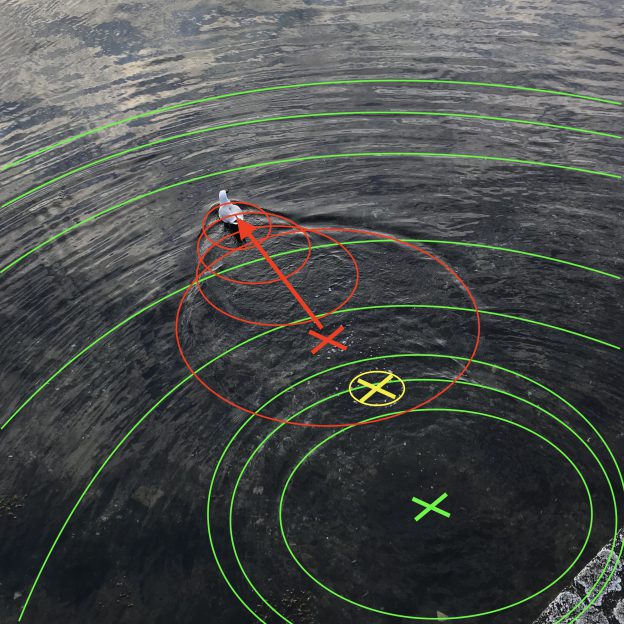
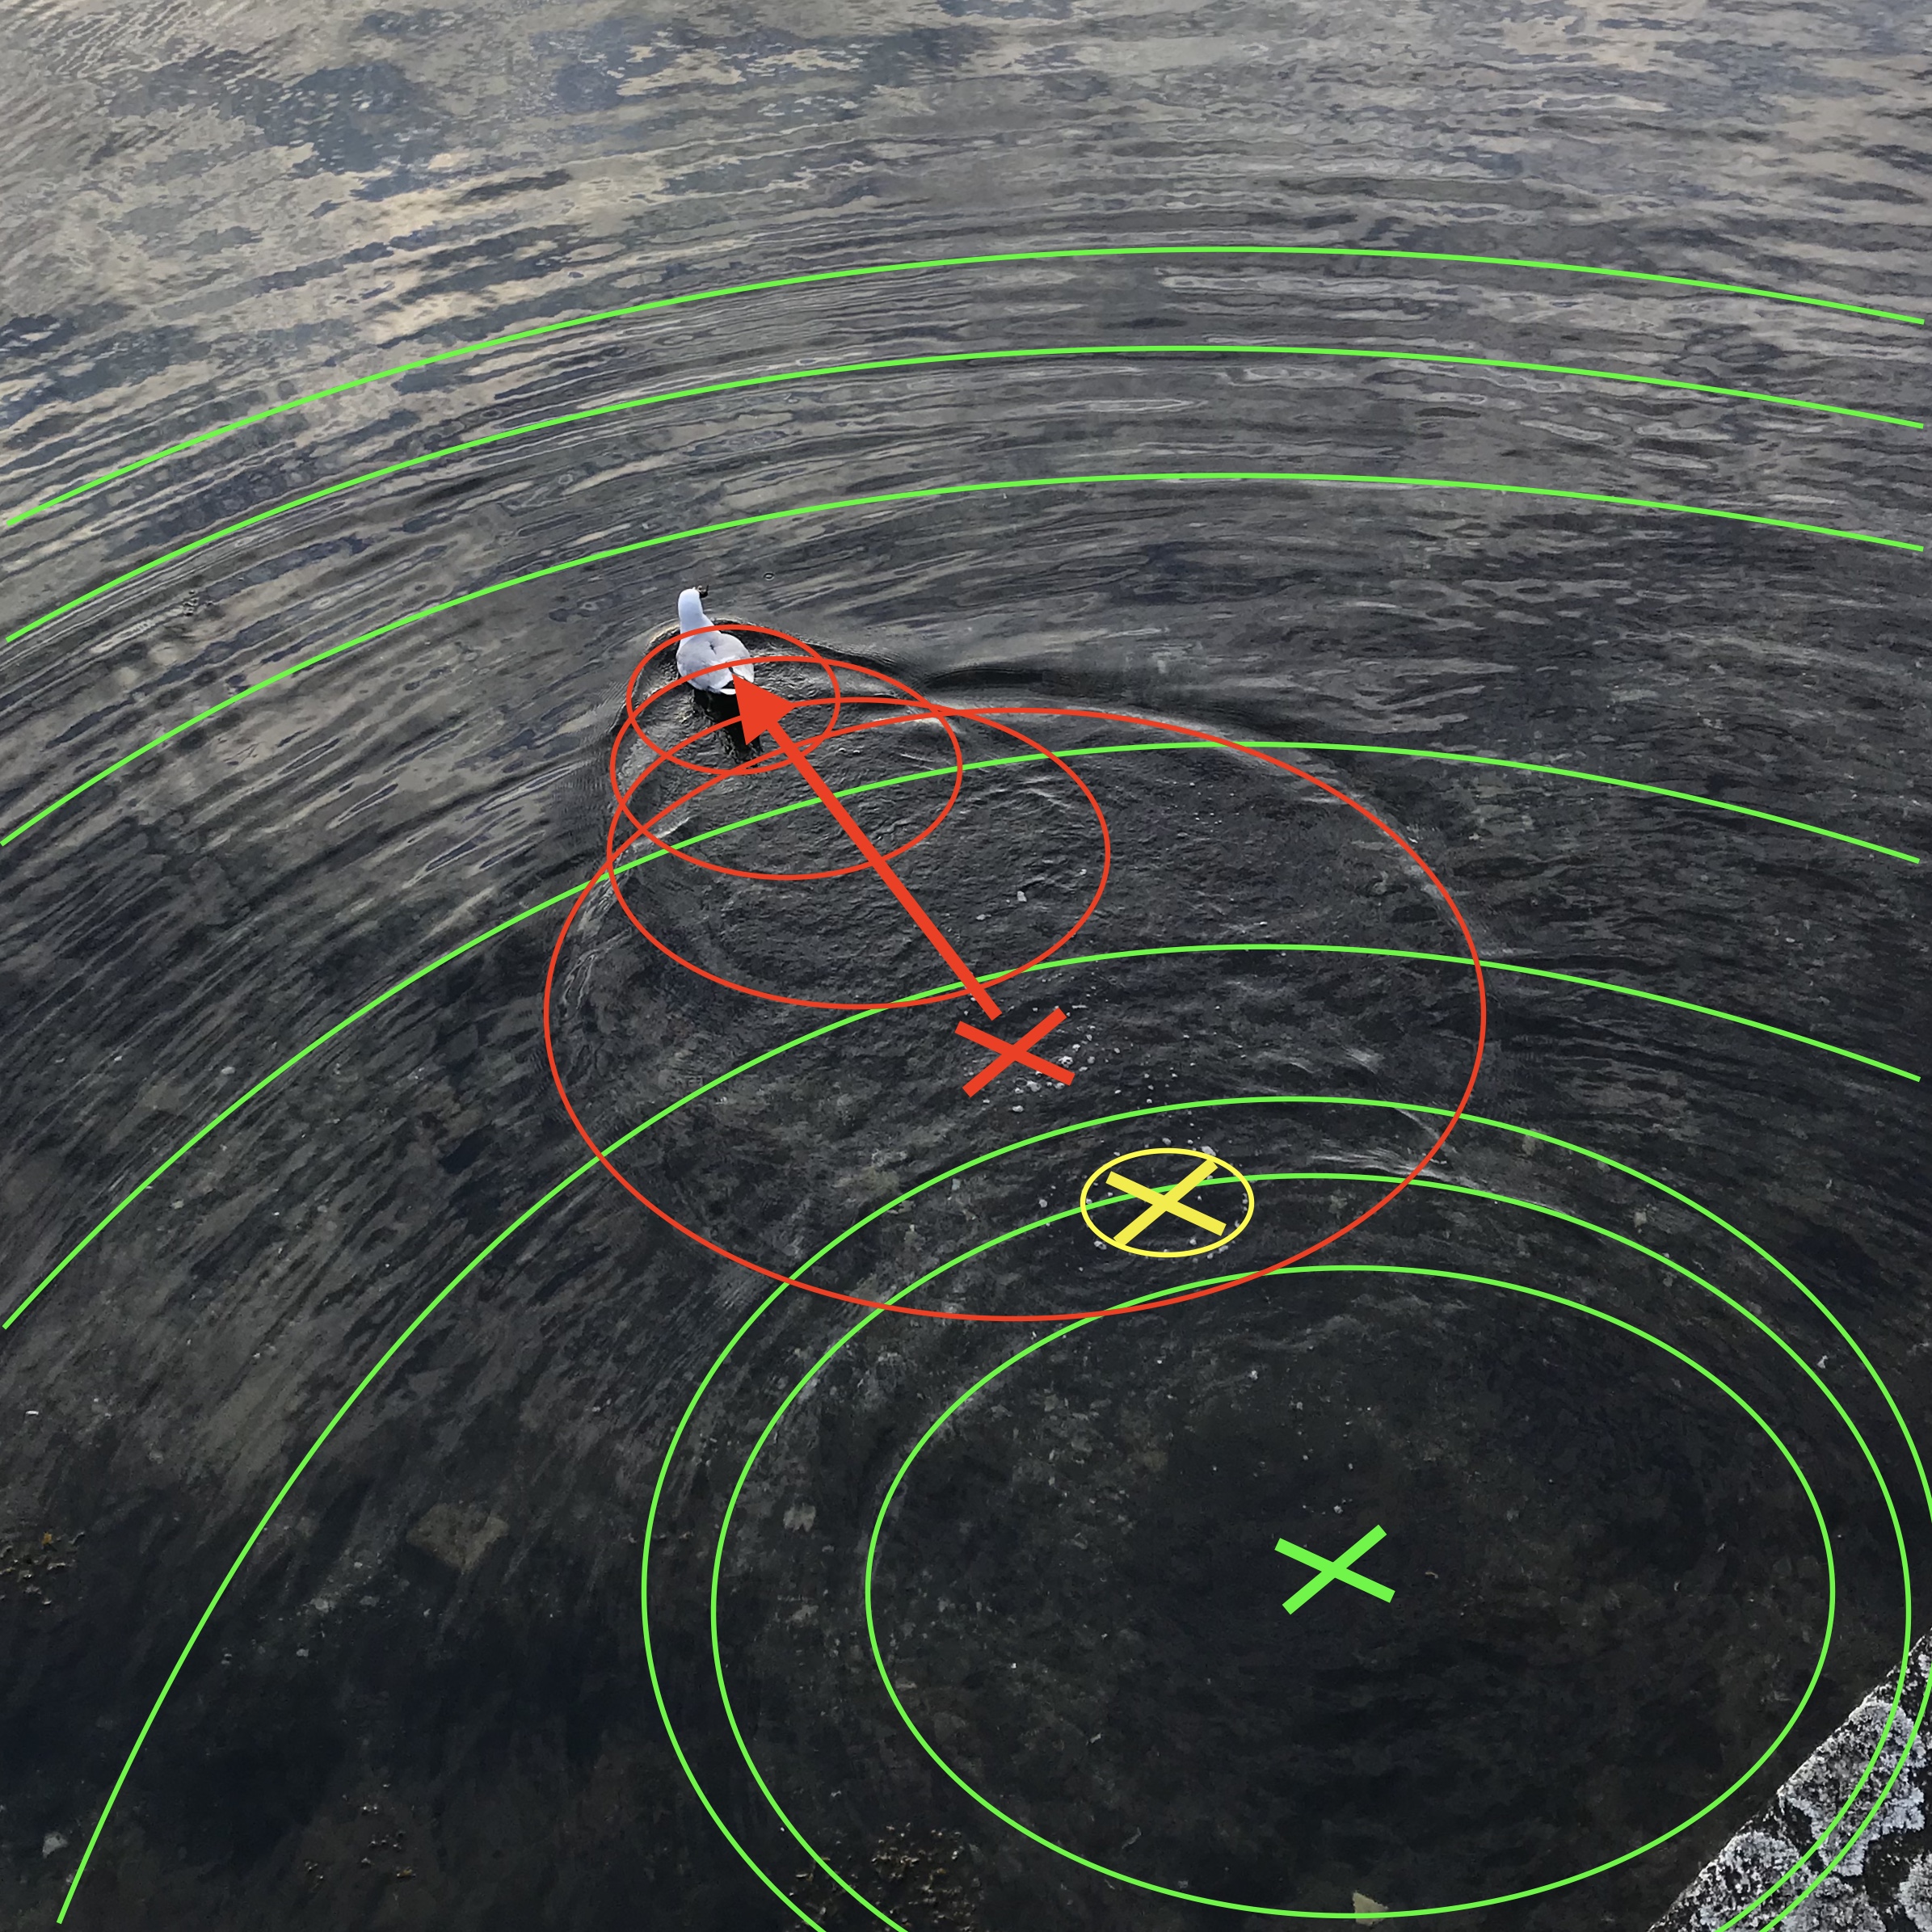
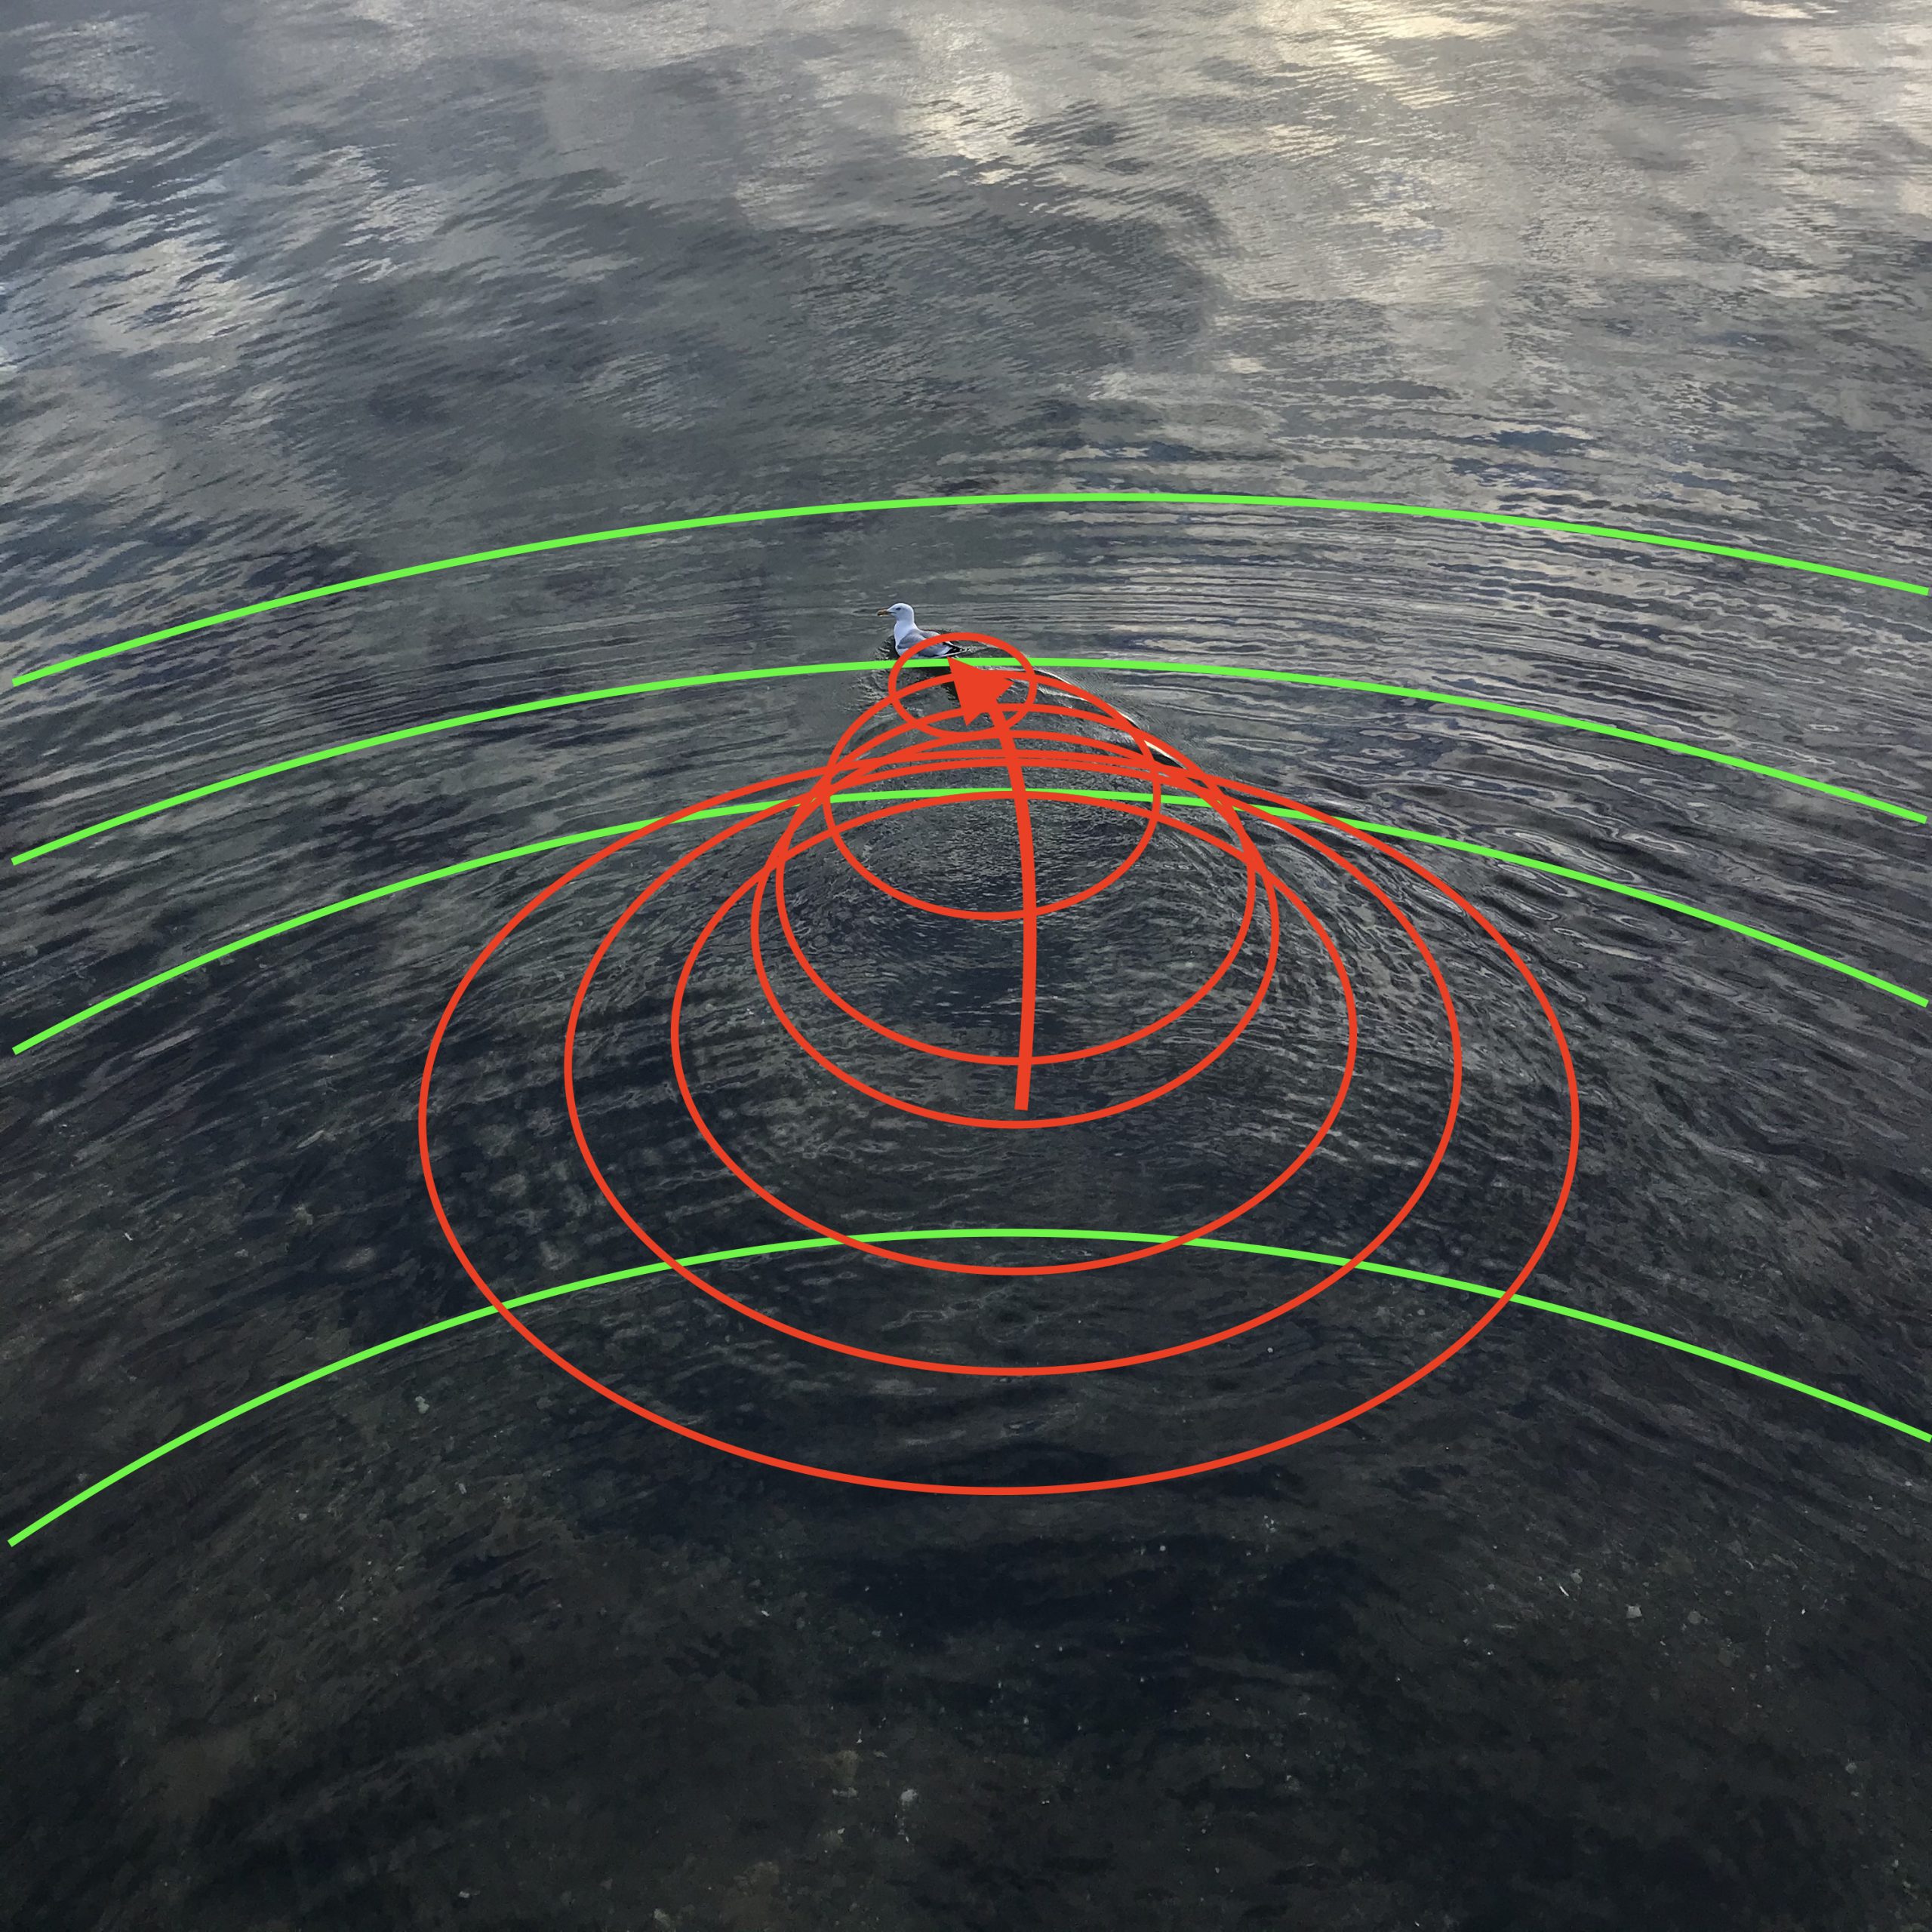
The green cross below marks the spot where the seagull sat before I interrupted it. It must have been sitting there for a bit judging from the radius of the circular waves marked in green that radiate from that exact spot.

But then when the seagull saw me, it took off, dipped once into the water (green cross and corresponding wave circle), and then landed again (red cross) and swam away from there (following the red arrow on which the centers of the red circles fall).

How cool is this?

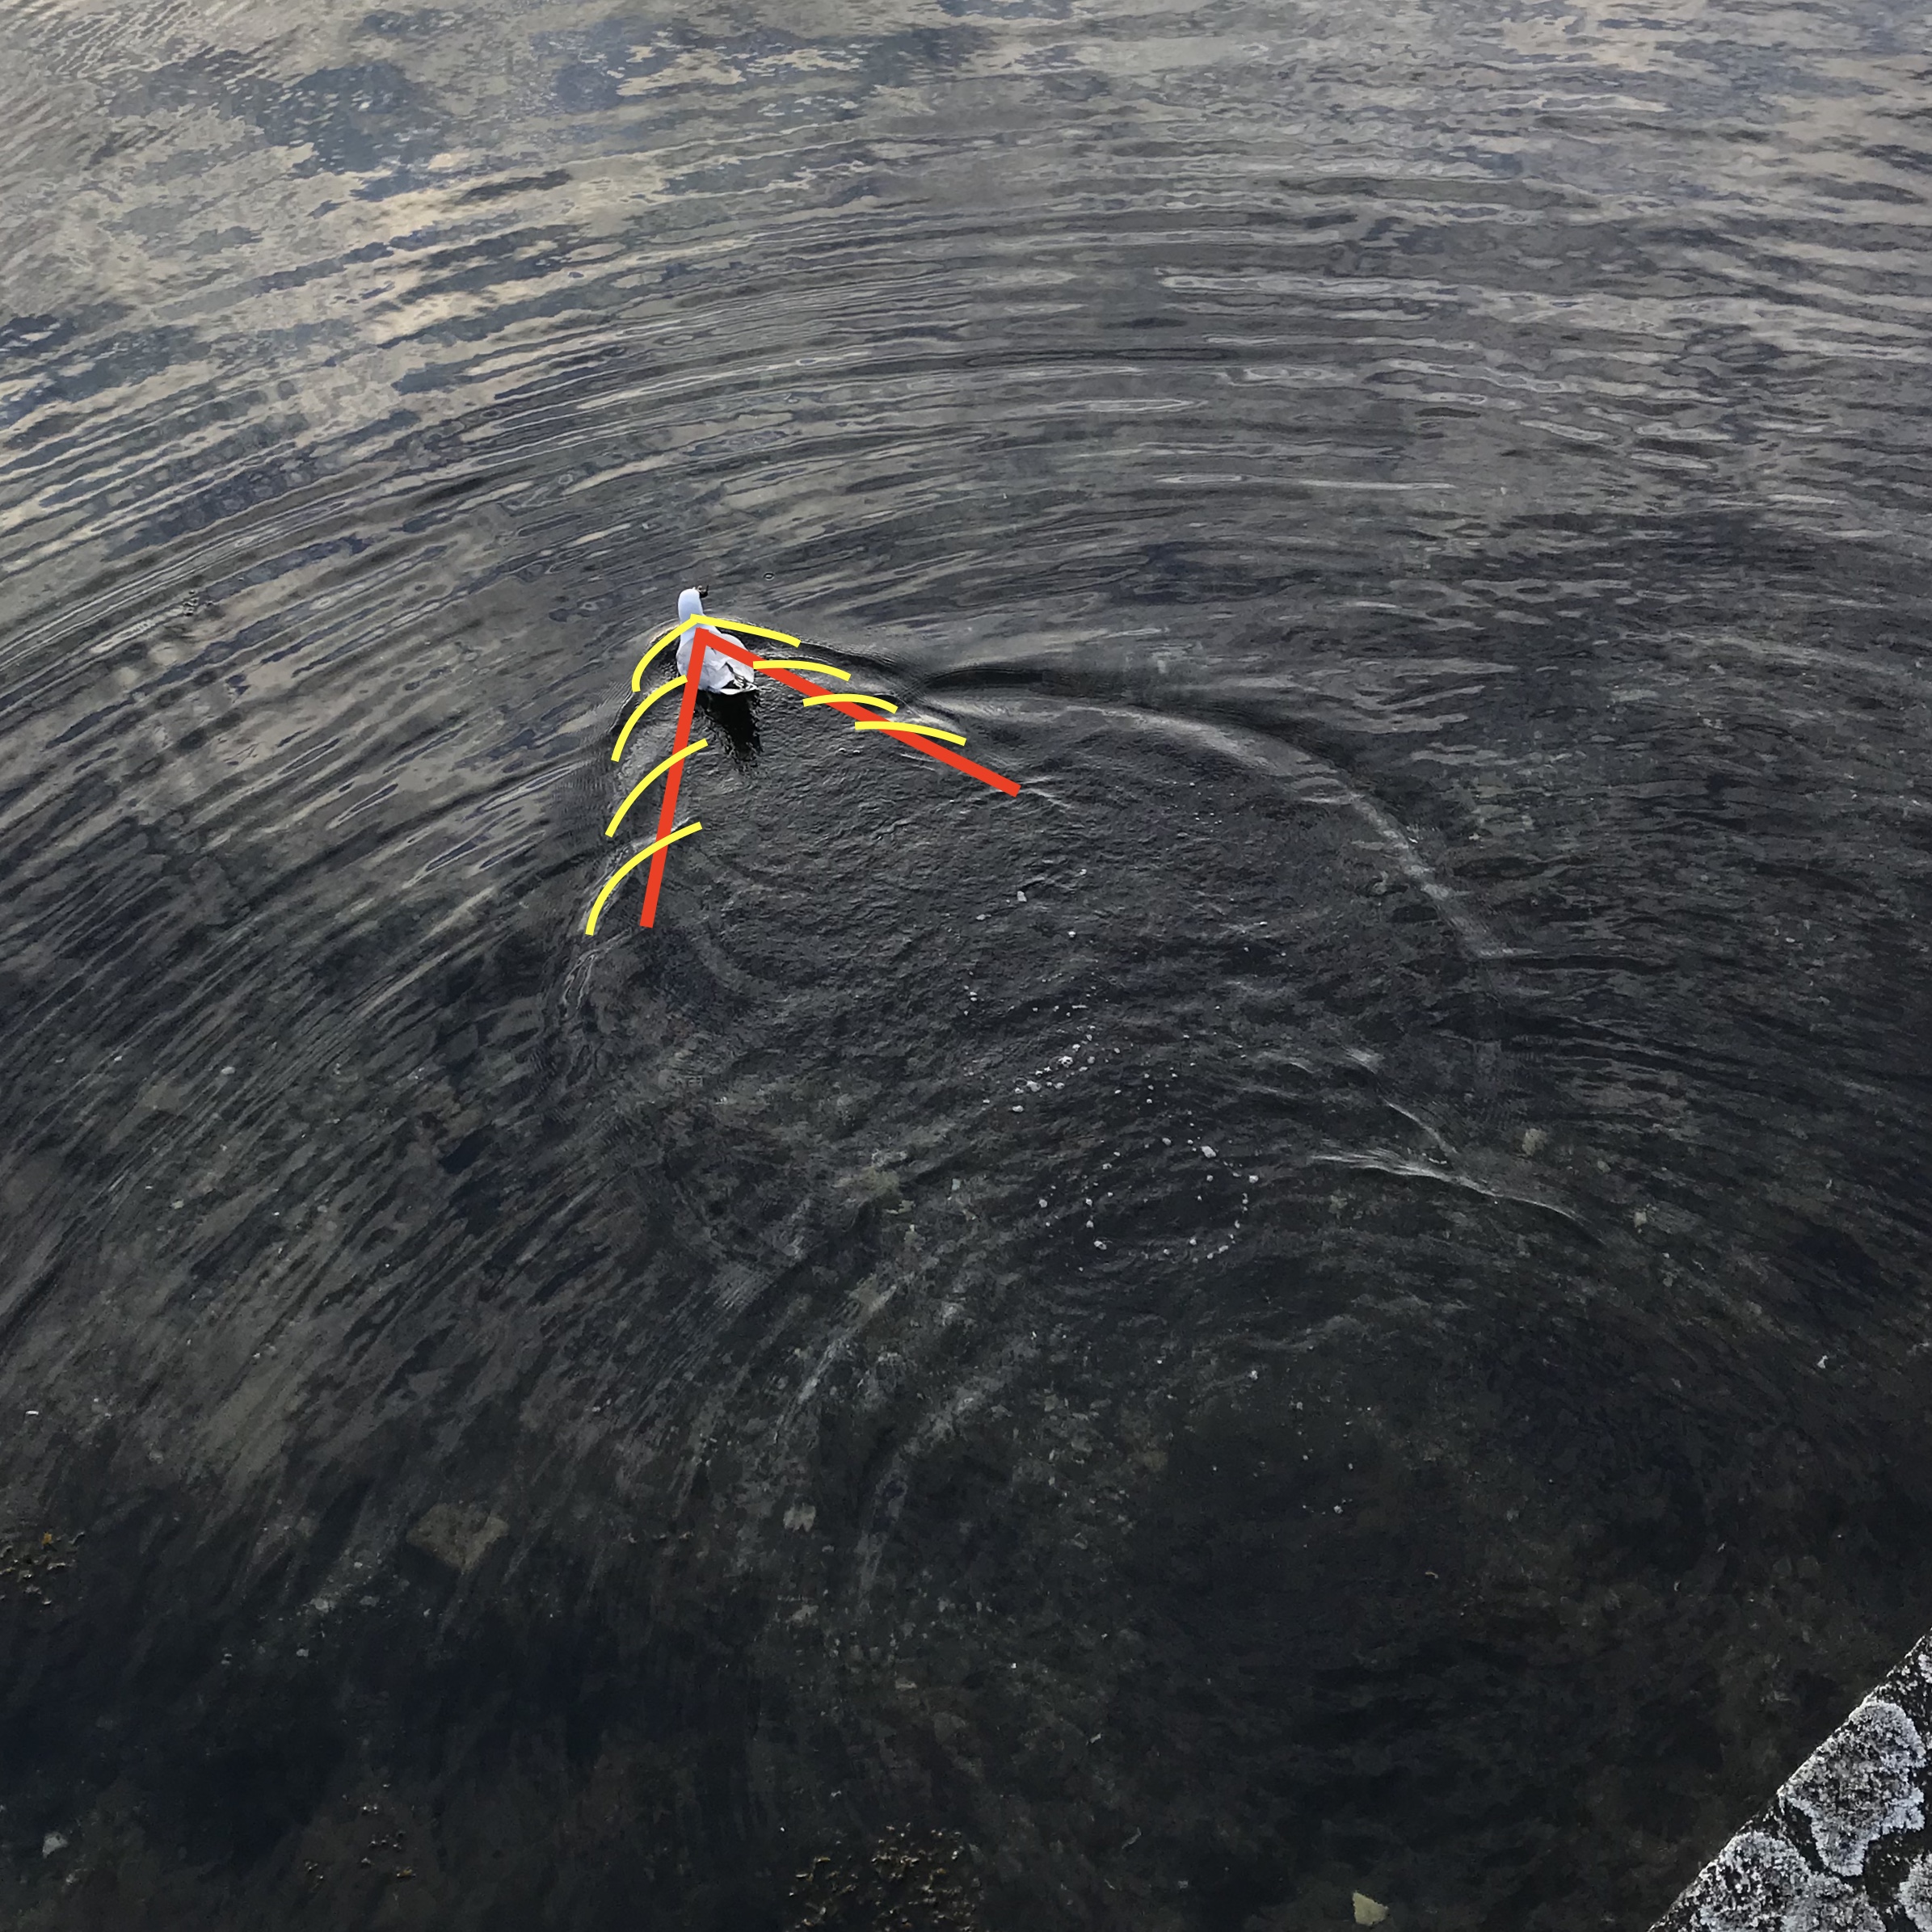
Once it was just swimming and not dipping in and out of the water, it begand to develop a regular, v-shaped wake (red V) that consists of individual “feathers” or wakelets (yellow).

It continued swimming away, albeit taking a little turn…

You still see the green waves from where it was sitting originally, and then the red waves from where it landed and swam away on the path marked by the red arrow.

This kind of stuff makes me so happy! :-)

From the waves in the picture below, can you tell me what that seagull did before the picture was taken?

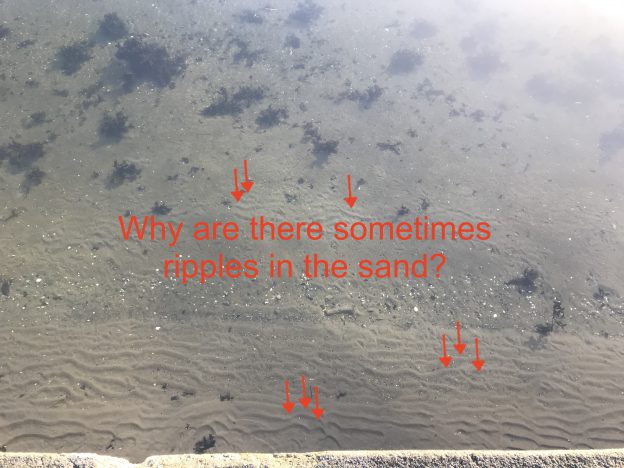
Sand ripples. Why do they form in the exact way they do?

It has been bugging me for a while that on days where there isn’t a lot going on in terms of regular wave watching, I often see ripples in the sand and don’t understand what’s determining their wavelength, their shape, everything about them. So what better use of a quarantine weekend than to browse old pics, and do a literature search to try and figure out what’s going on?

There surely is a “wave ripple 101” textbook out there somewhere, but I didn’t find it (even though I know fossilized wave ripples are sometimes used to draw conclusions about prehistoric wave regimes and stuff, so there MUST be textbooks on this? What search term am I missing?), so I had to make sense of the information I did find. If you know better or know where to find better information, please let me know!

How sand ripples form in a current

Basically like waves form in water, except without the help of surface tension.

When water is moving relative to a sandy bottom, there is a critical speed at which sand grains are going to start moving with the current. Currents faster than that speed are going to erode the sea floor, taking sand with it, currents slower will allow sand to fall out of the current and settle.

Imagine a current over a sandy bottom. If the bottom isn’t completely flat but there is a tiny imperfection somewhere, this will influence the bottom current: speeding it up the higher the bump is (i.e. the smaller the cross section of the current becomes) and slowing it down when the cross section widens again (see here for the classical fluid dynamics Venturi tube experiment that shows exactly that). So a current flowing over a bump will be sped up. Looking closely at the bump, it has an asymmetric profile: A gradual incline on the upstream side (apparently called the “stoss side”) and a steep drop on the lee side. Sand is being eroded from the upstream side where the current is strong, and being deposited on the lee side where the current is weak, thus slowly moving the bump forward.

In slower currents, sand grains are being rolled up the upstream slope of the ripple, are pushed over the edge and tumble down on the other side. In faster currents, an eddy is going to form downstream of the bump, similar to a lee water in a river, and grains are “flying” over this eddy and deposit on the stoss side of the next ripple.

How sand ripples form in waves

In the end, waves in shallow water (and they have to be in shallow water for the sea floor to feel their influence in the first place) are nothing else than alternating currents as the orbital movement within the waves is deformed into elipses with a back-and-forth current right at the bottom. So ripples in waves form in a similar way to ripples in currents, except that they are more symmetric and (probably?) don’t propagate.

What determines sand ripples’ wave length

I think this is what has been bugging me most for a long time, because I was trying to figure out some kind of dependency on wave length of the water waves or something, but now I think it’s actually quite simple (Please check out the disclaimer above…): I think it’s a mixture of grain size and current speed.

The influence of current speed

The faster the current, the longer the wavelength of the ripple. This makes sense since in stronger currents, grains are transported further away from the ripple they were erodet from until they deposit again and form the next ripple.

Stronger currents are probably linked to longer waves (with larger orbitals) and shallower water.

The influence of grain size

If sand grains are too small, they don’t form ripples (or they are just extremely flat). However, if the grains are more like stones, they are not moved into ripples anymore, either, but instead create a turbulent flow around them. But for the happy medium in between, I think the larger the grain, the larger the ripple (both in length and in amplitude).

Of course, it’s not only grain size, it’s also tons of other factors like grain shape (that will influence cohesion between grains) or bio growth like bacterial mats, that will also make it more difficult for grains to be moved.

Finally! Looking at ripples

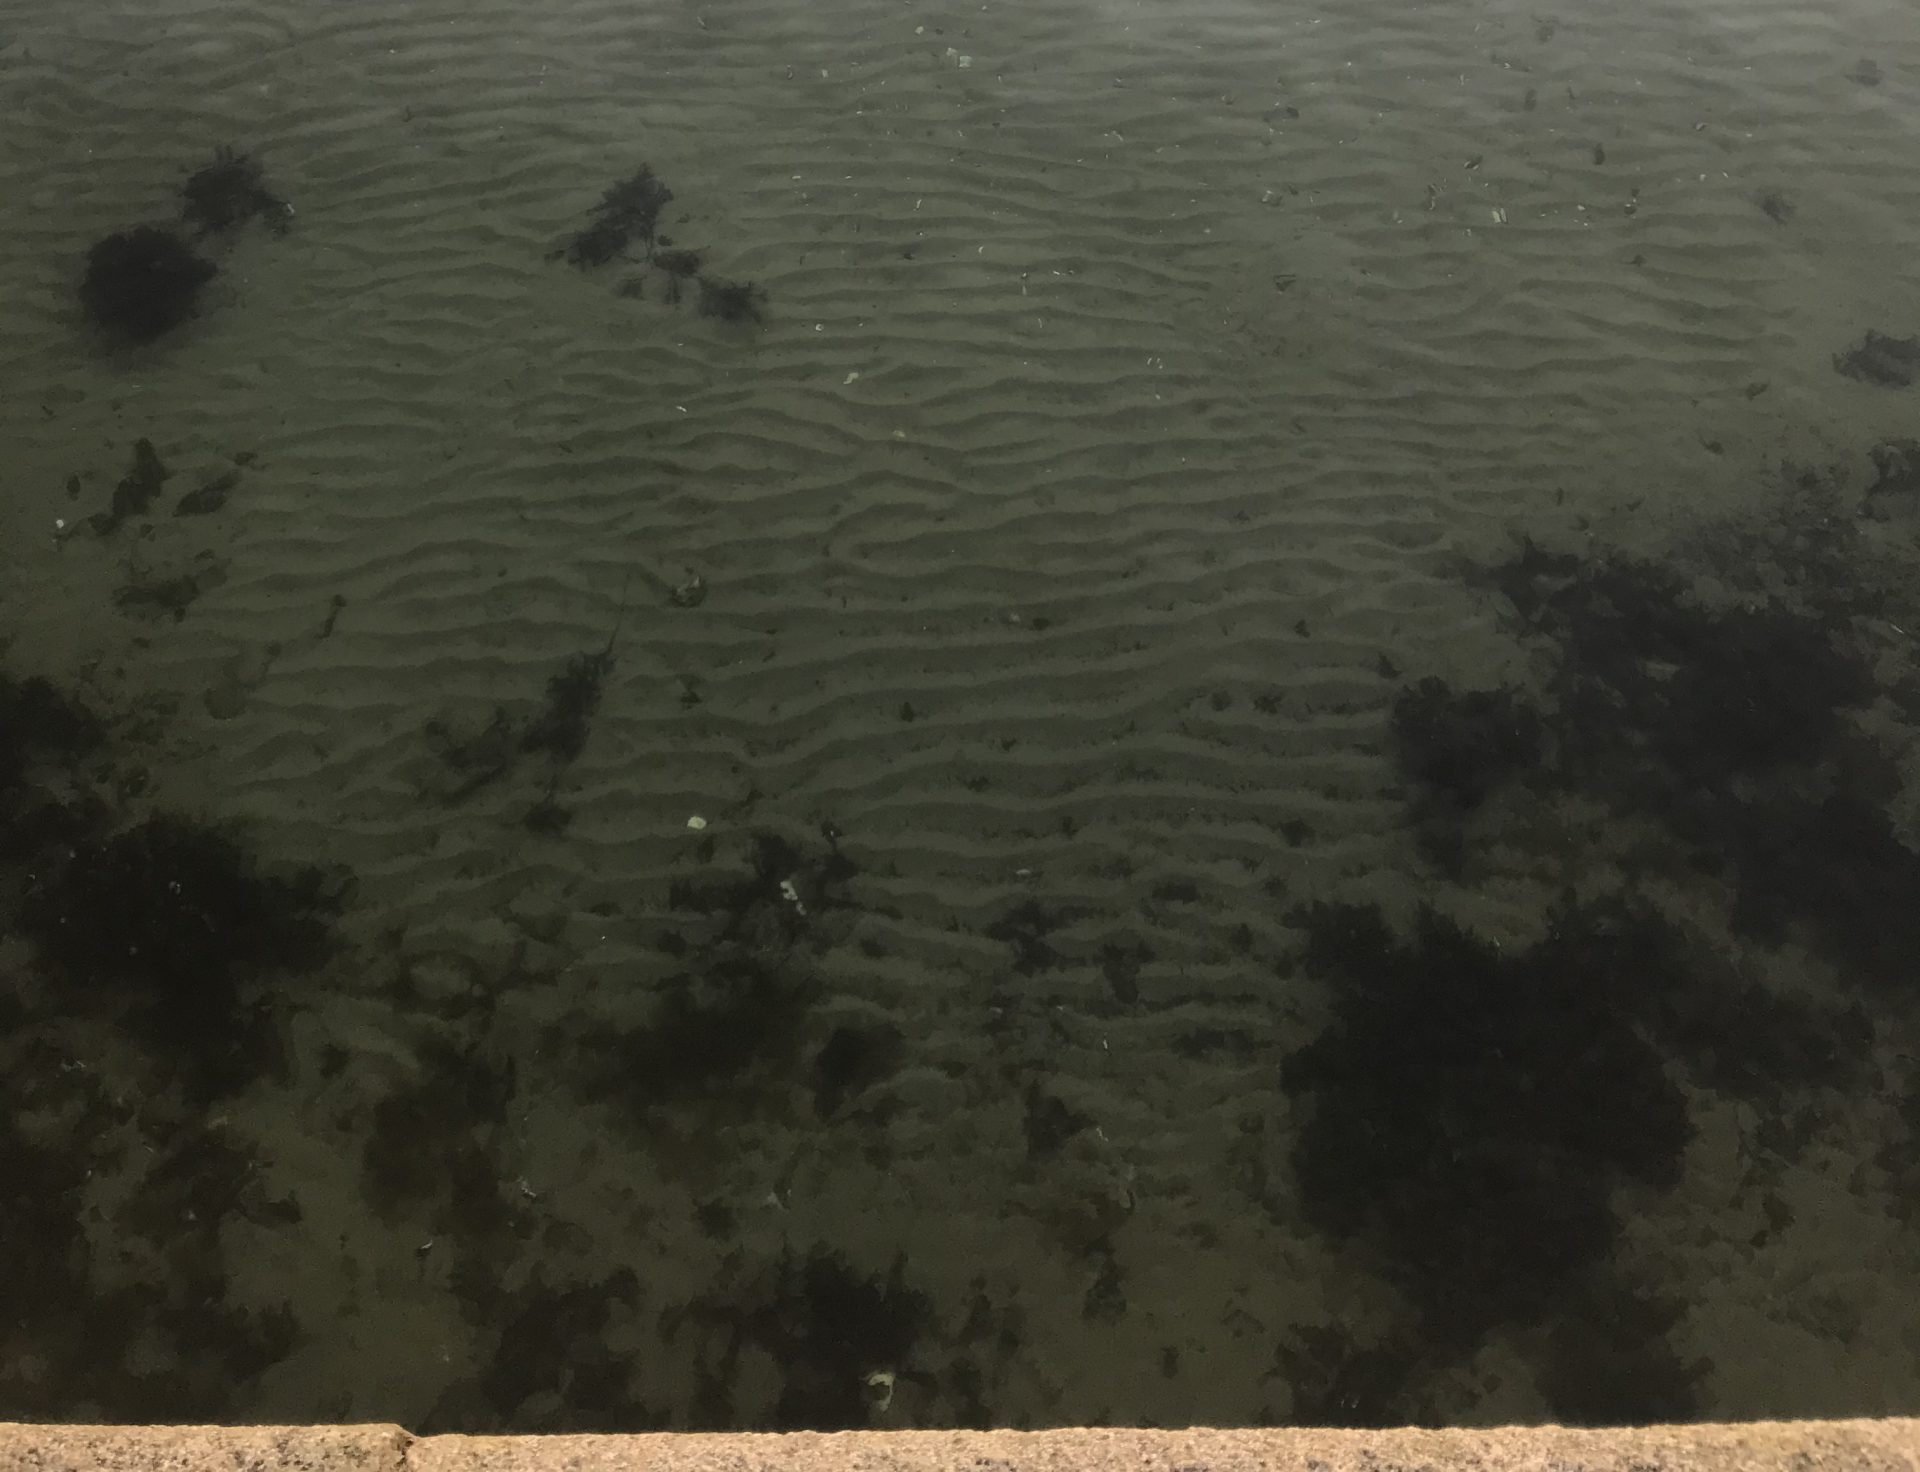
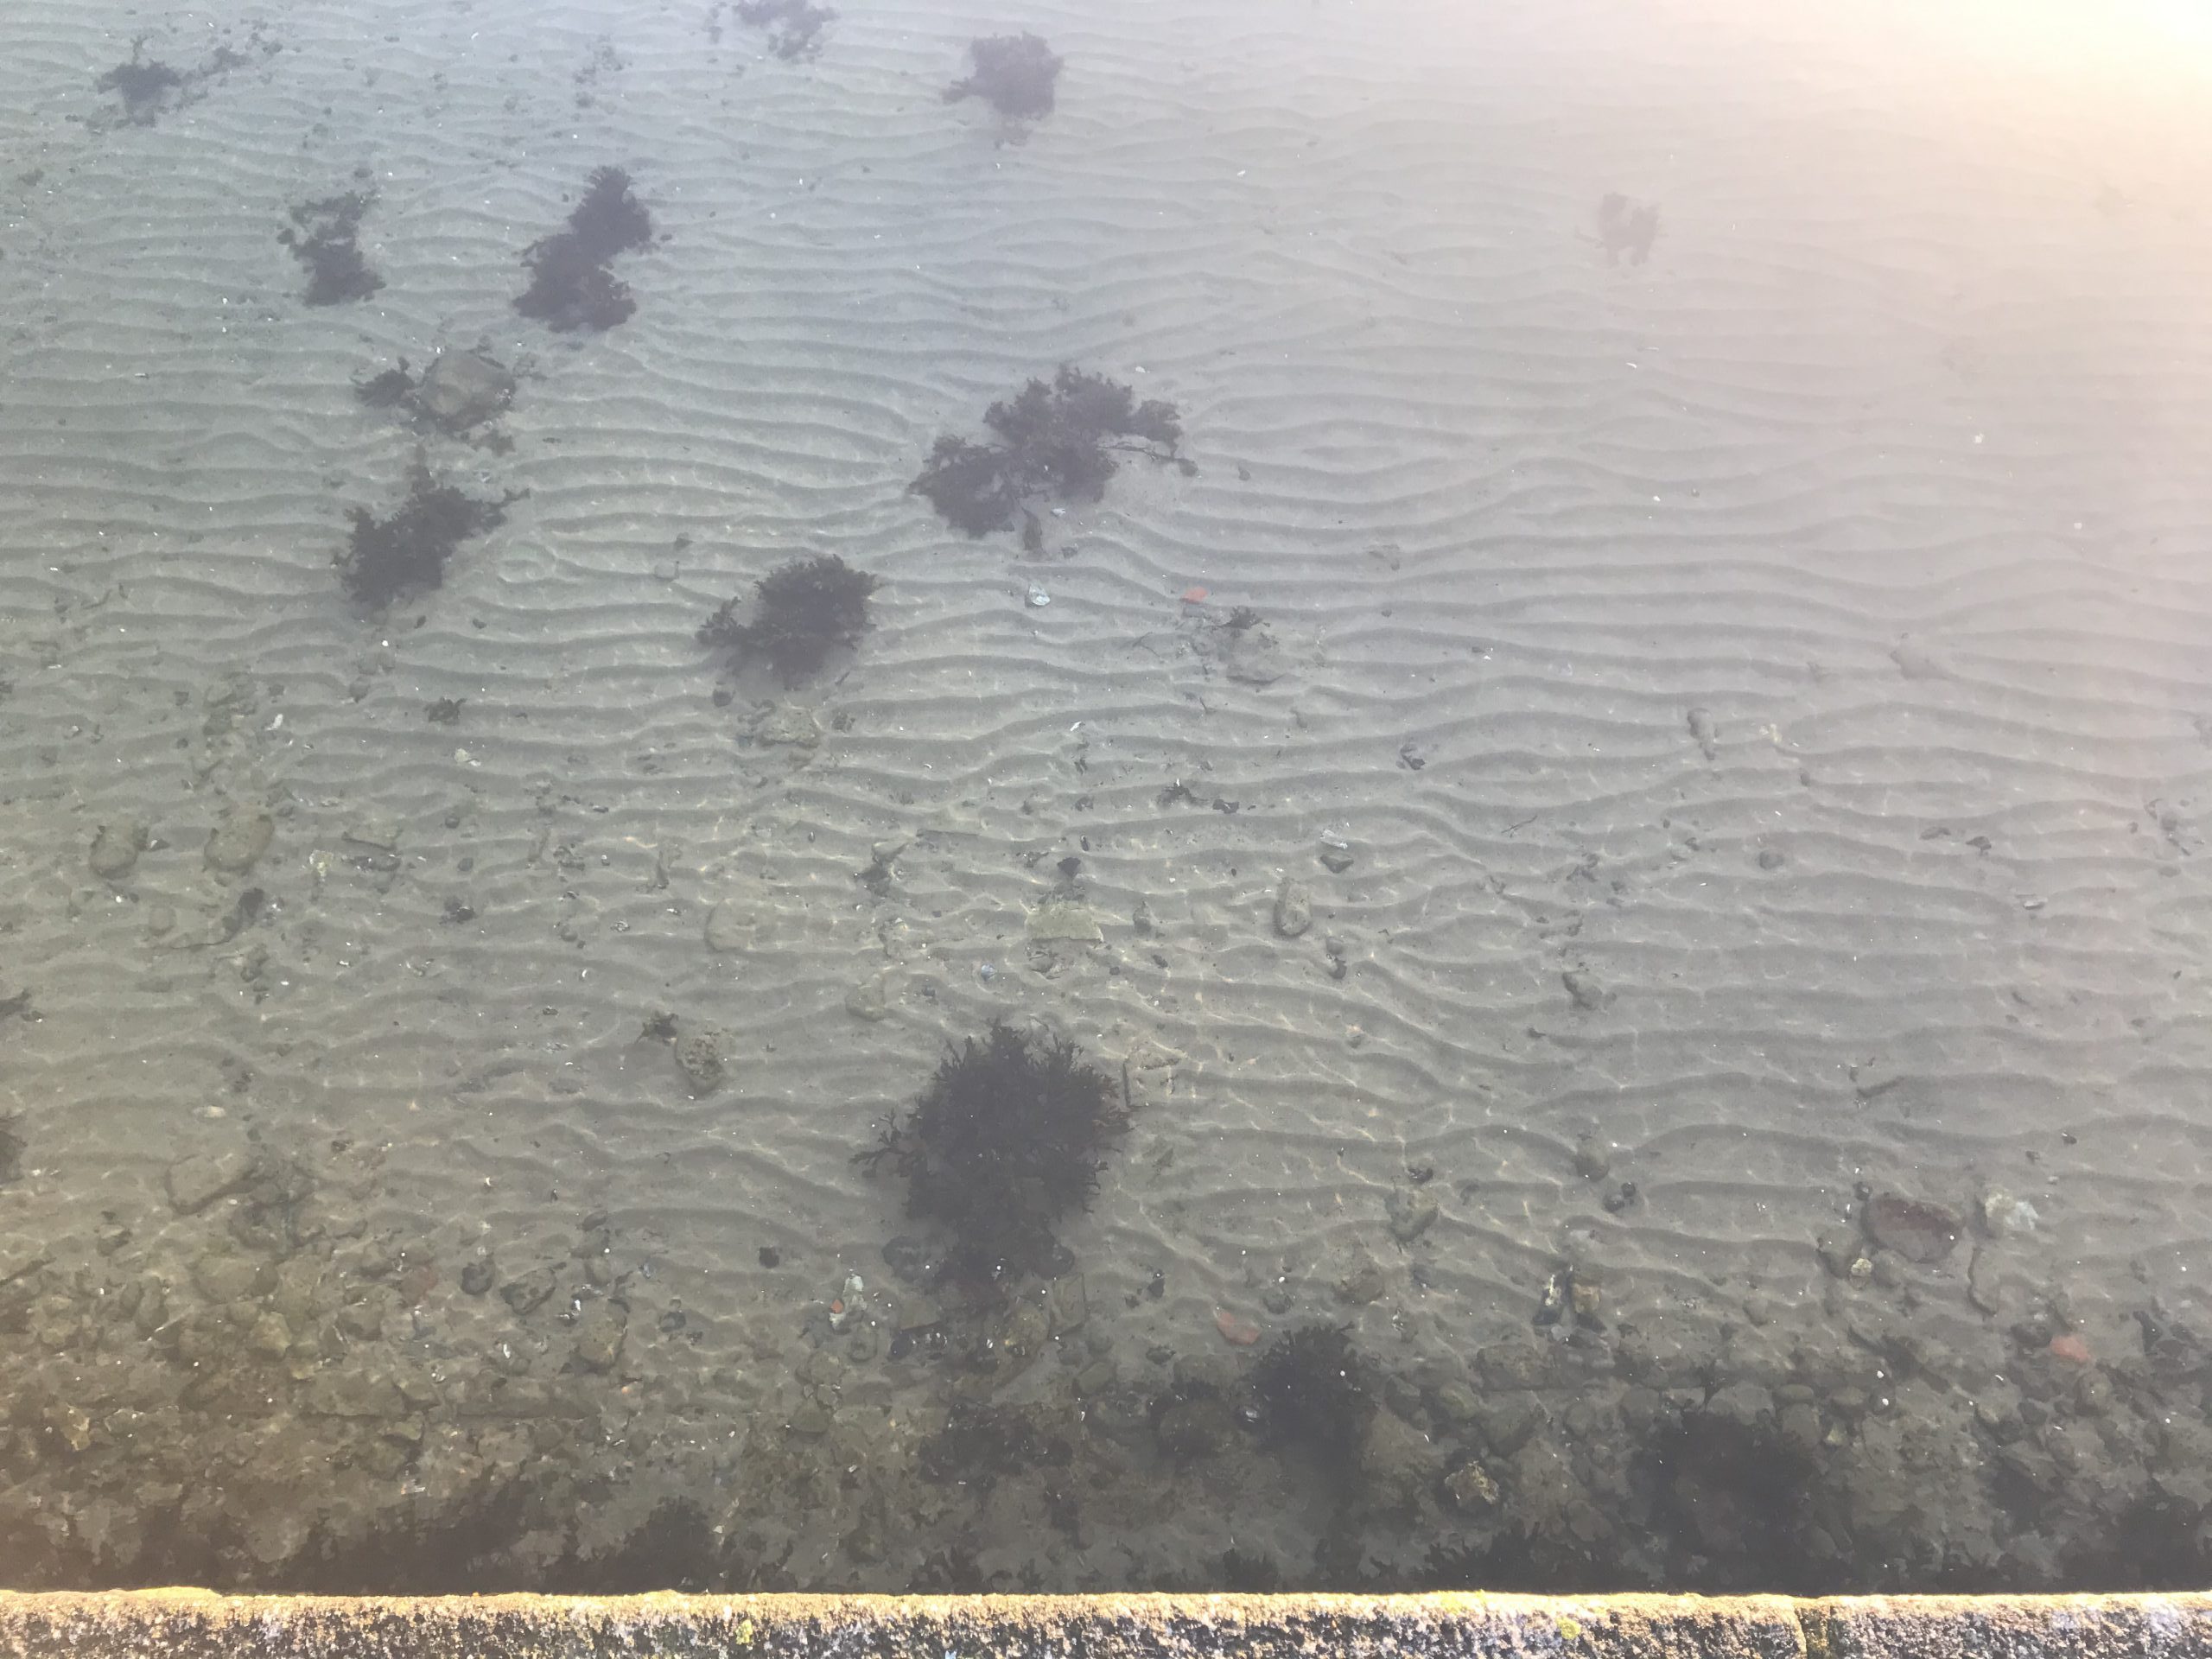
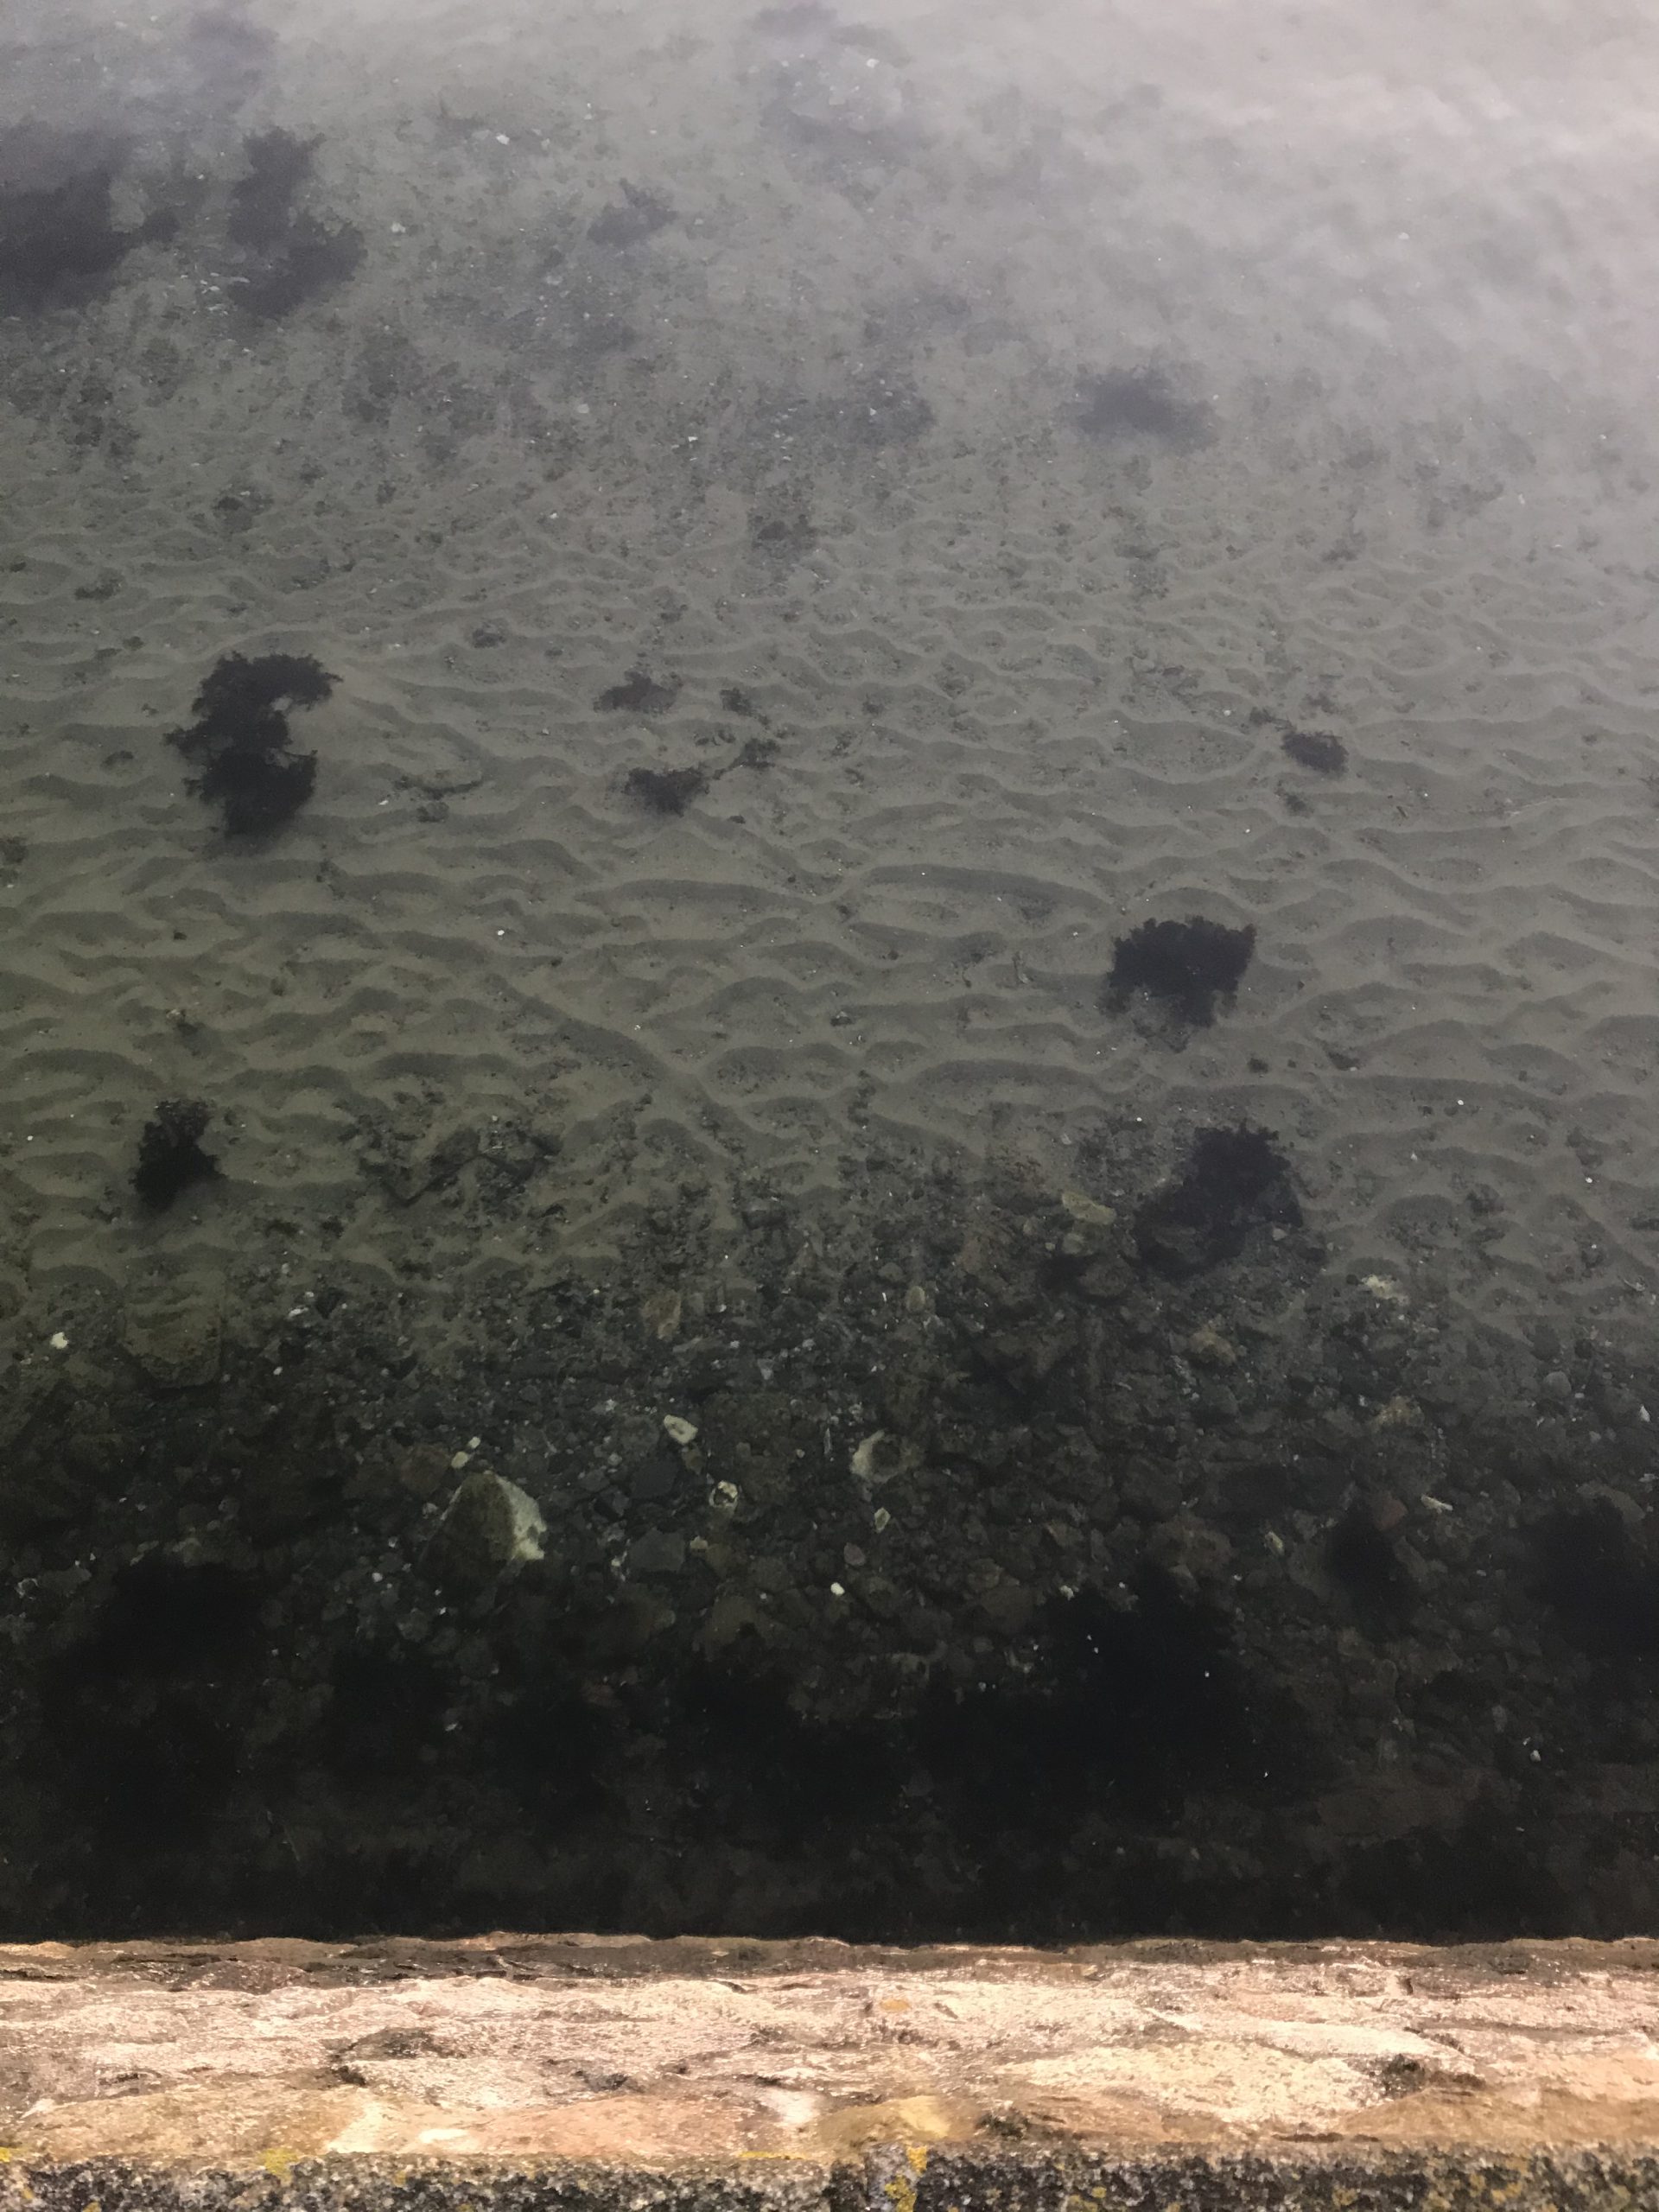
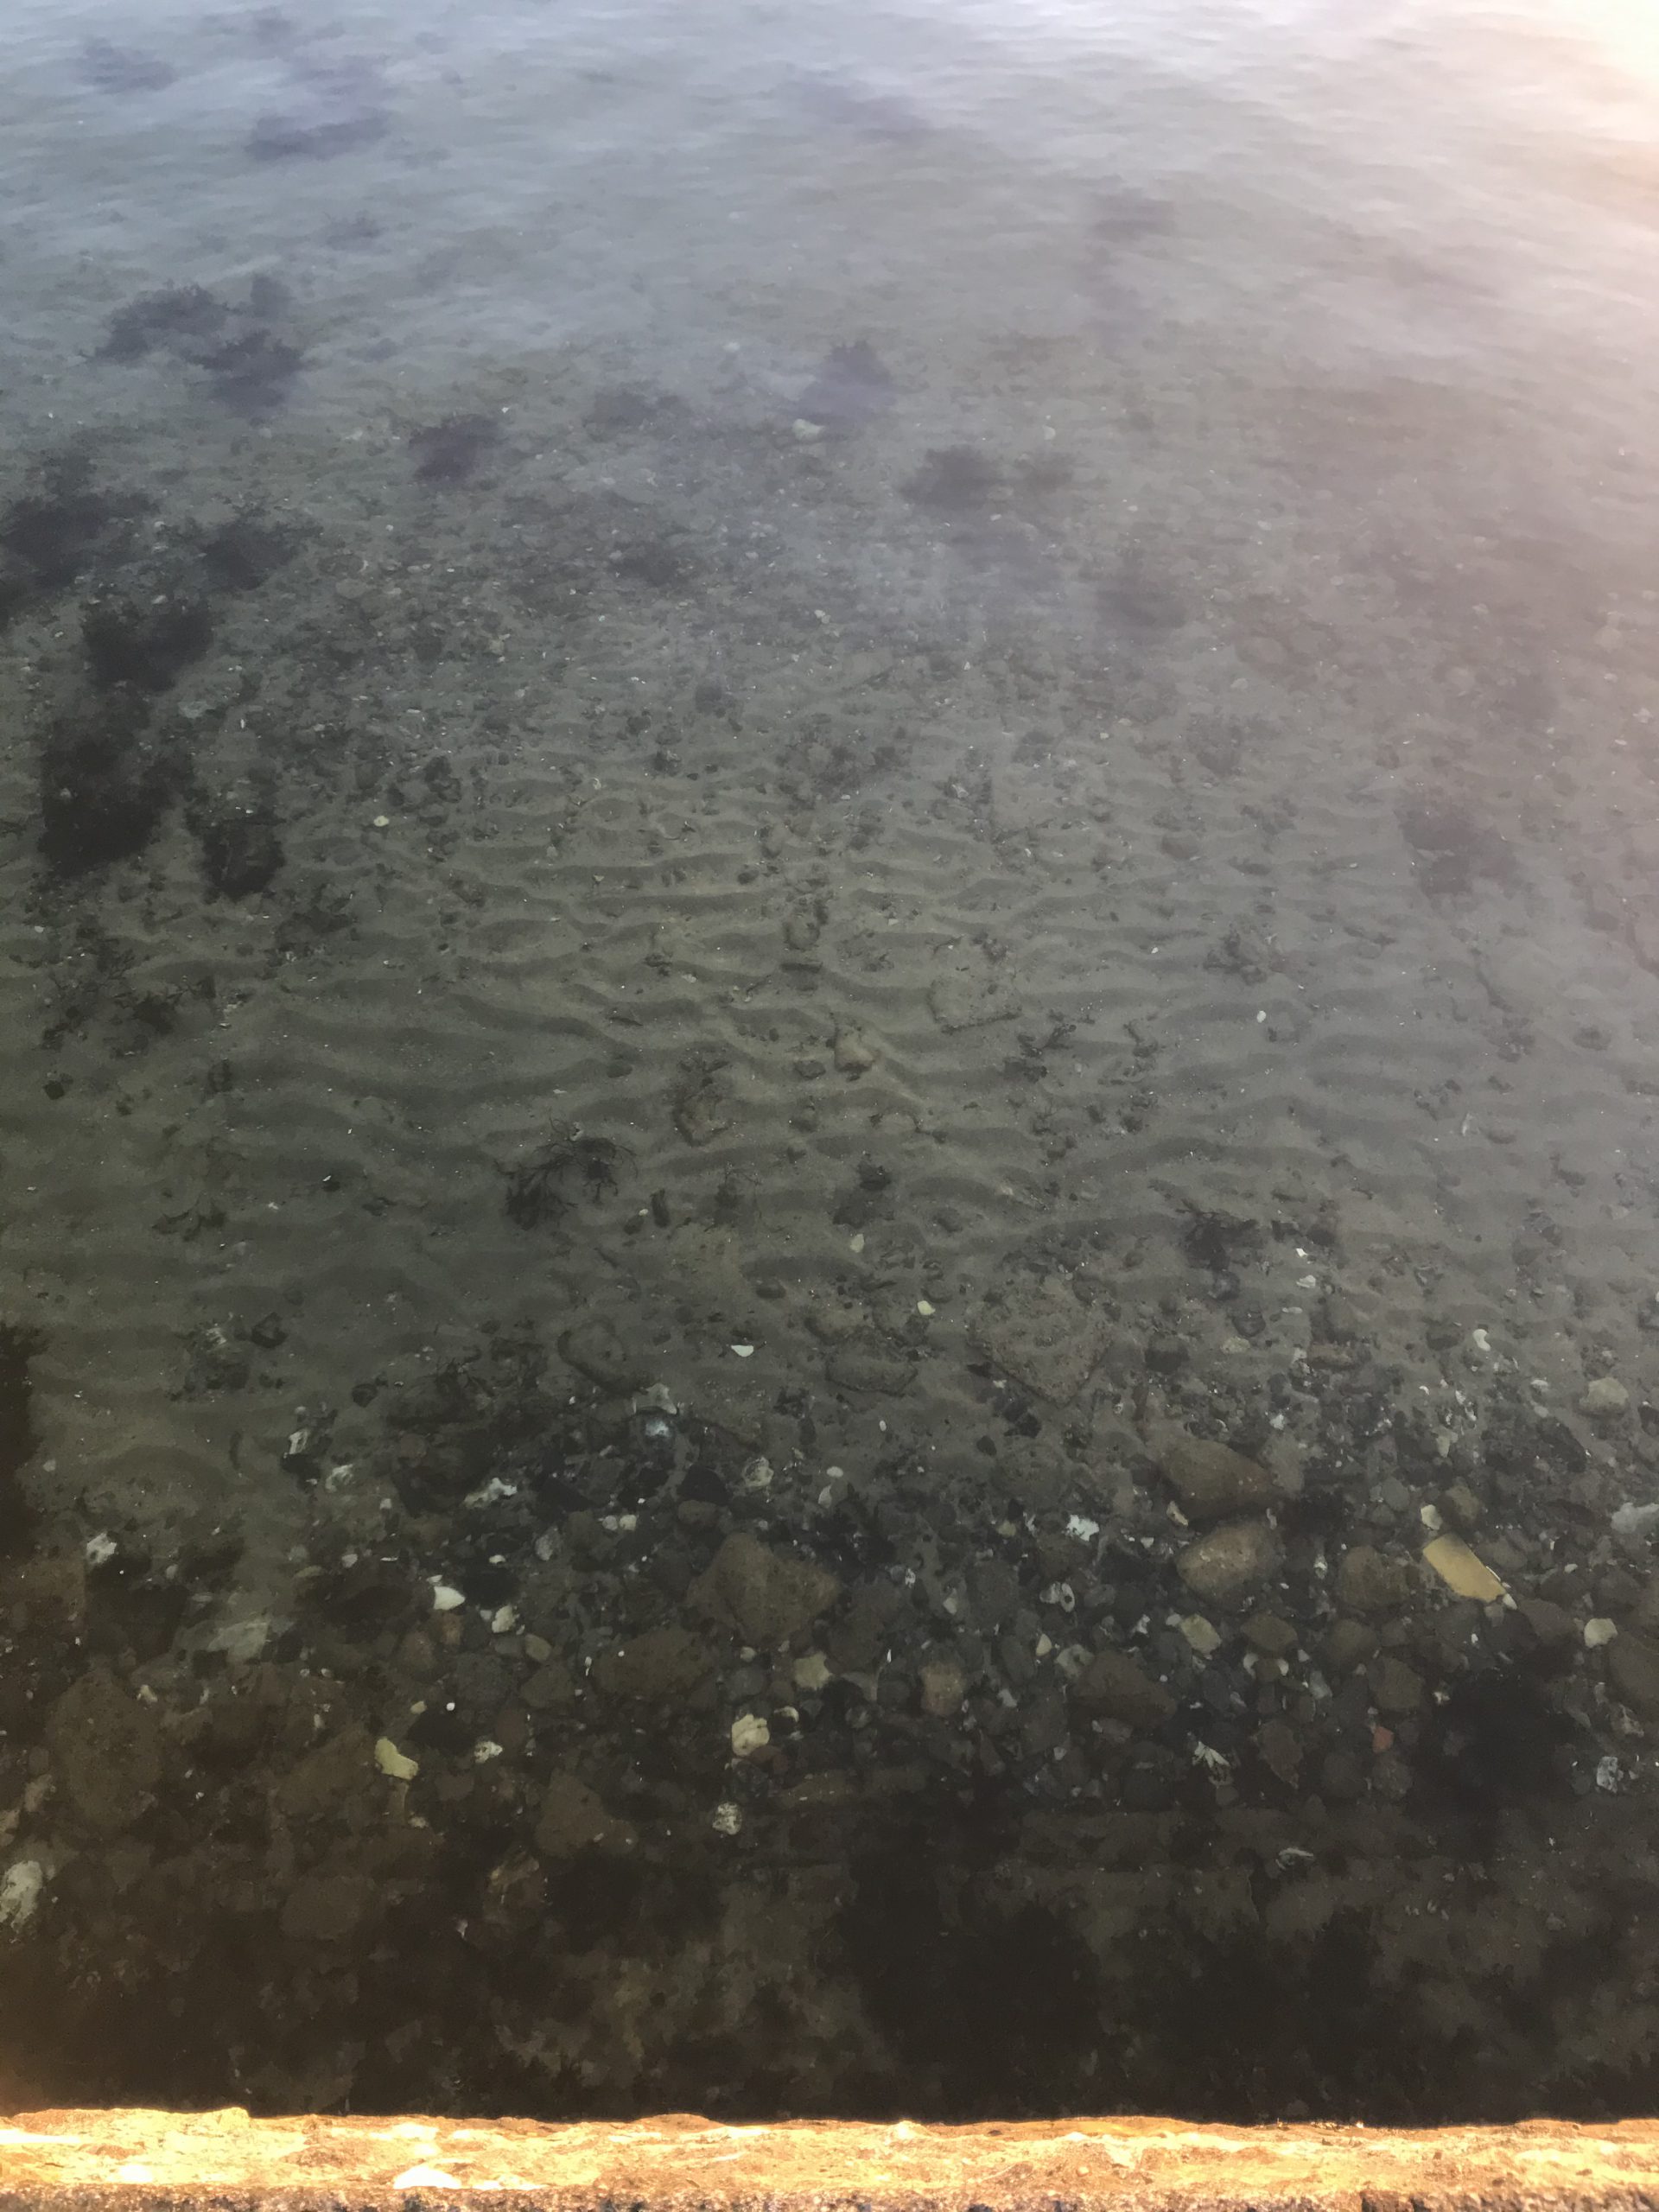
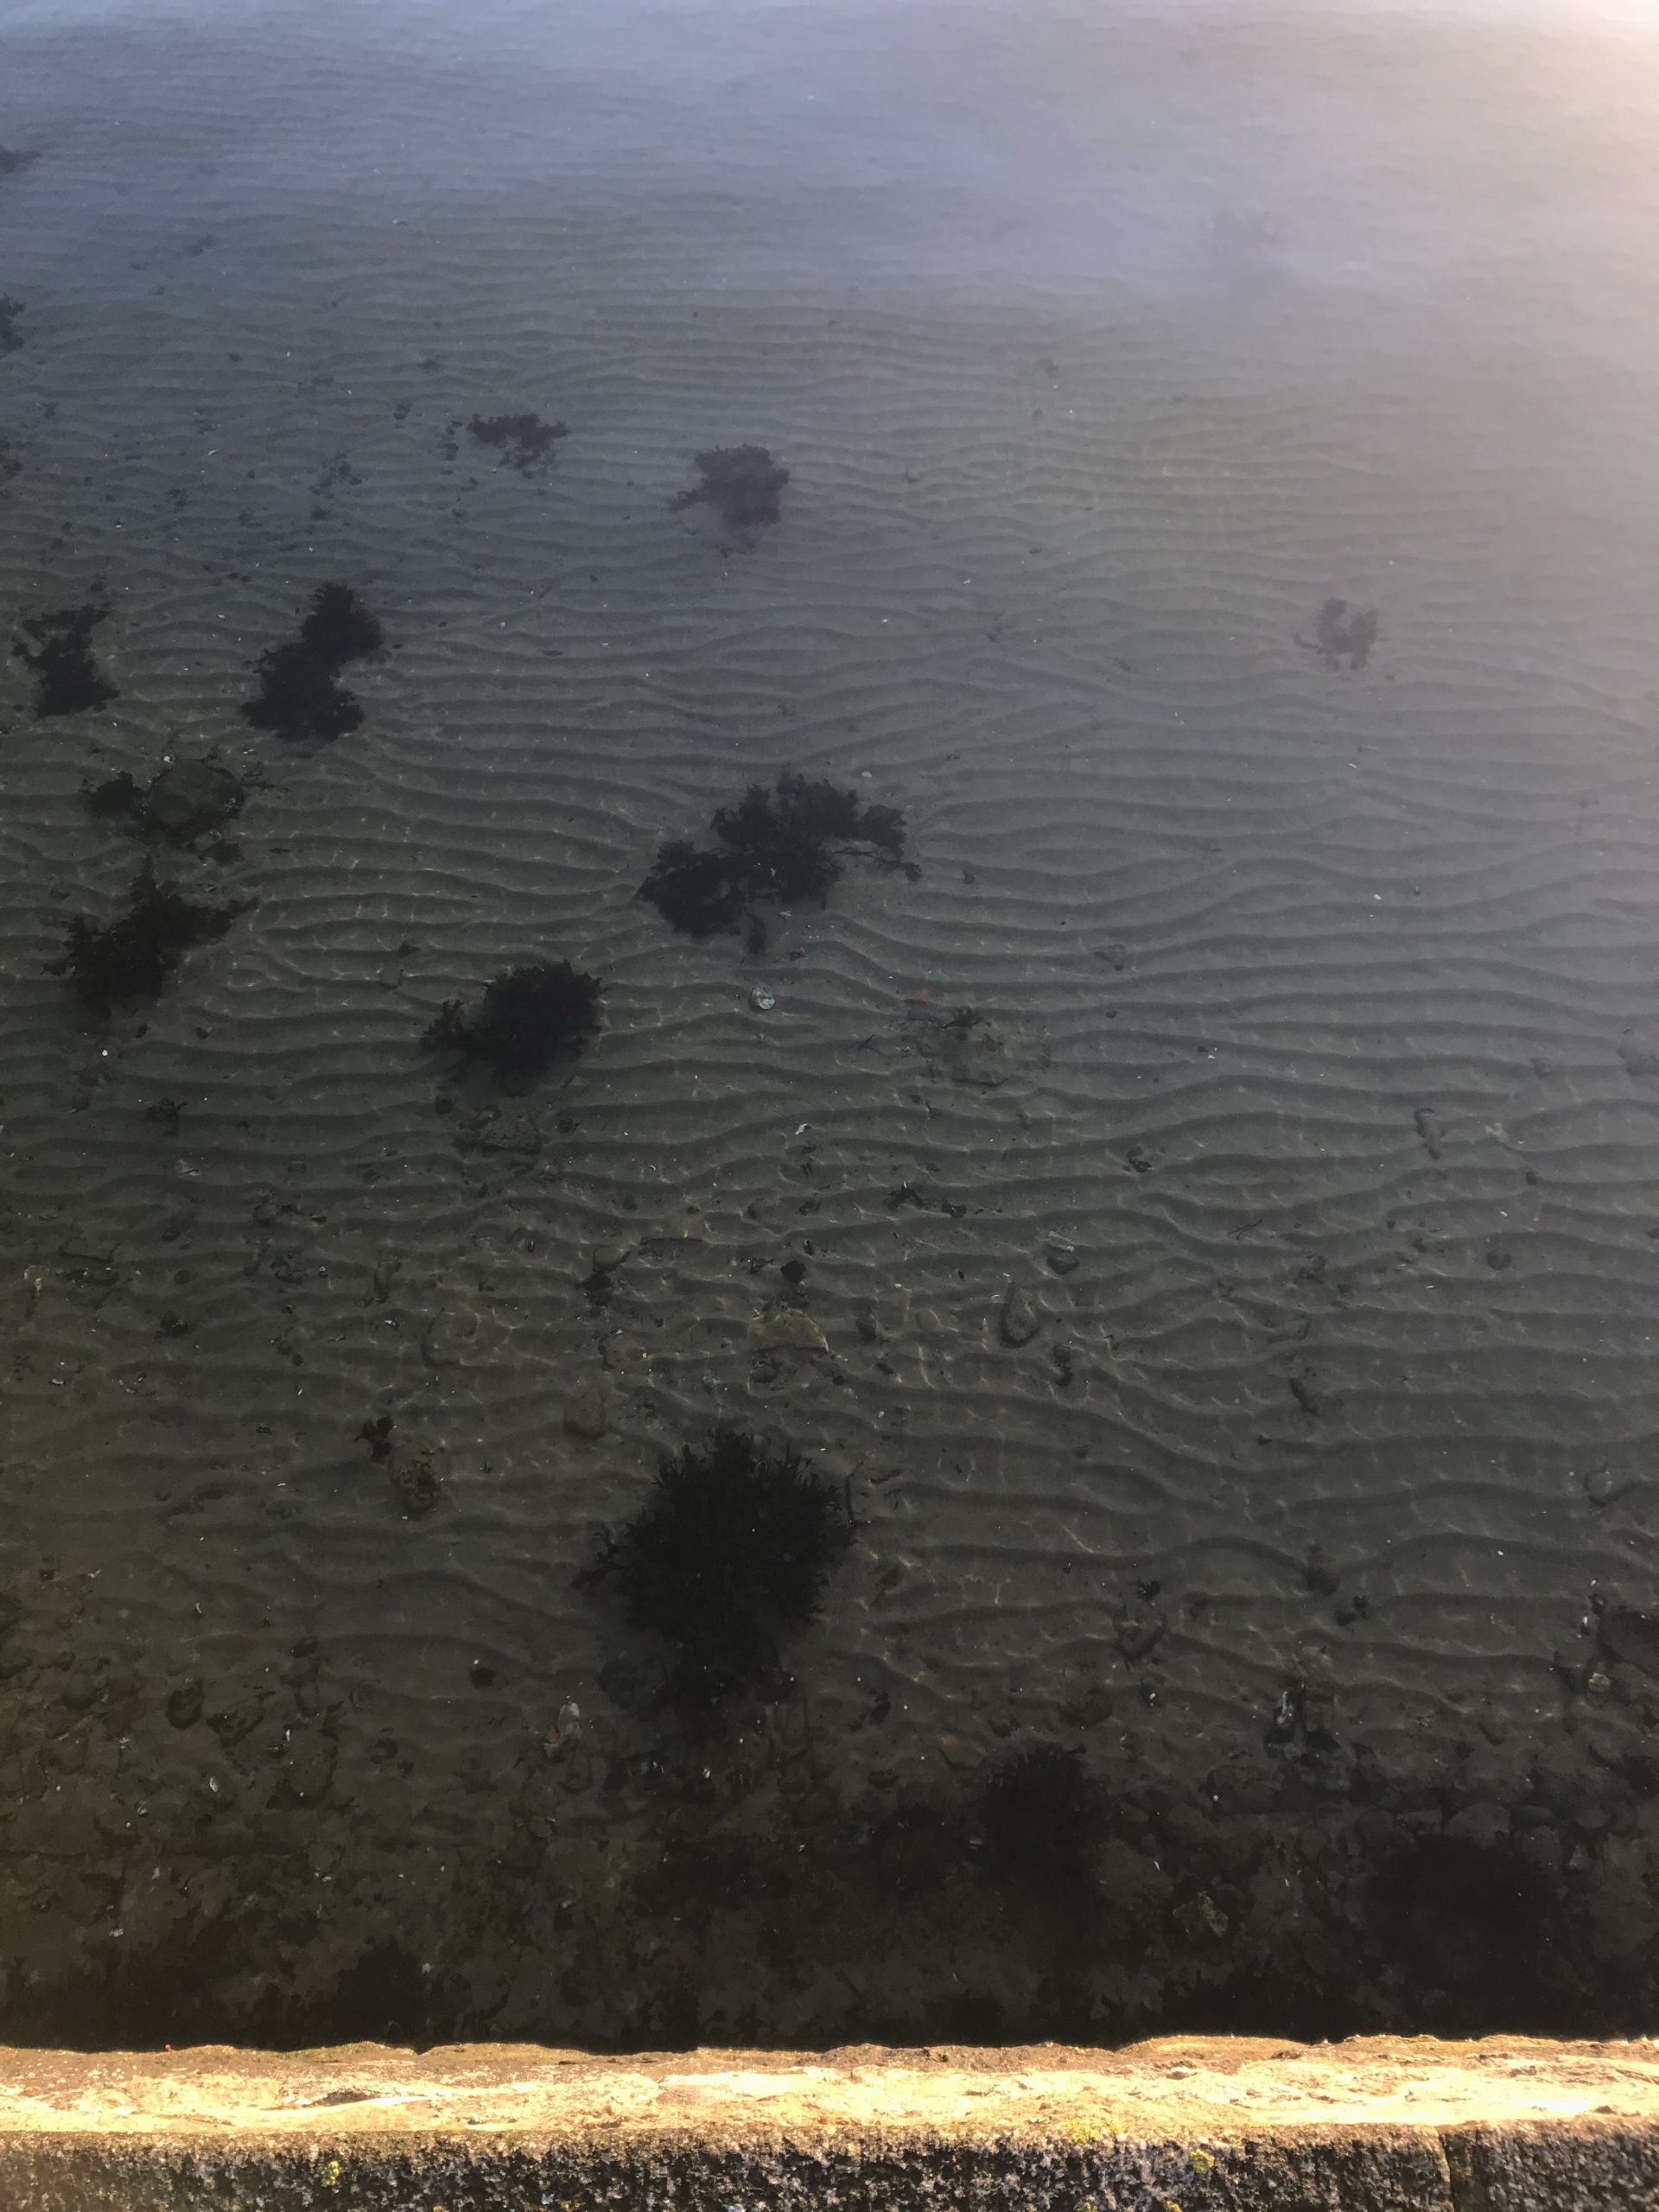
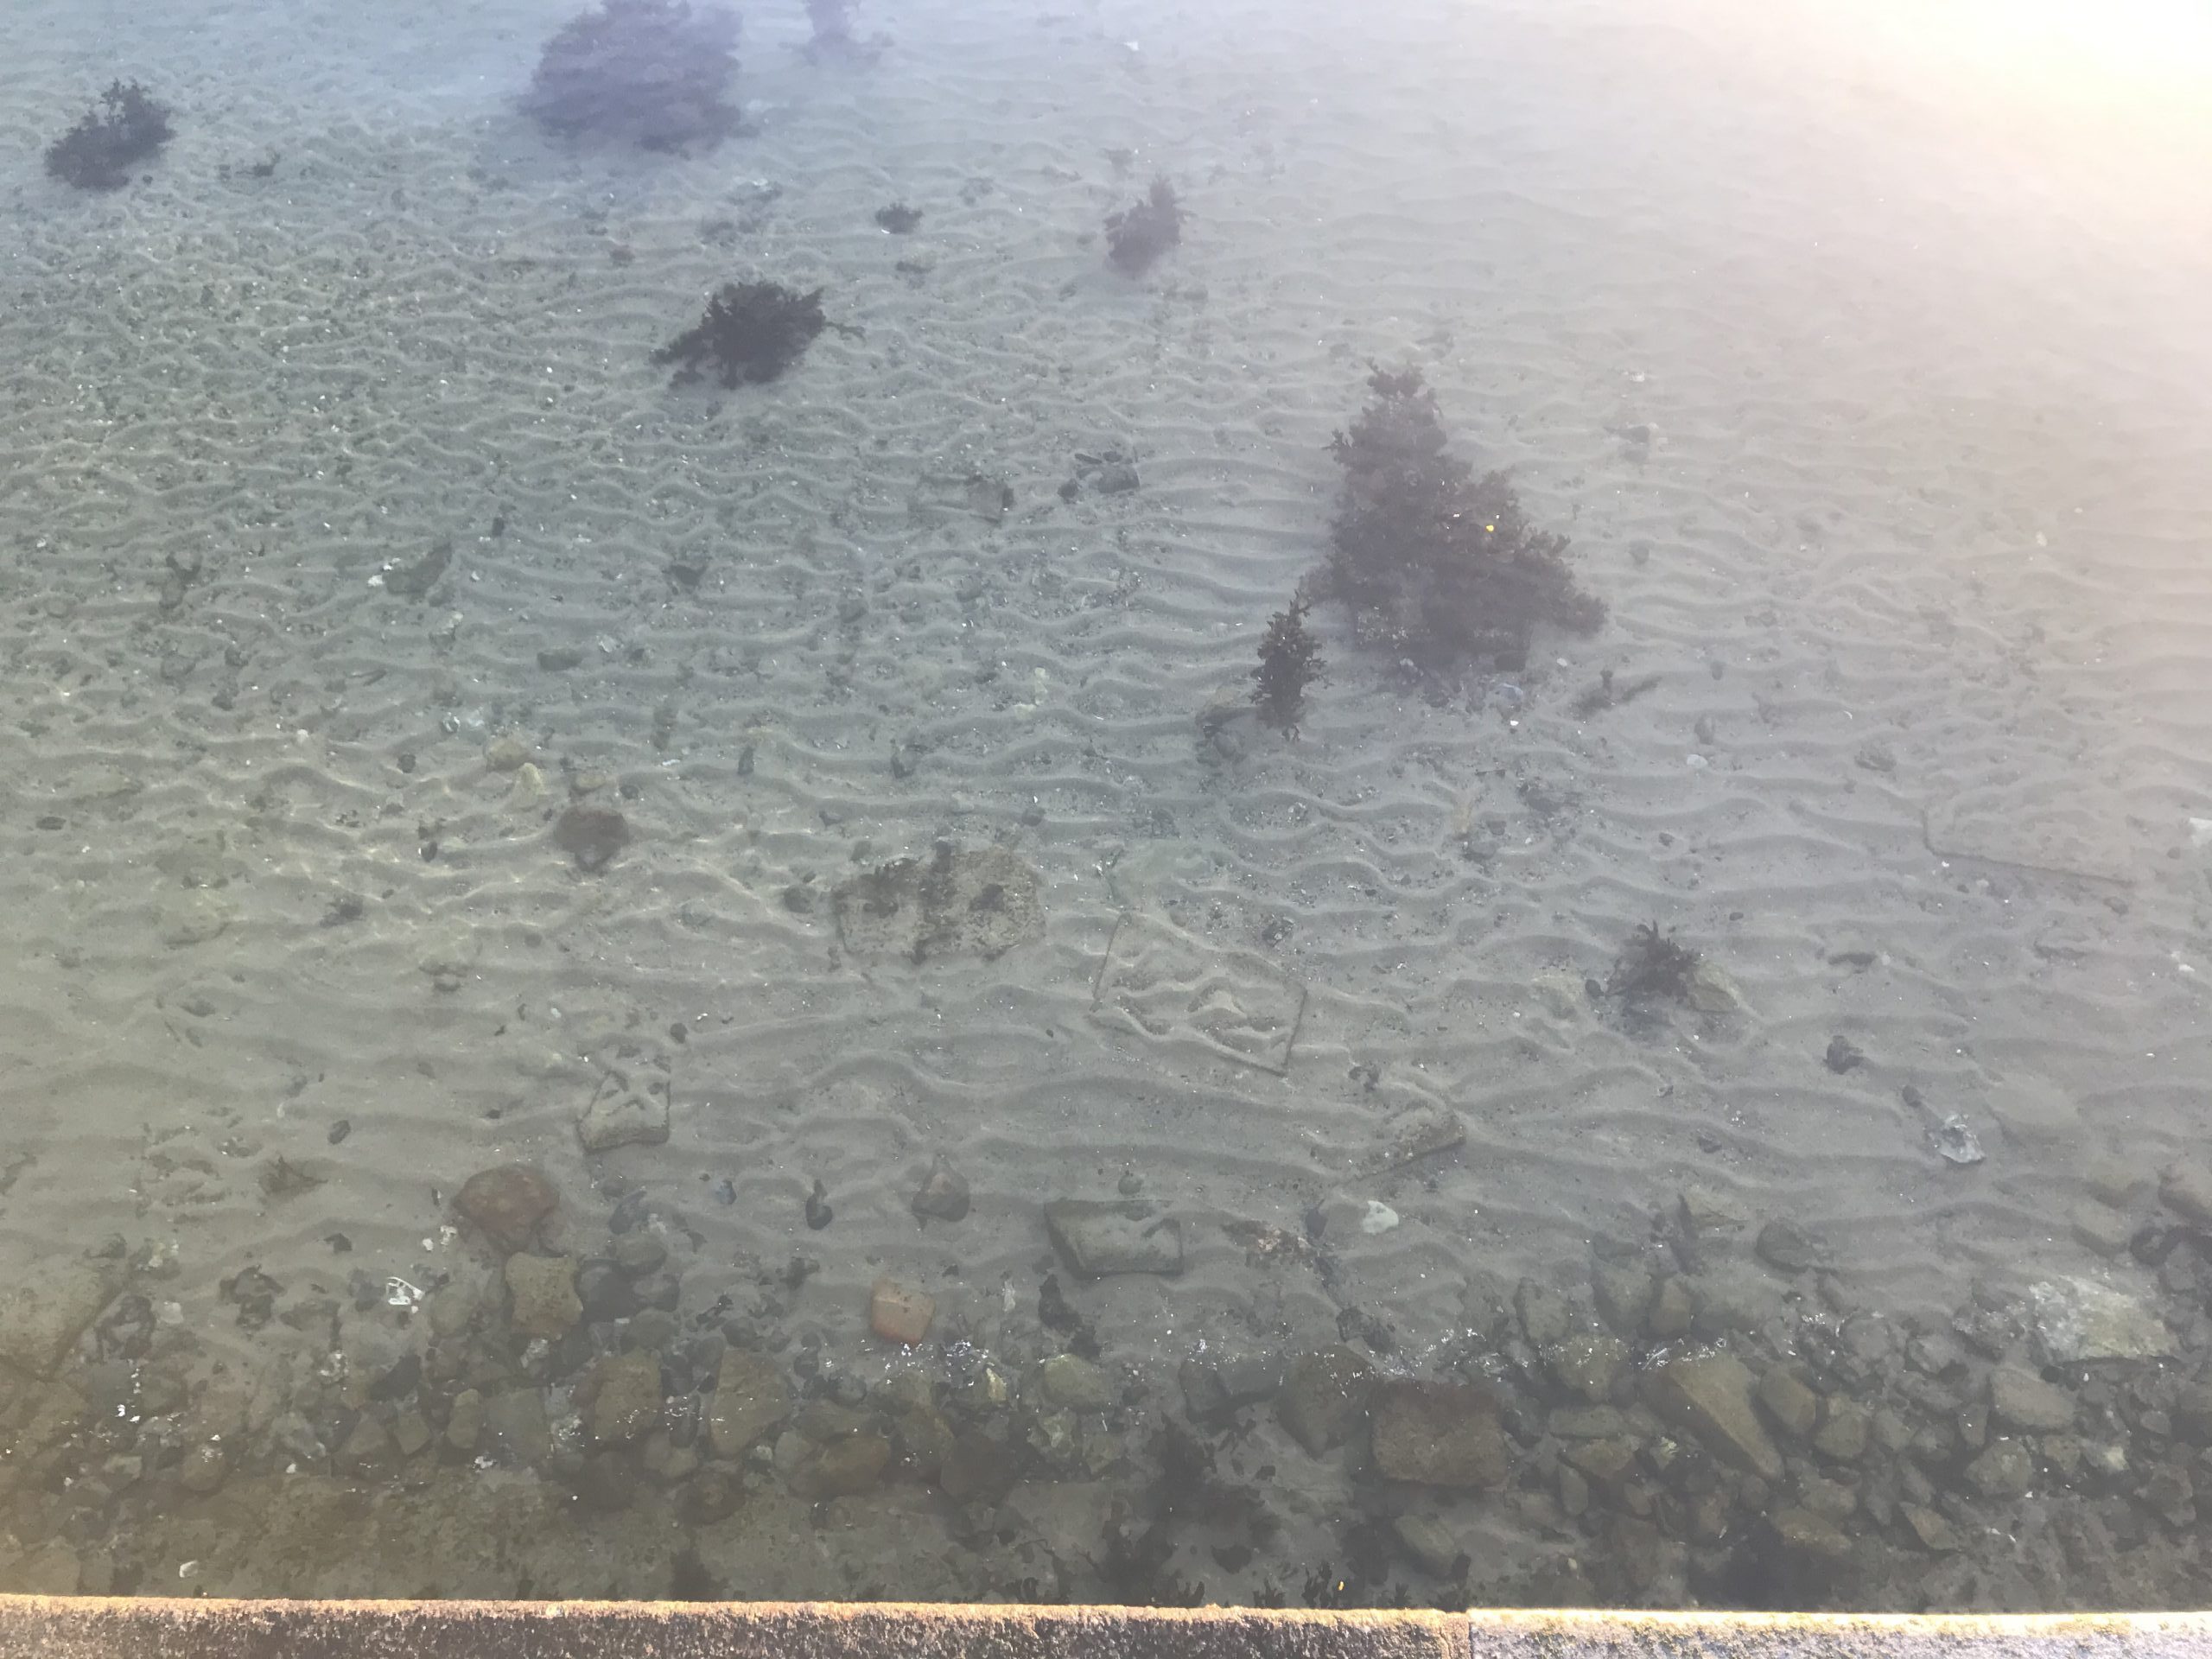
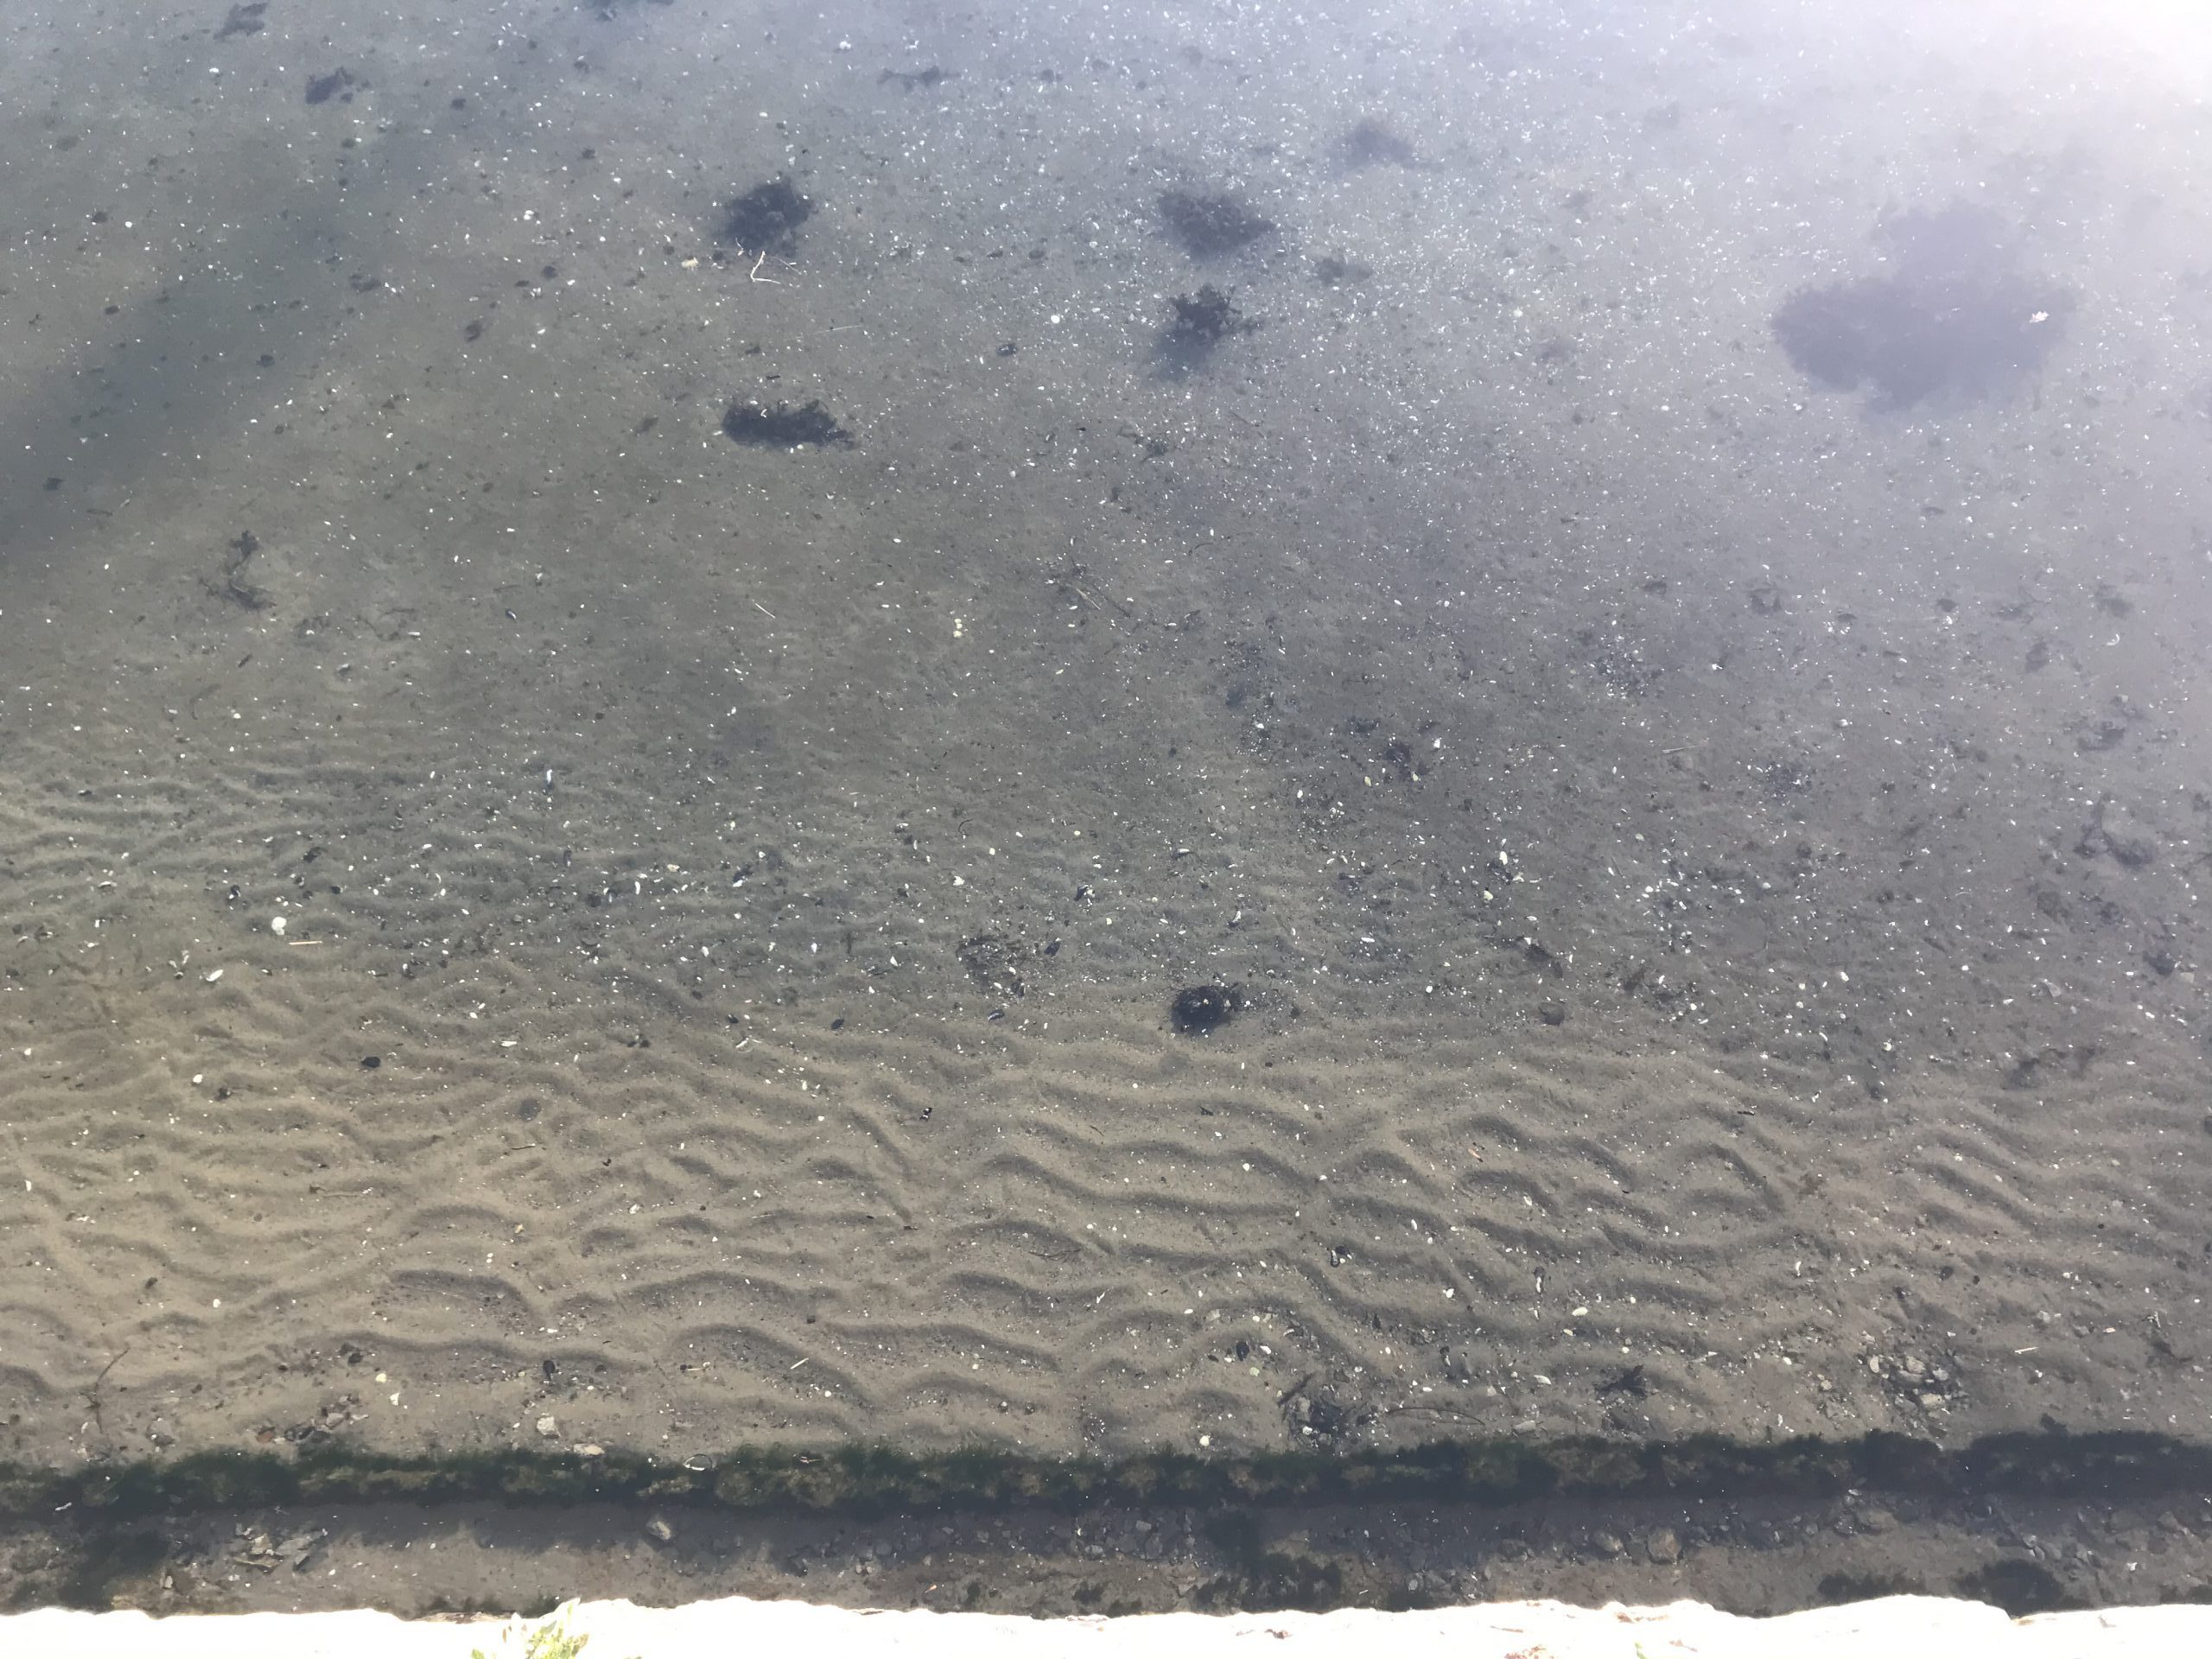
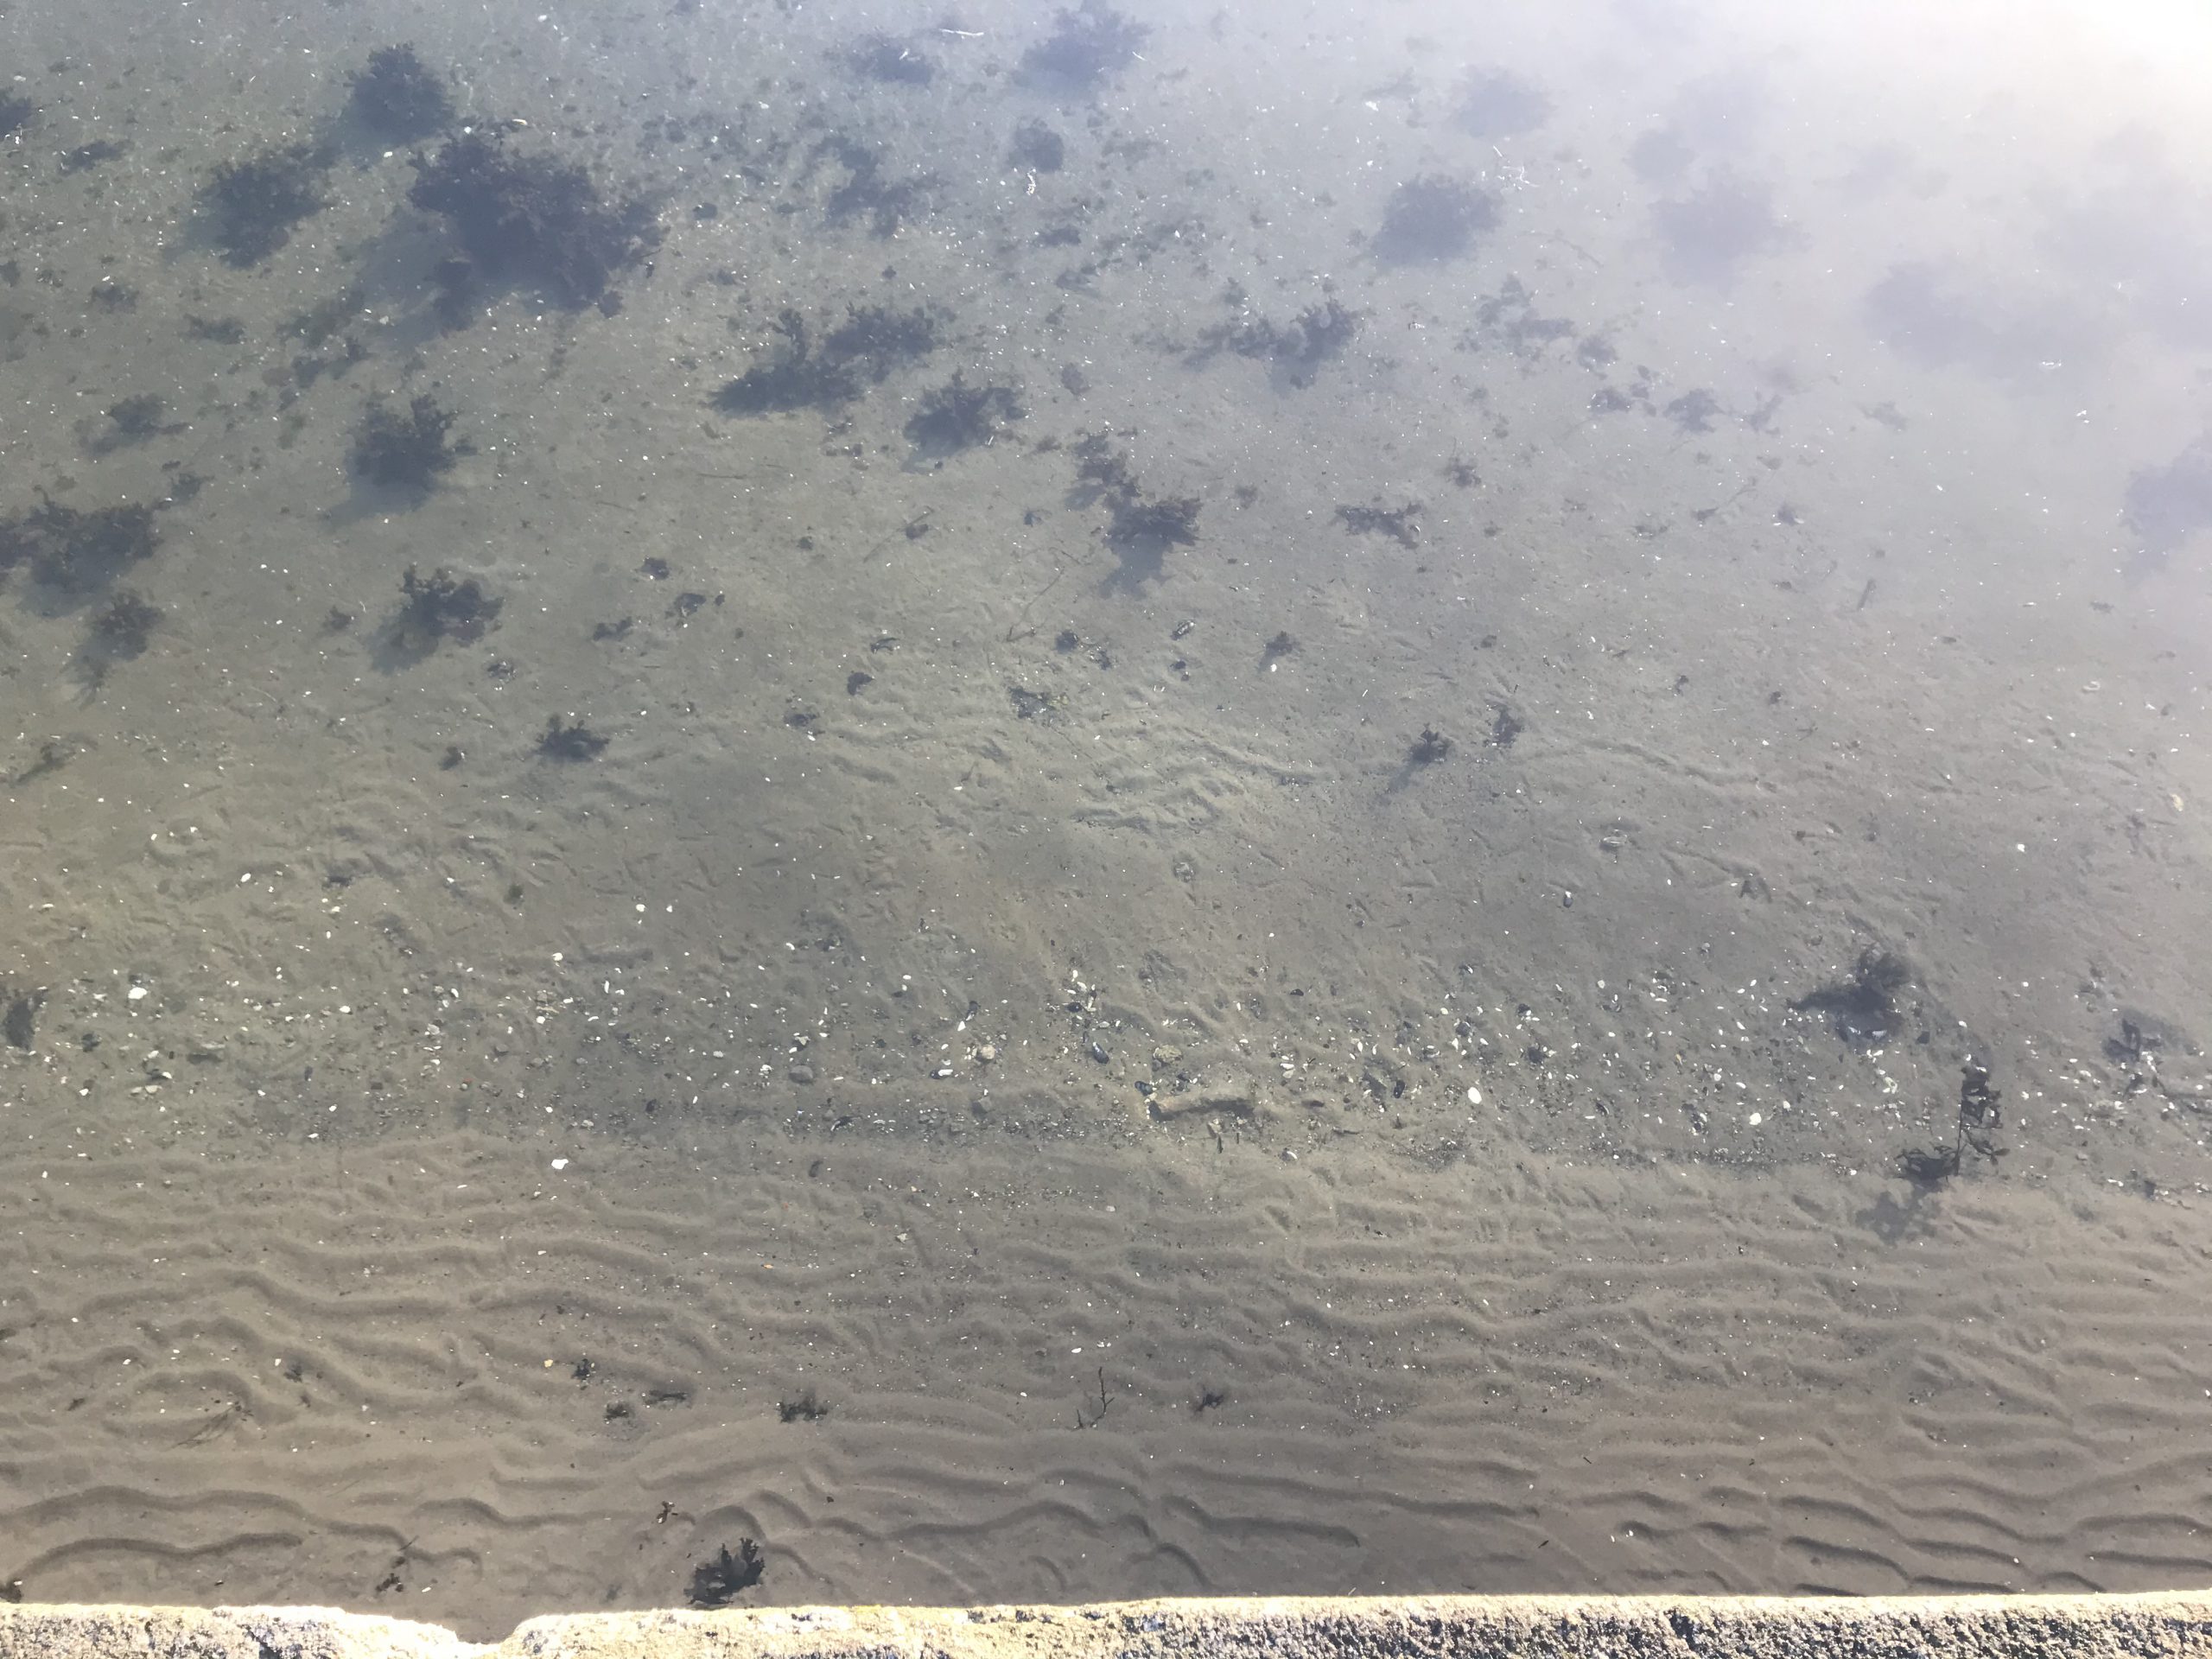
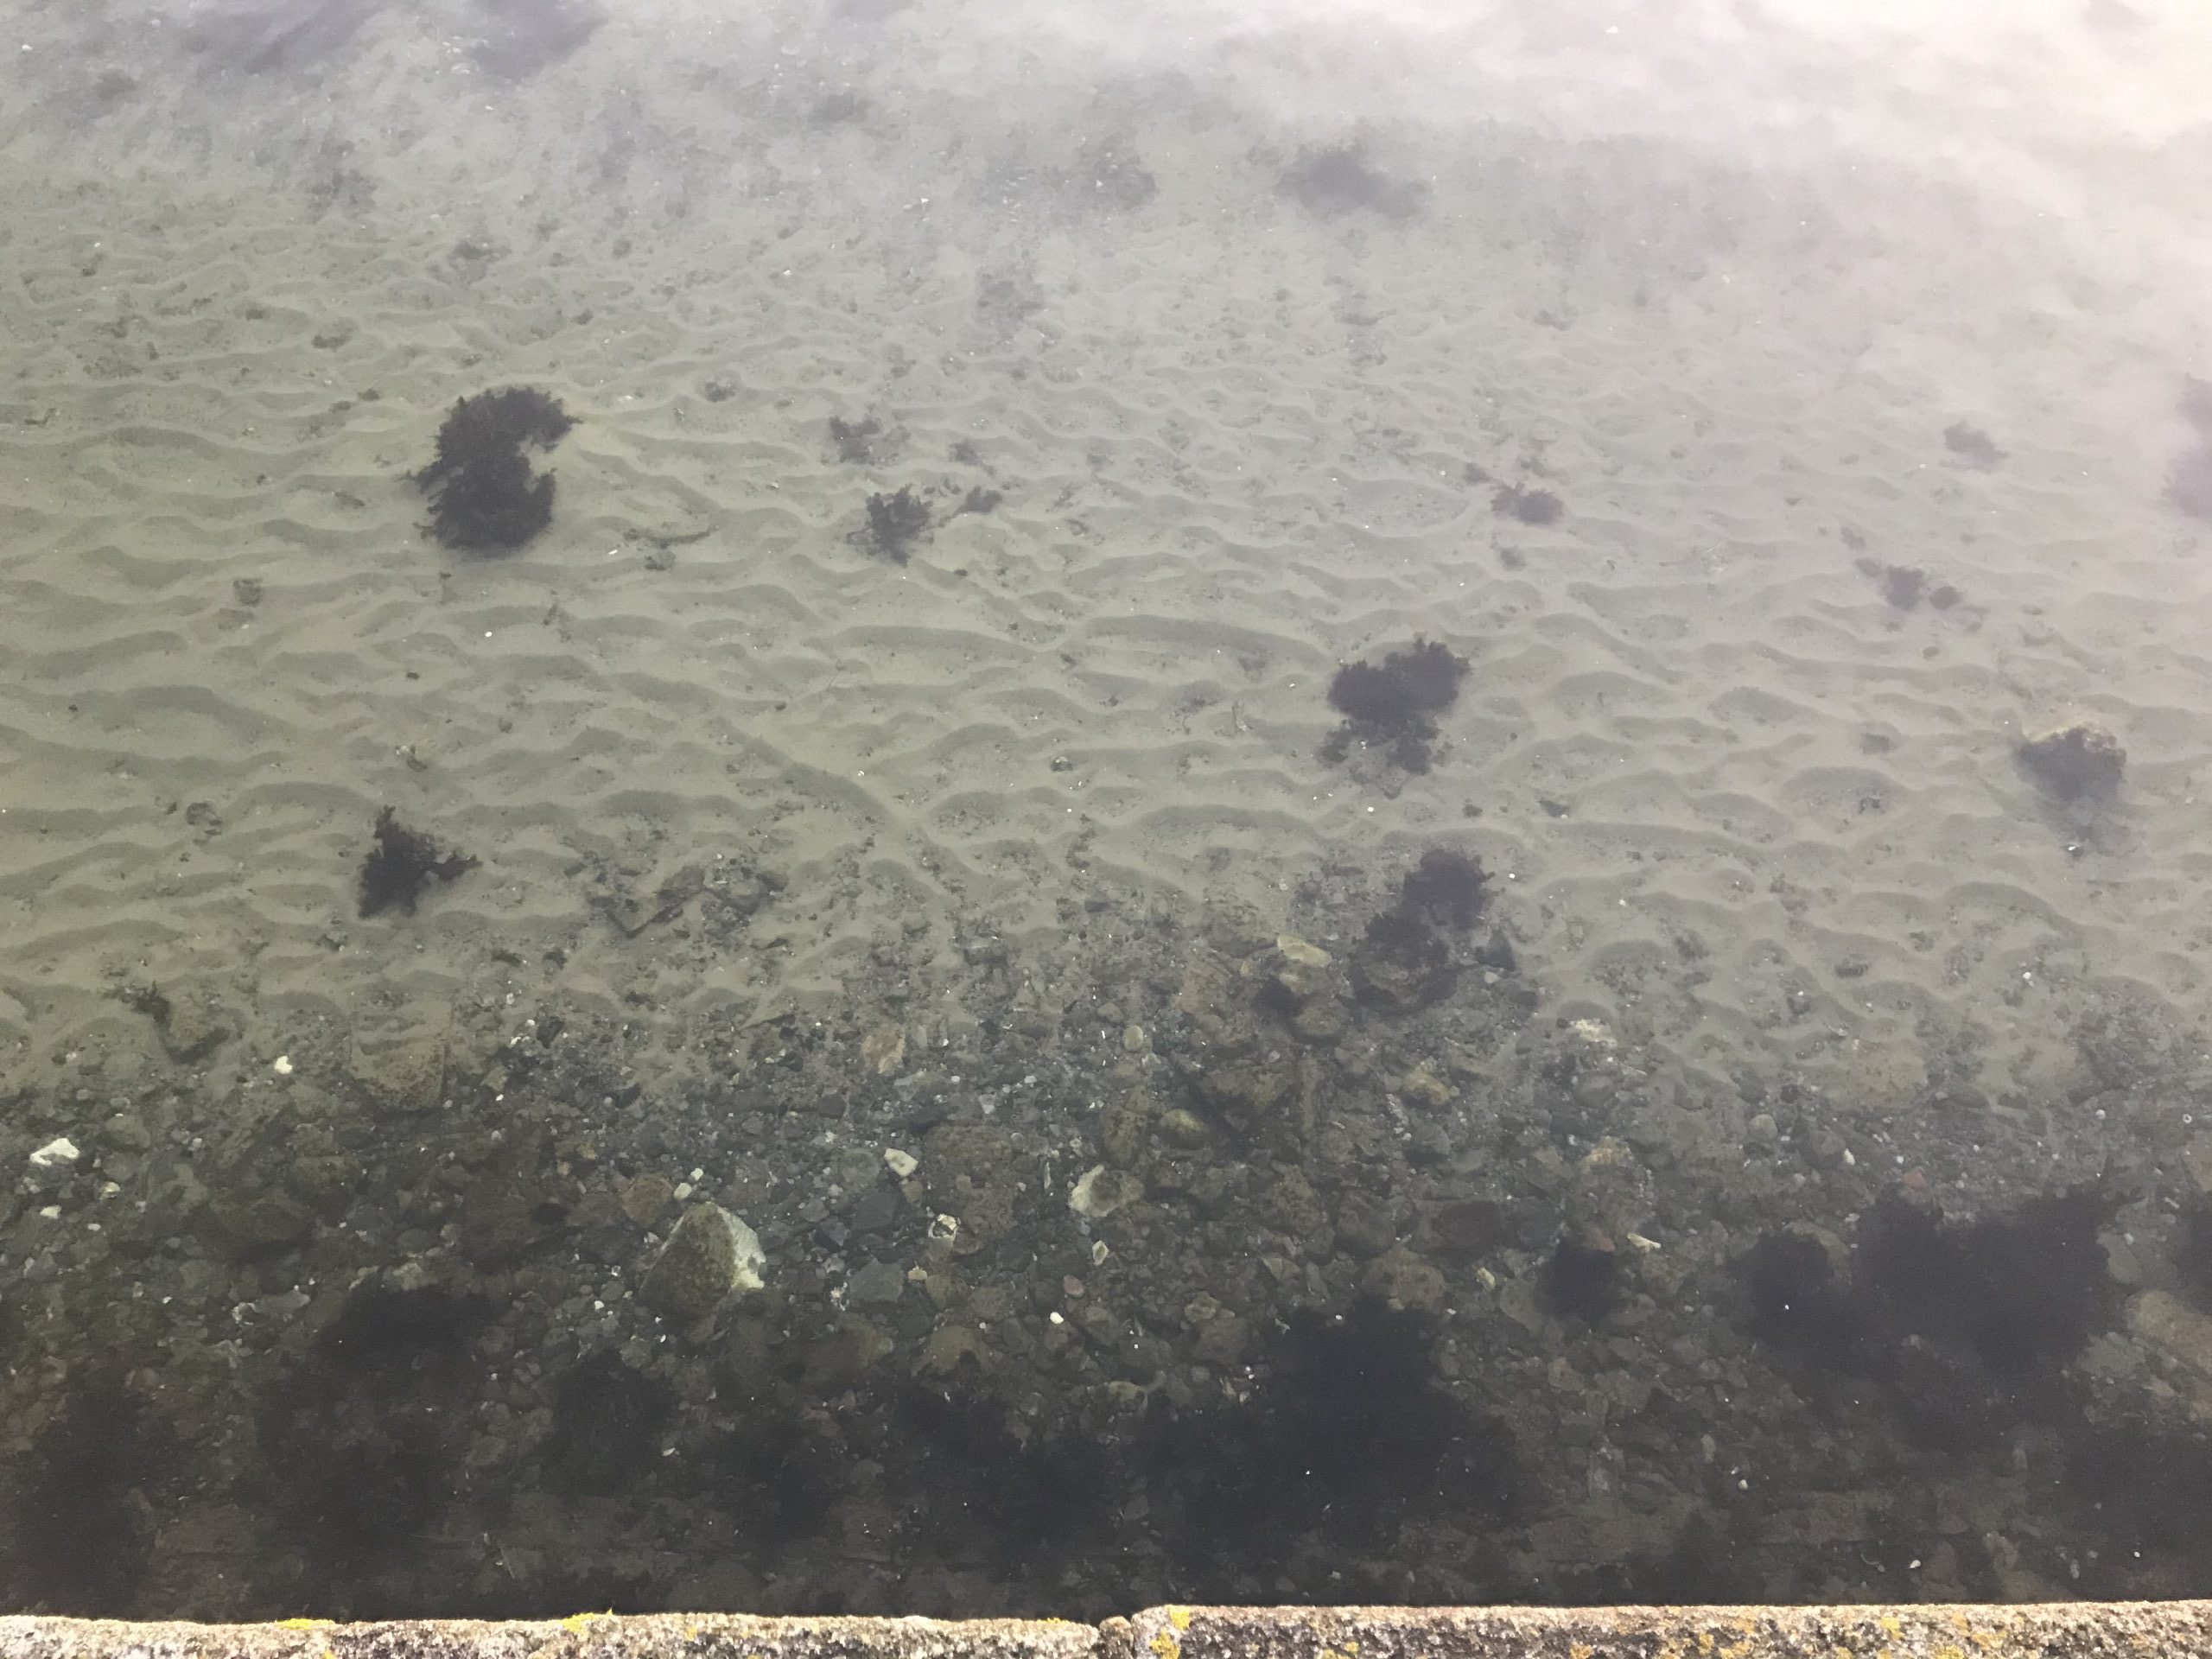
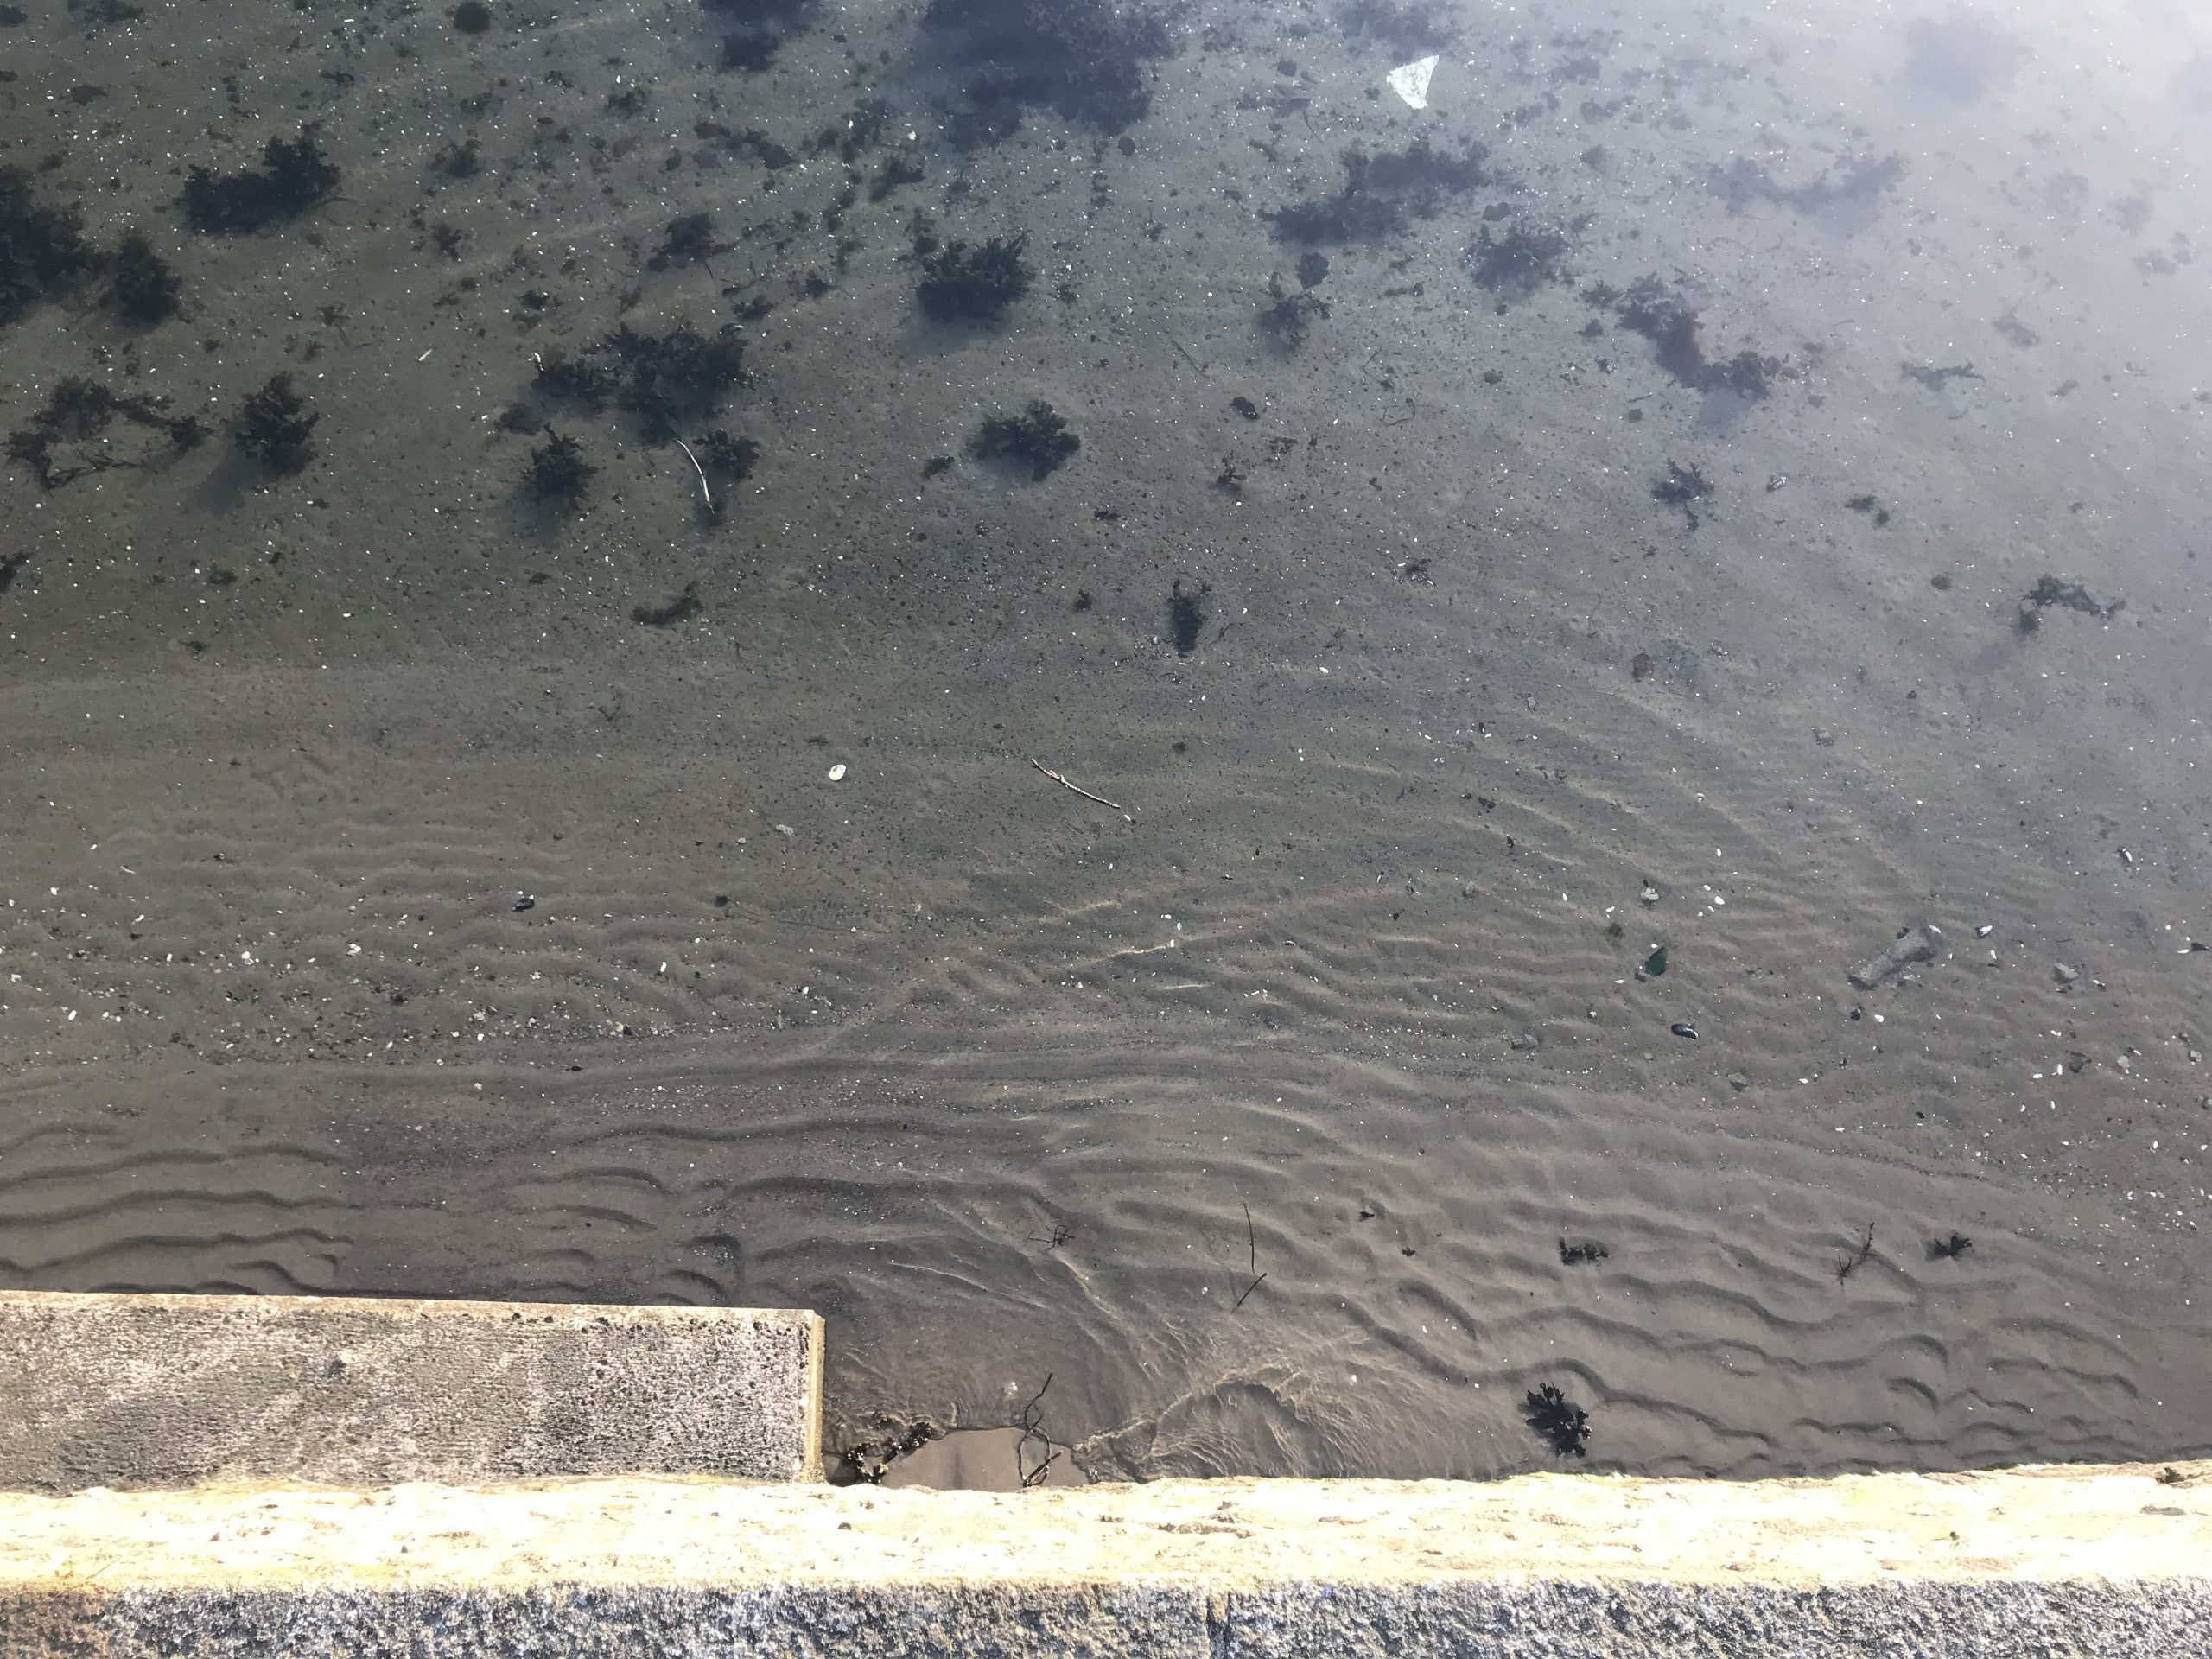
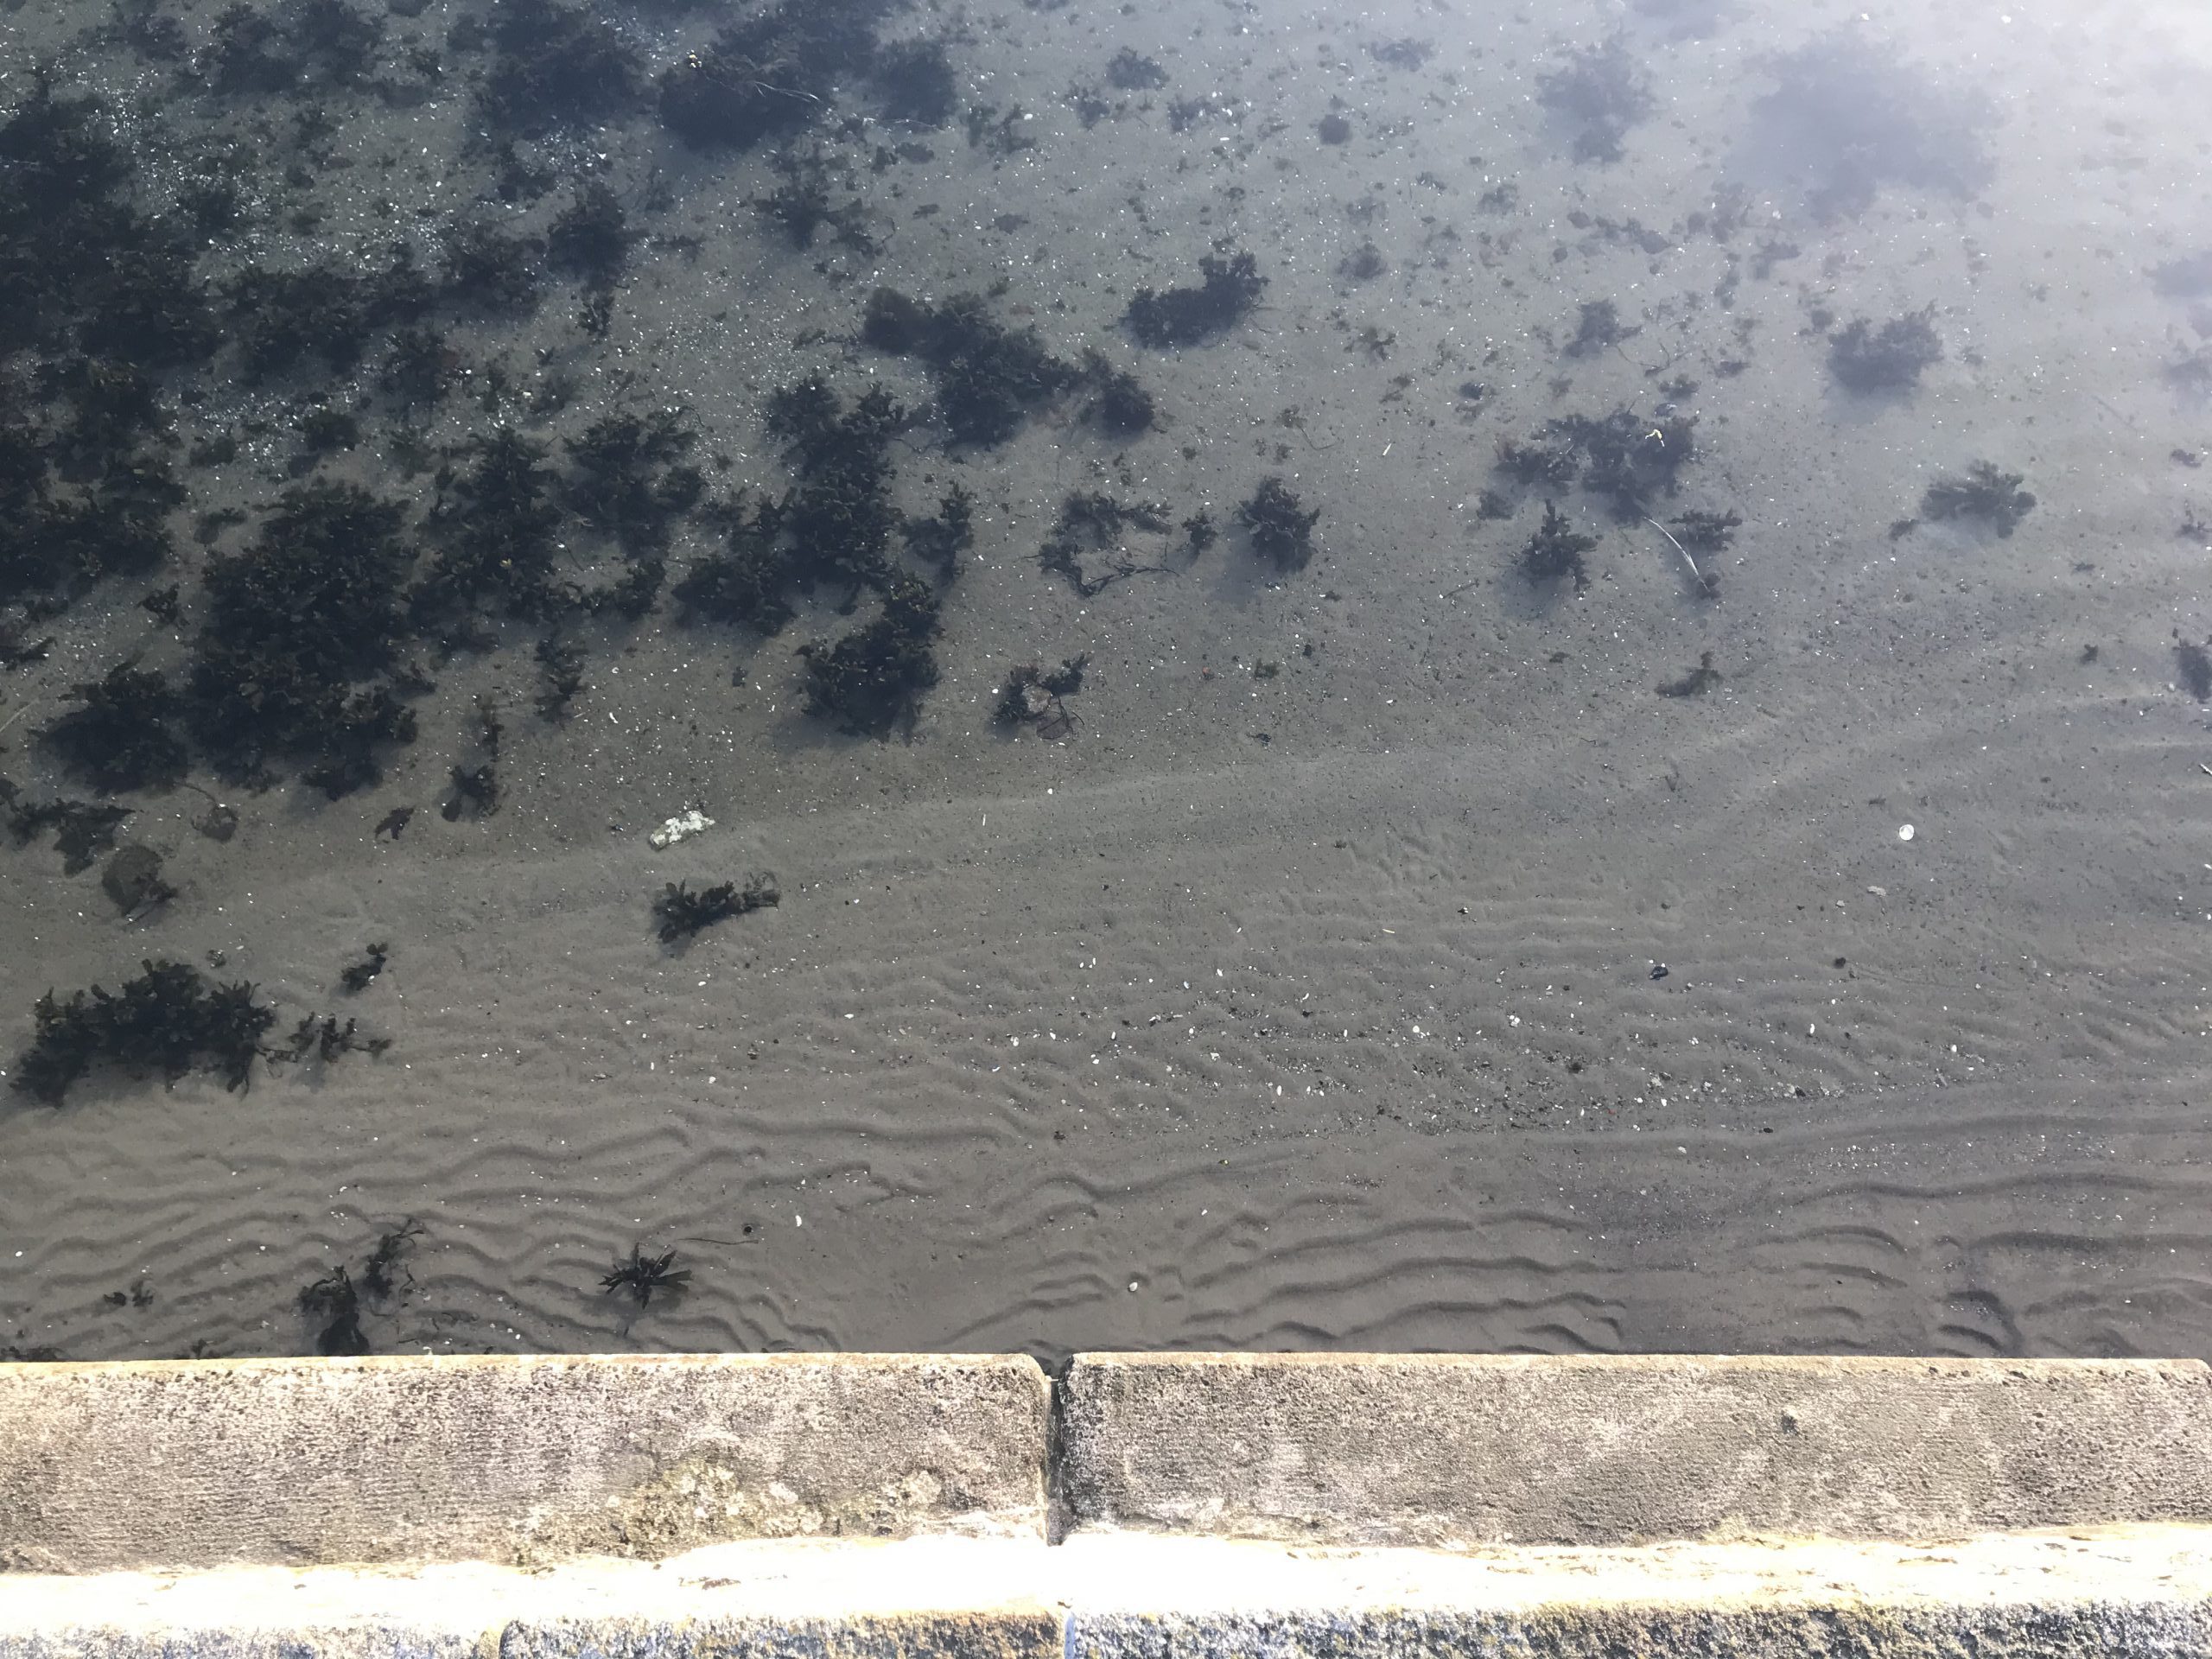
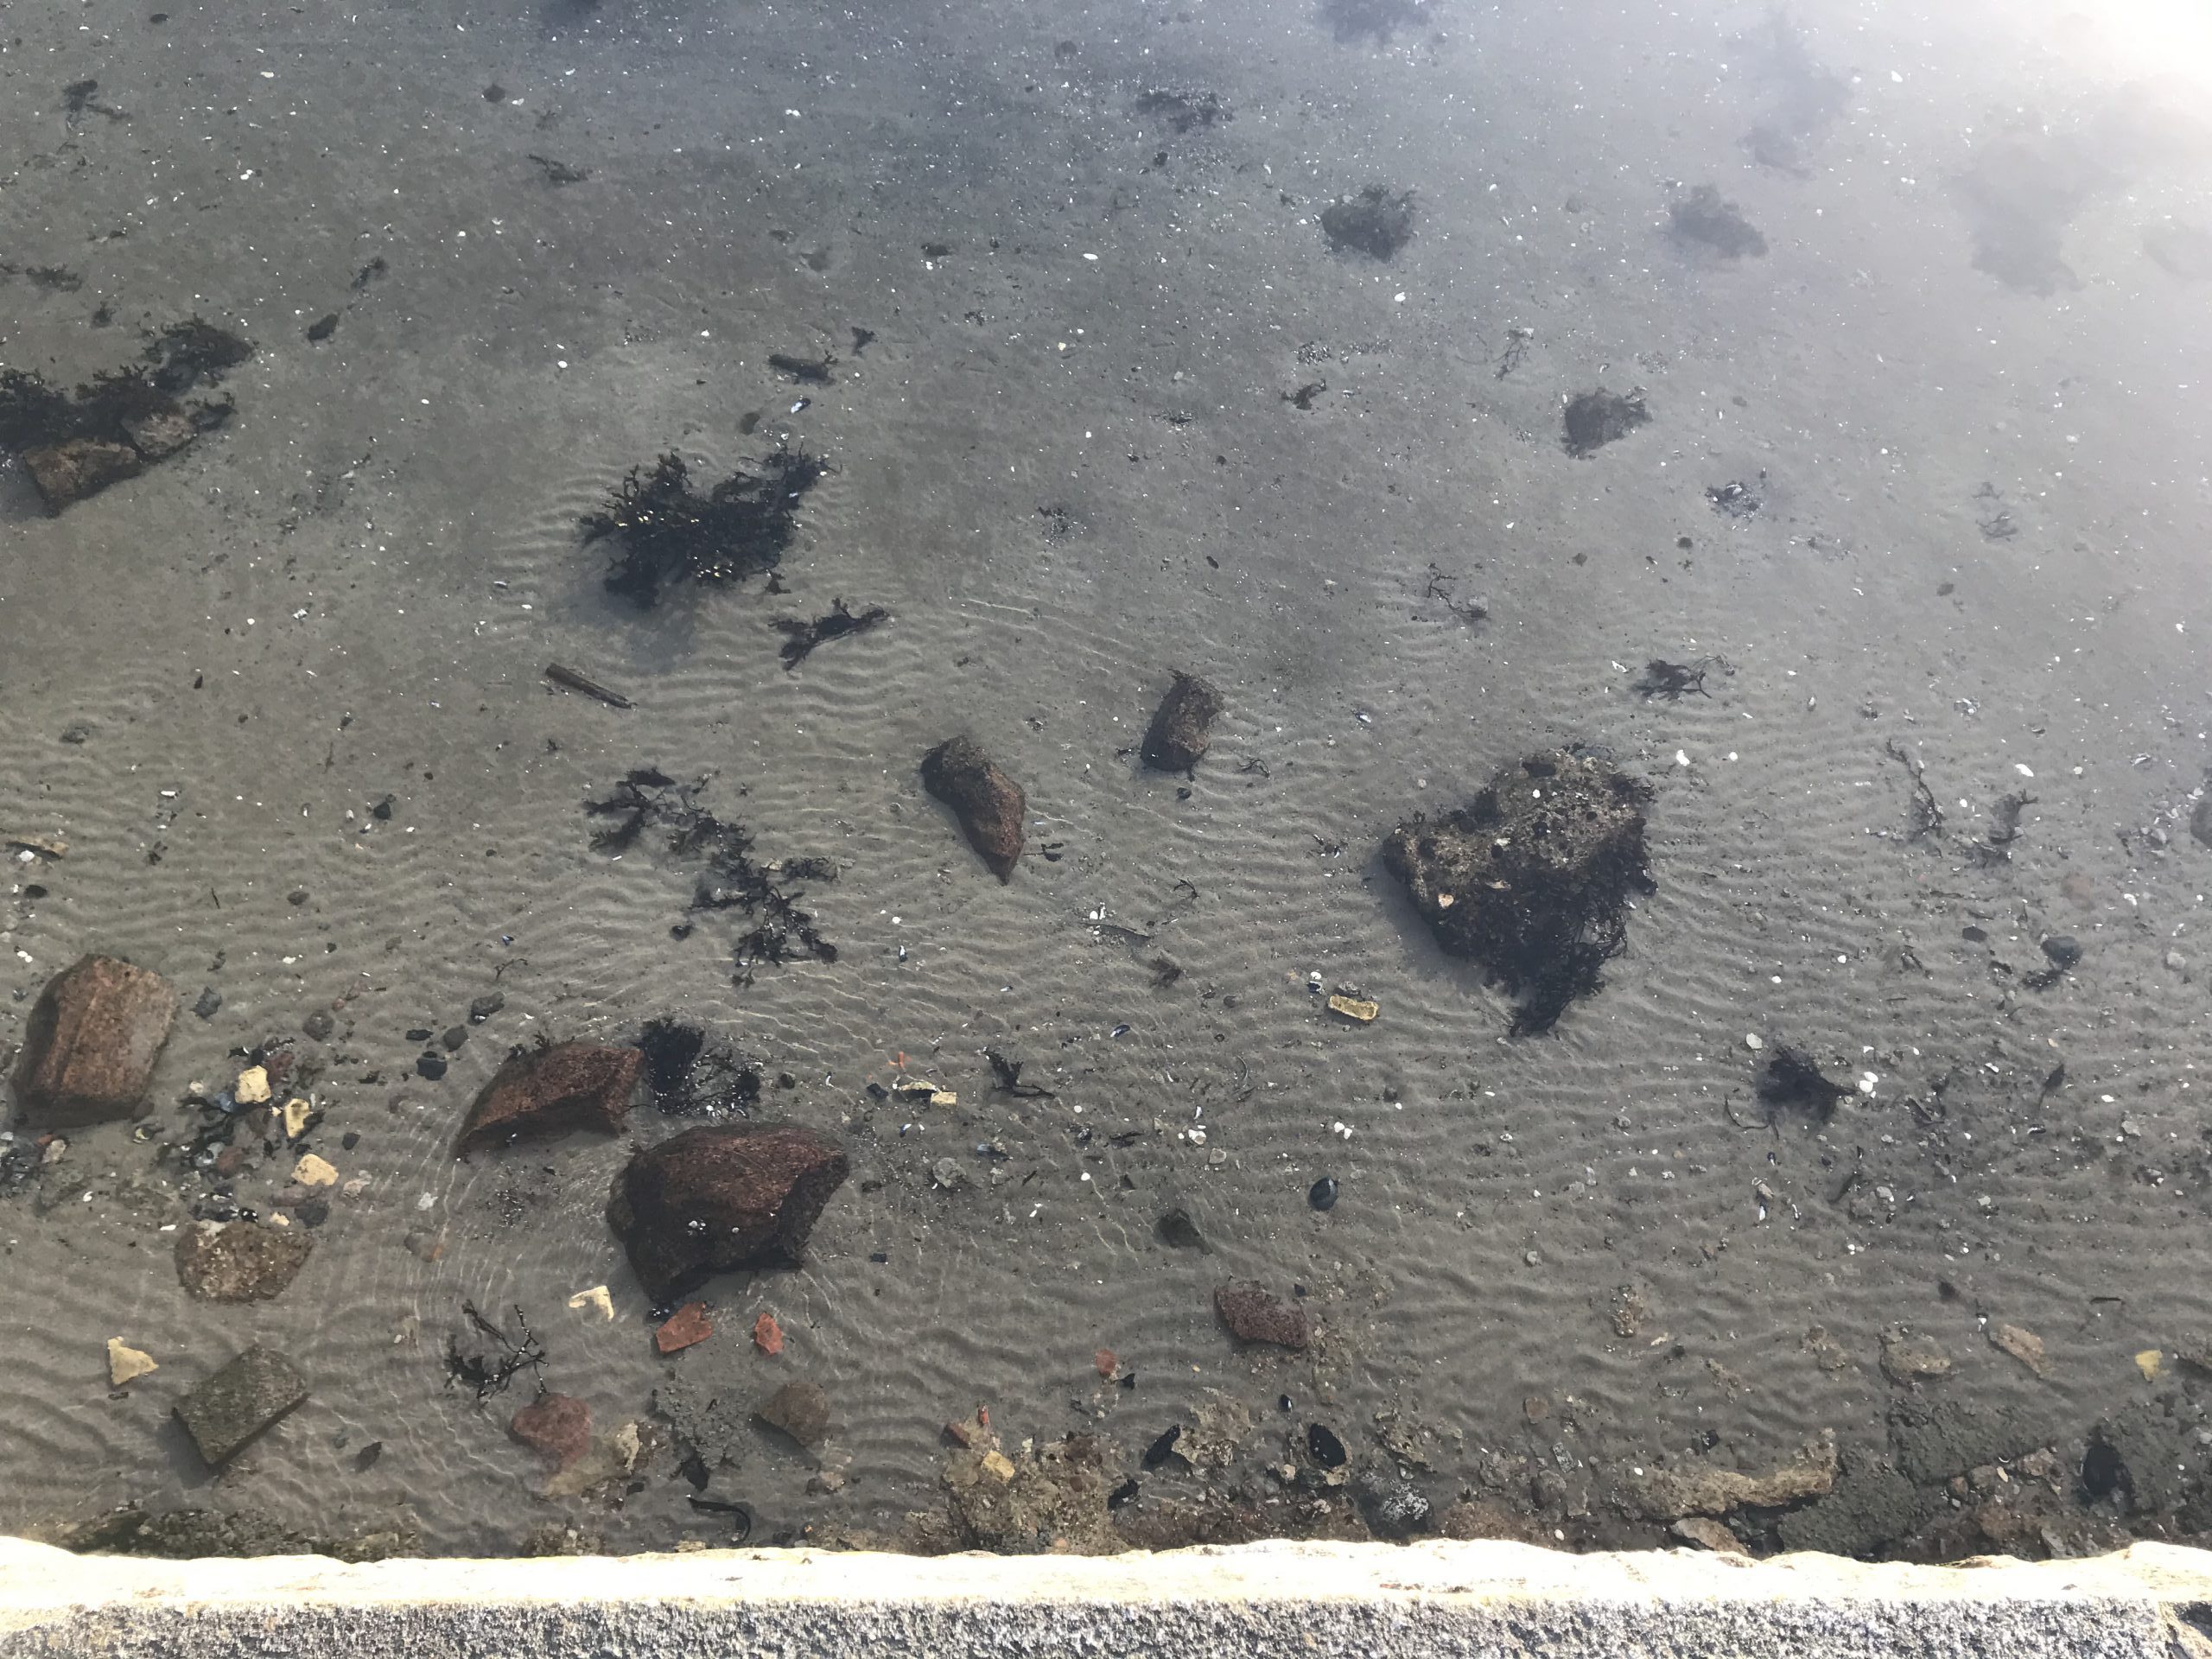
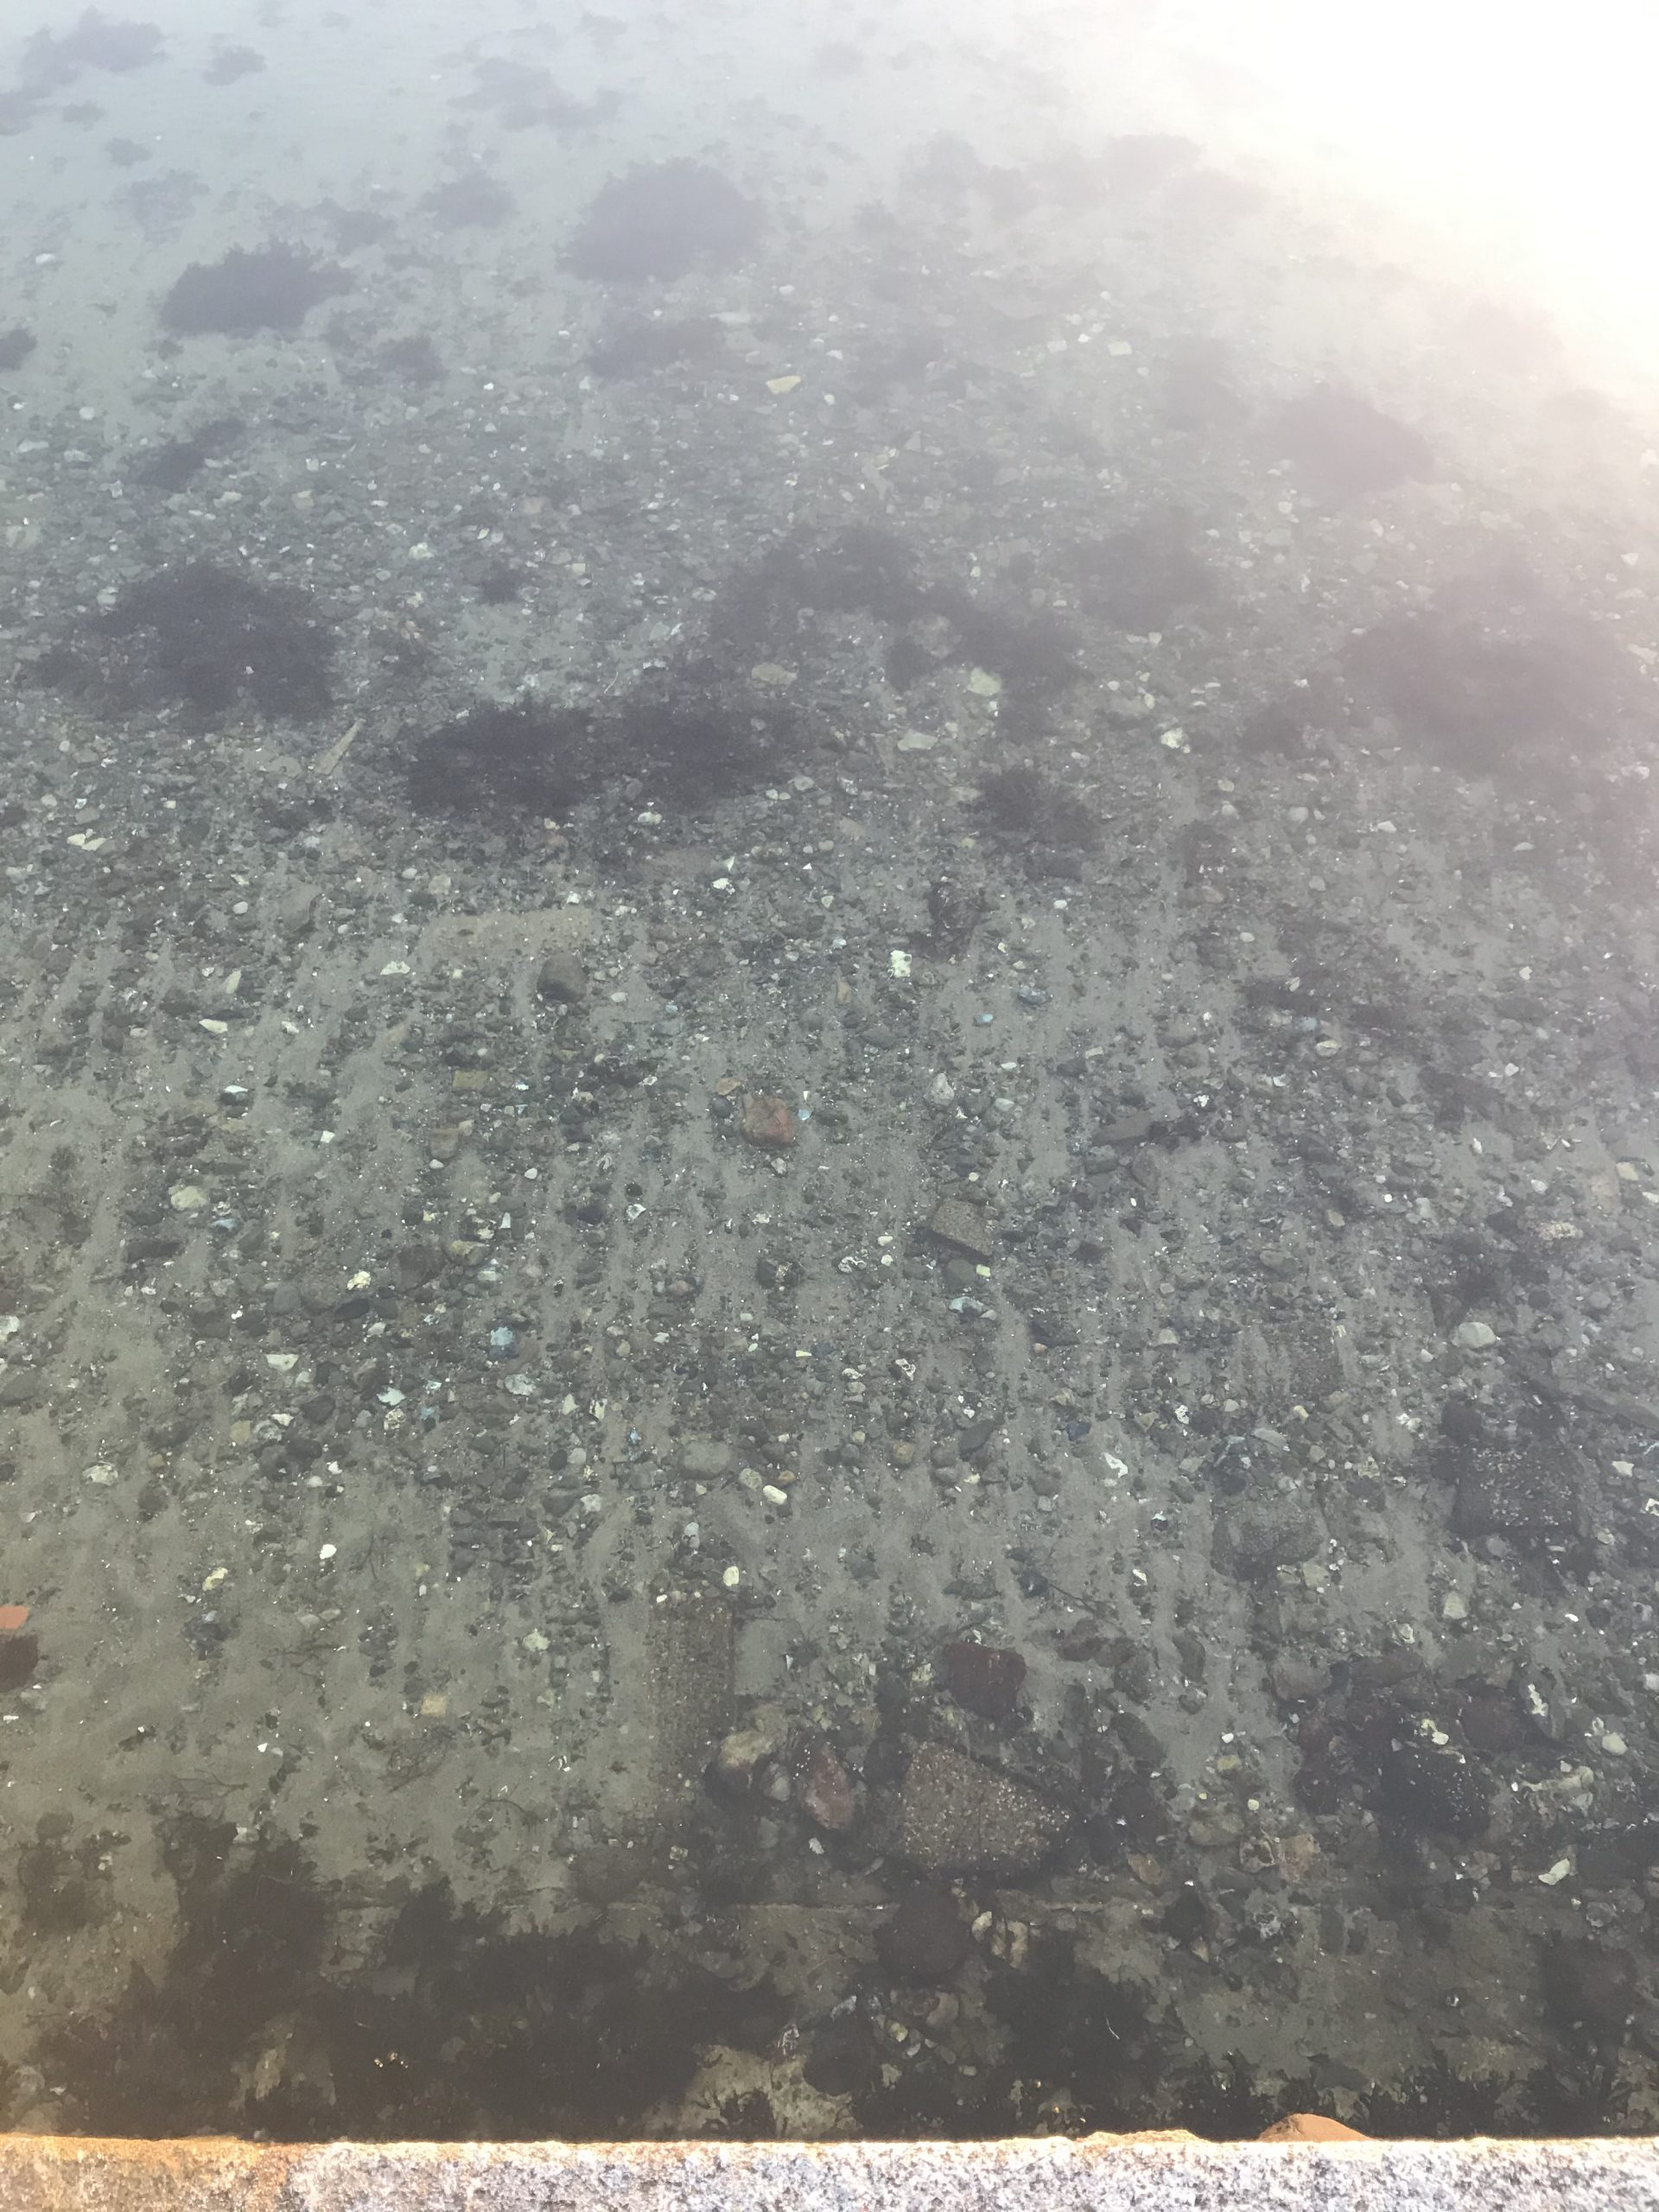
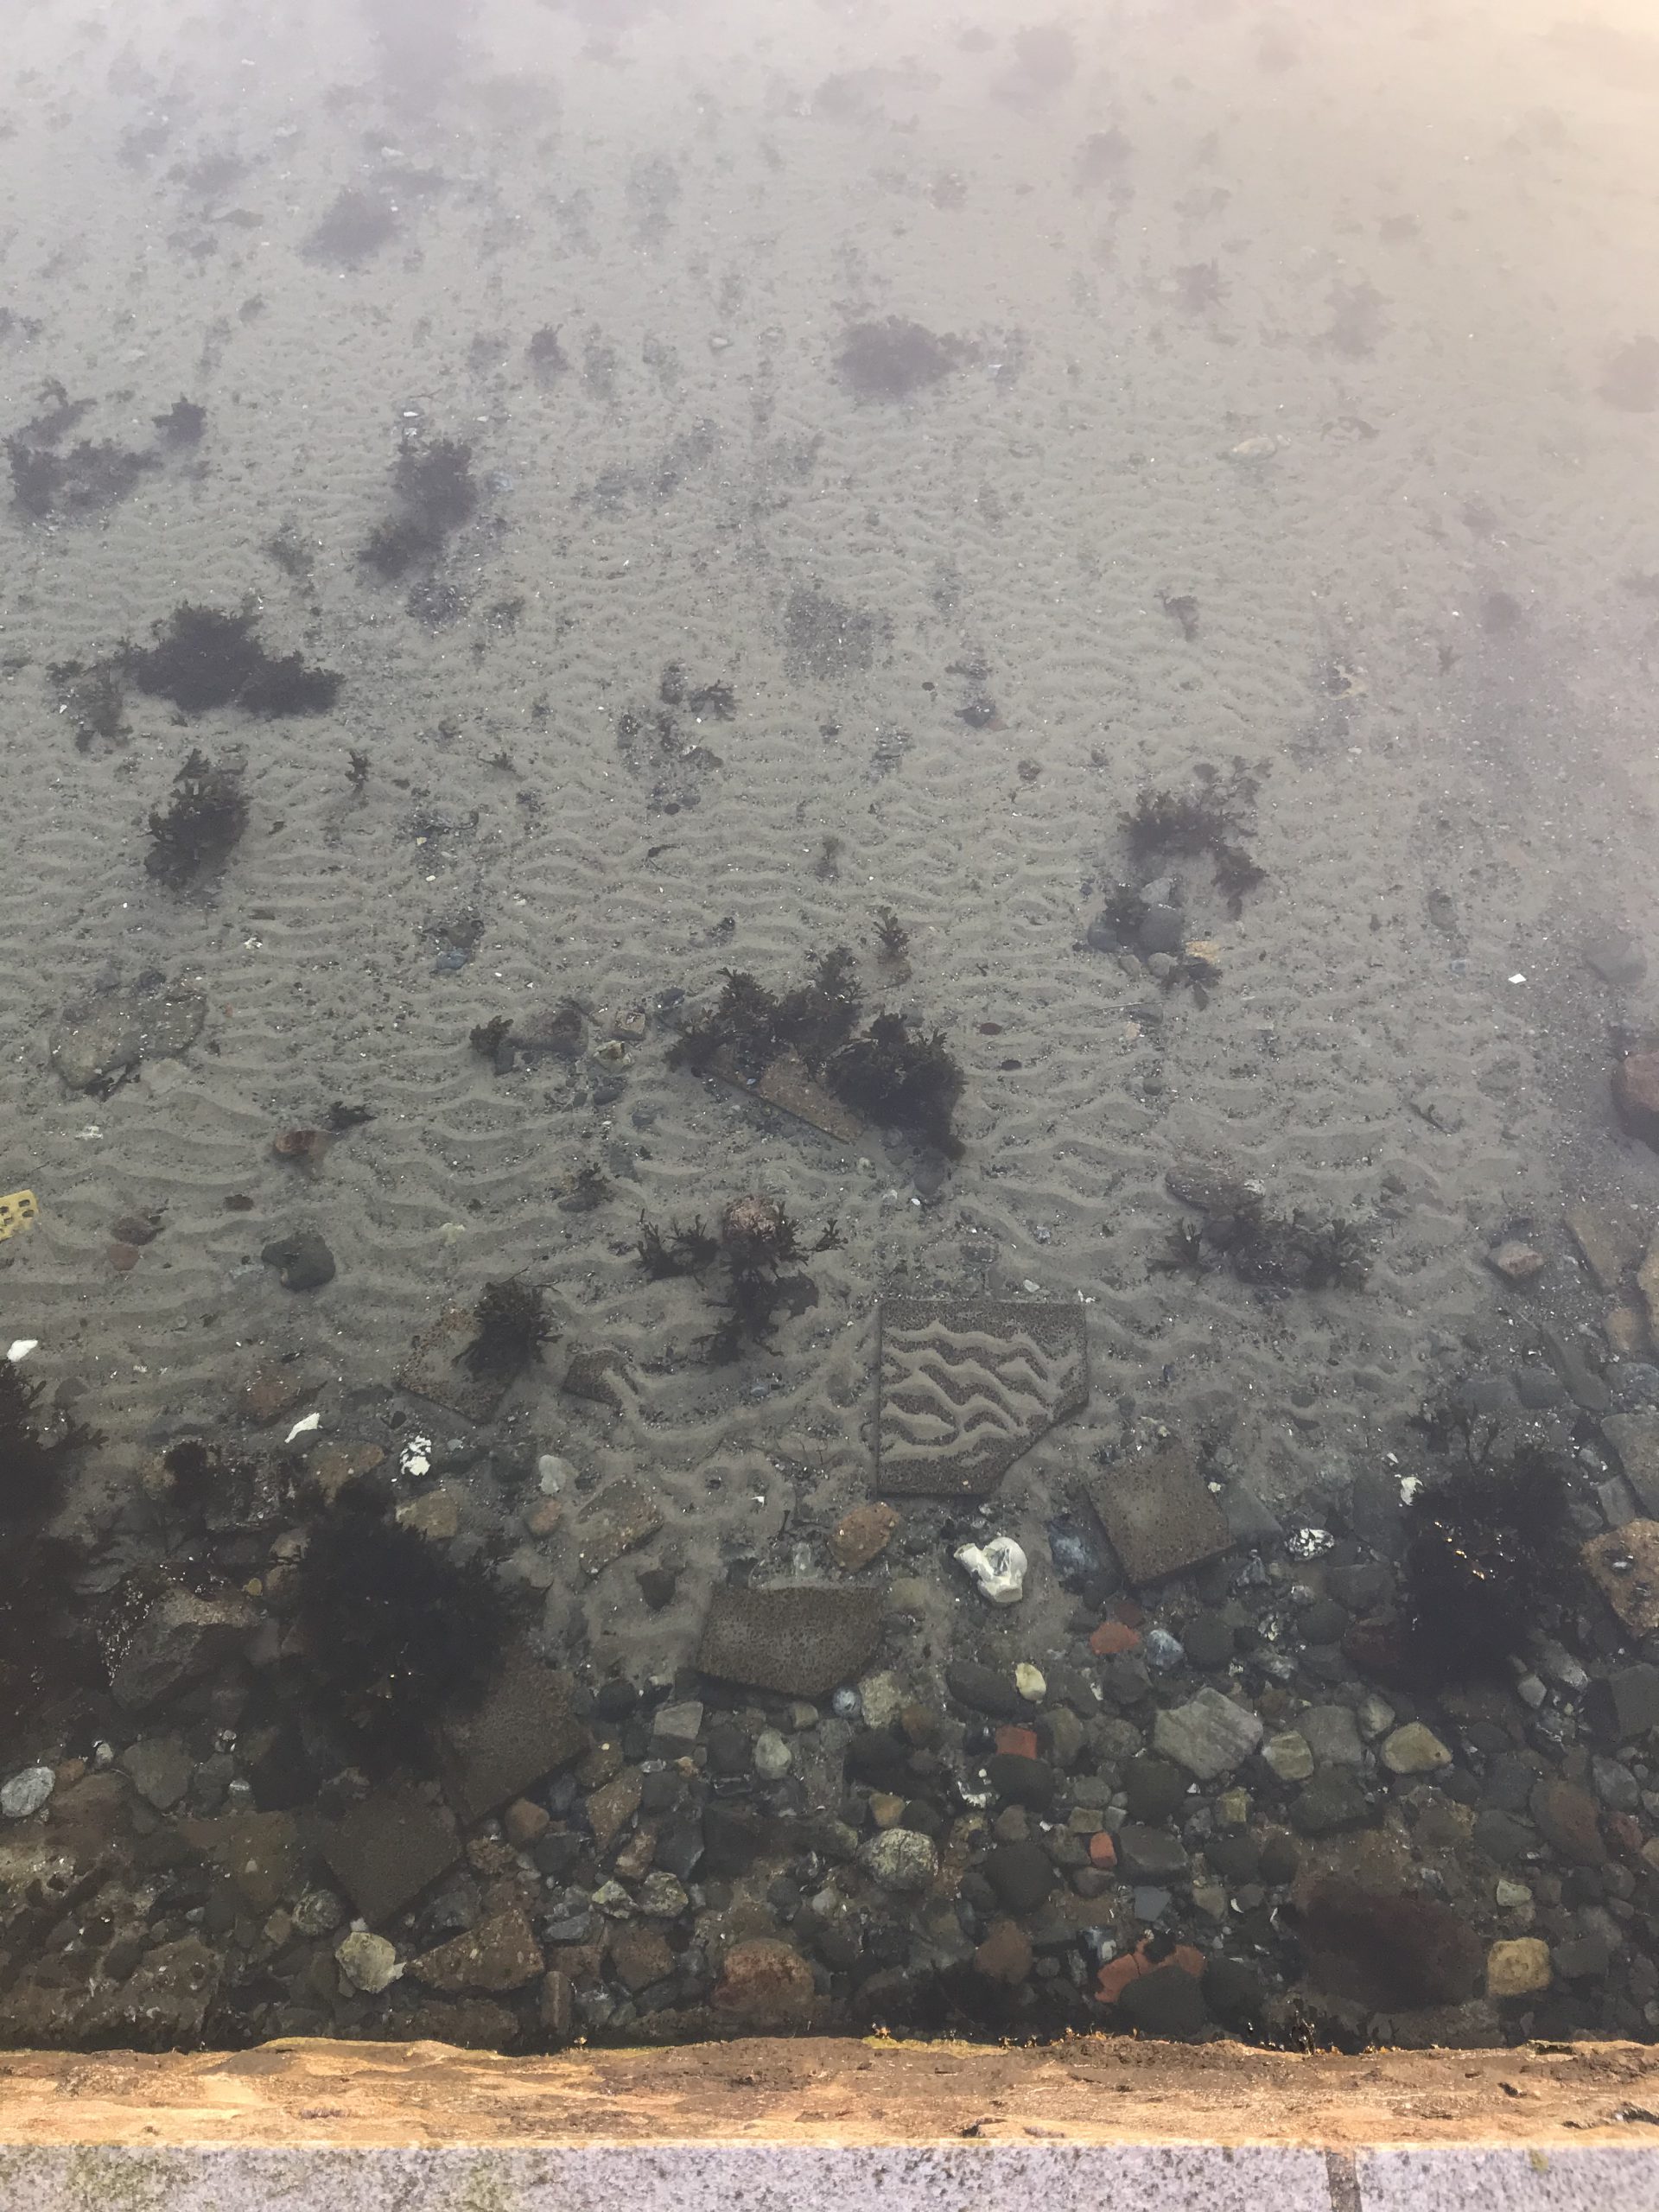
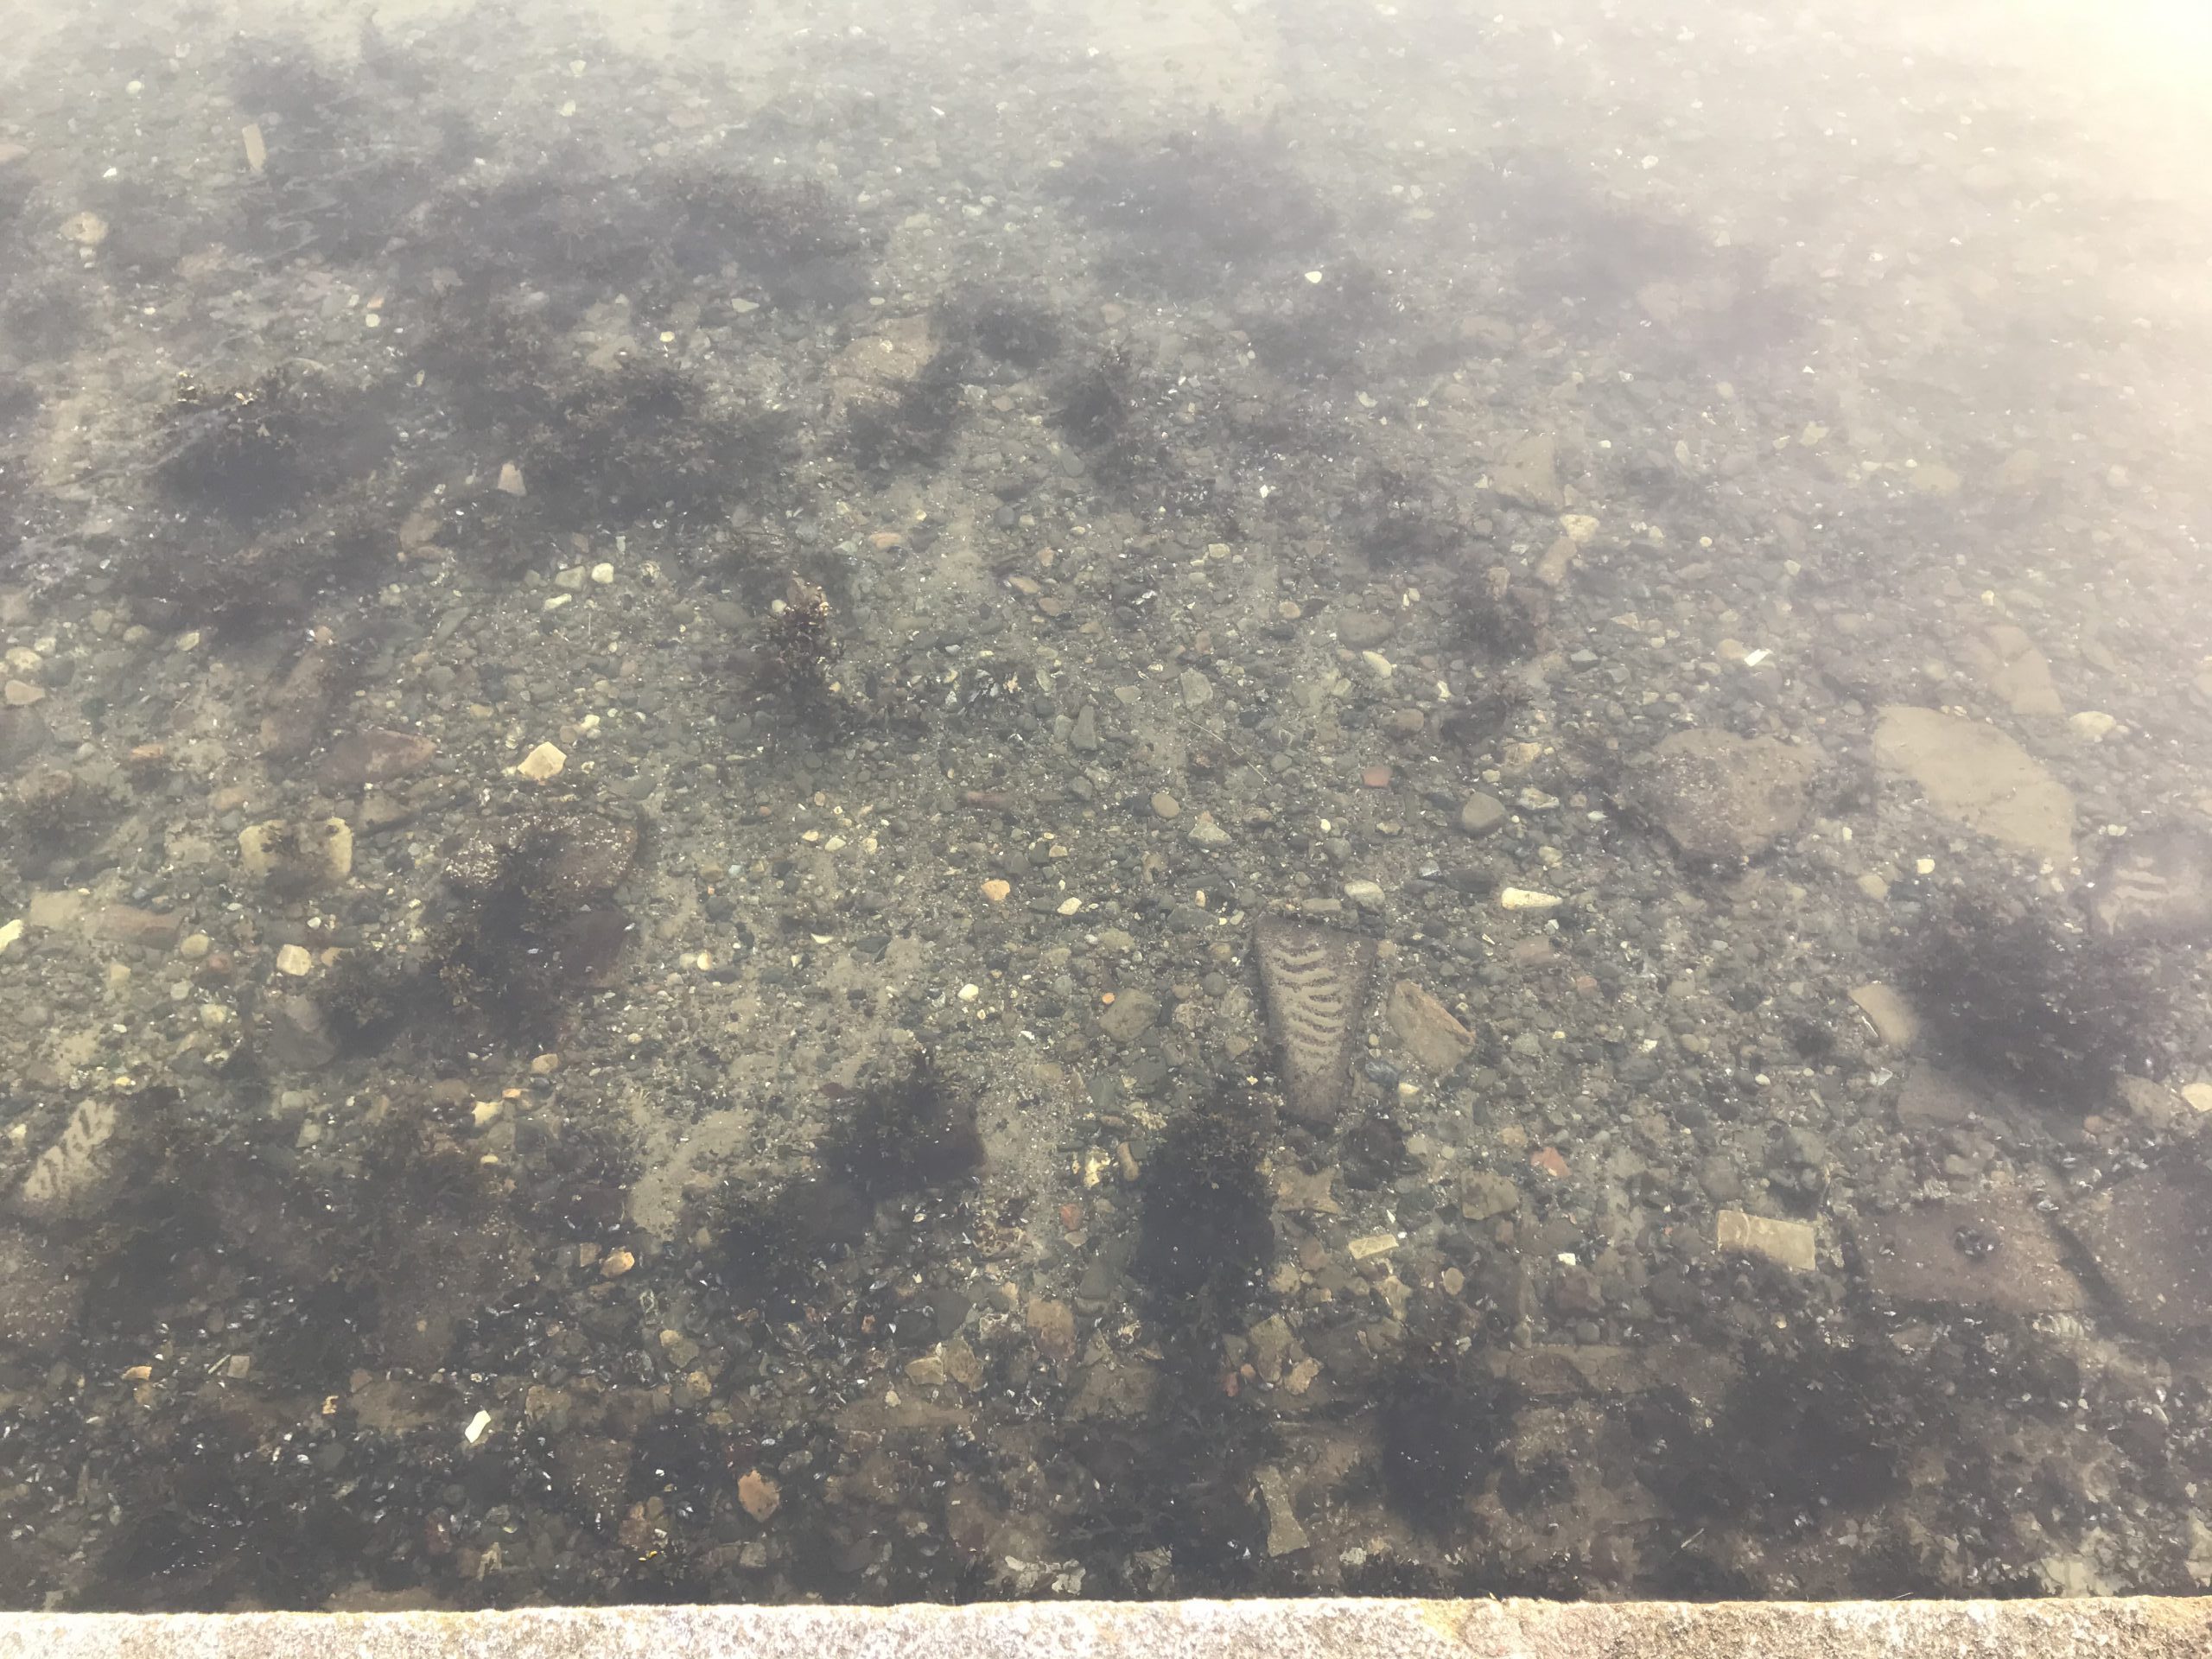
Note: All pictures of wave ripples I am showing here were taken in Kiel fjord, looking down from the sea wall into the water. There is usually a bit of the sea wall still visible for orientation, and further away from the sea wall the sky reflects on the surface. This is not ideal, but it’s all I have to work with right now.

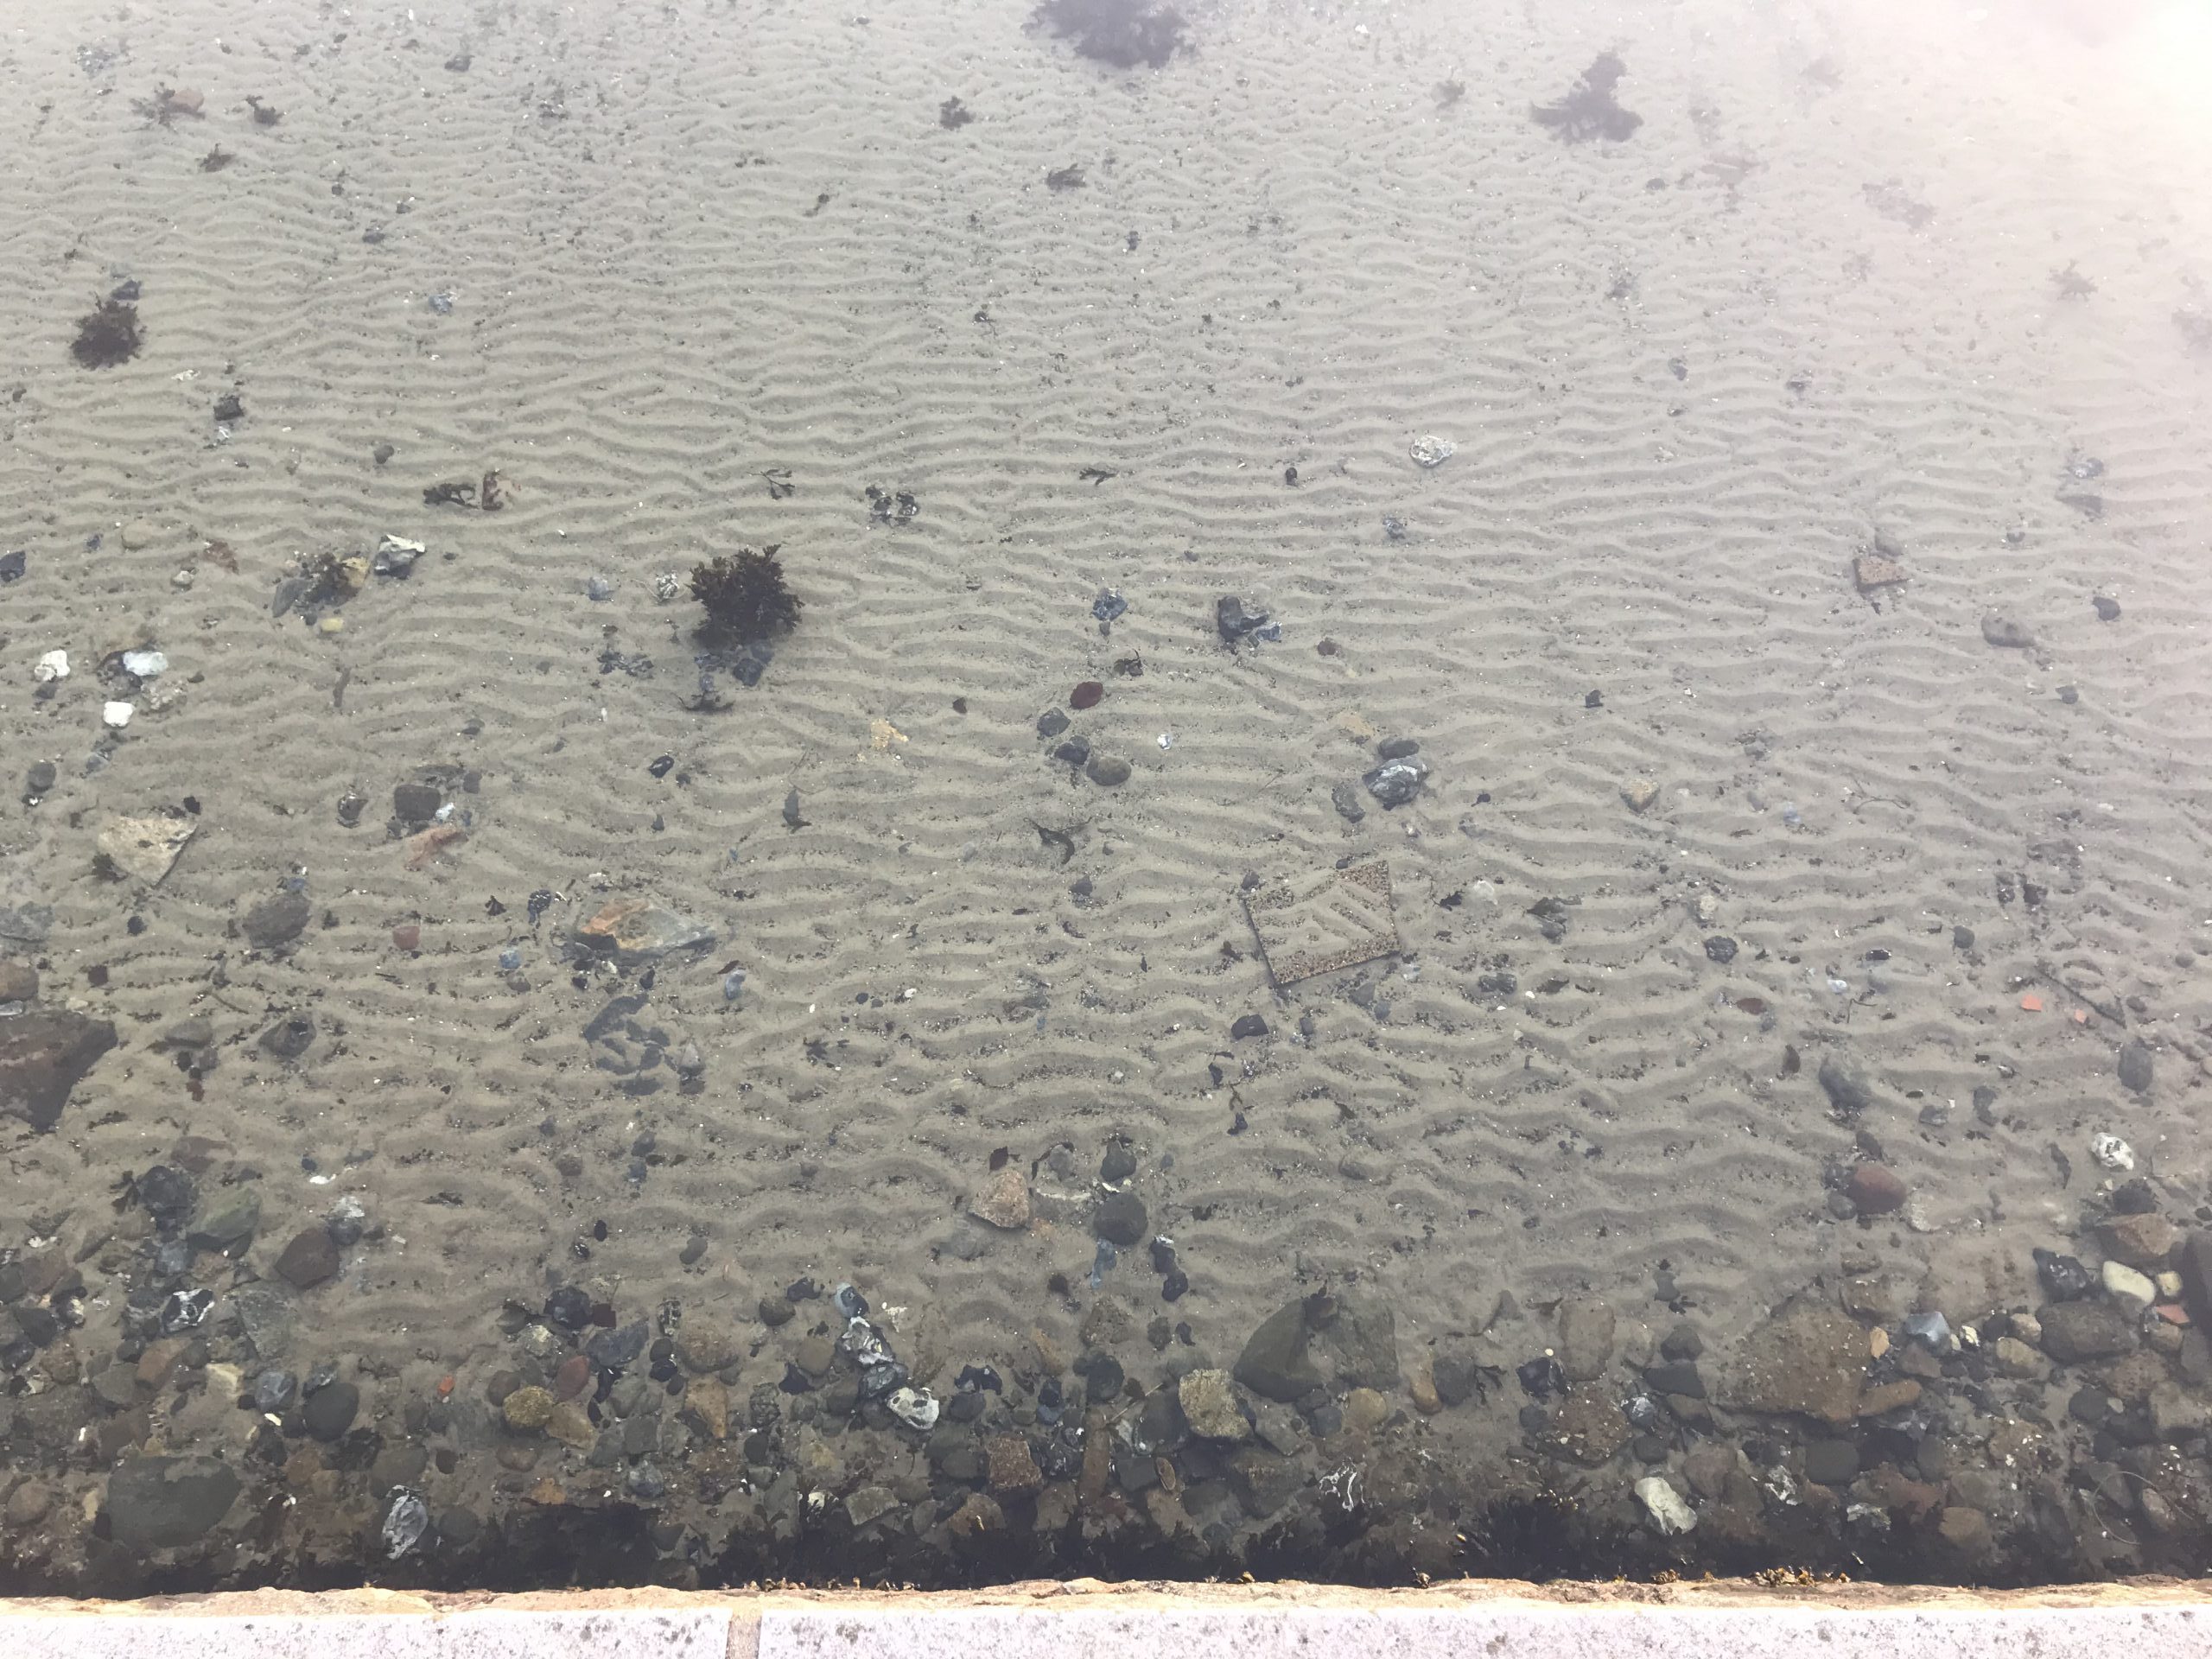
Let’s check out the picture below: Here we see quite regular wave ripples, except very close to the sea wall (where the sand appears flat, possibly because the water is very shallow there), and close to kelp (where the sand is flat, too, but probably due to wave-plant interactions; i.e. either the plant taking energy out of the wave field and dampening the wave, or the plant being moved over the sand by the waves, thus wiping out any ripples that might have been there).

More fairly regular ripples.

Sometimes ripples are a lot less regular and look a lot more choppy. Not surprising seeing that often waves get reflected at the sea wall at an angle, creating a checkerboard pattern of wave crests, thus not only a back-and-forth orbital flow, but probably more of a circular one. But why is there still a predominant direction of wave crests then? Does anyone know?

Below you see what I mean: In the upper corners of the picture you see the water wave crests at an angle to each other.

The picture below I find really beautiful with this nice wavy pattern.

And here, we see very different structures in different spots — some more regular, some very choppy.

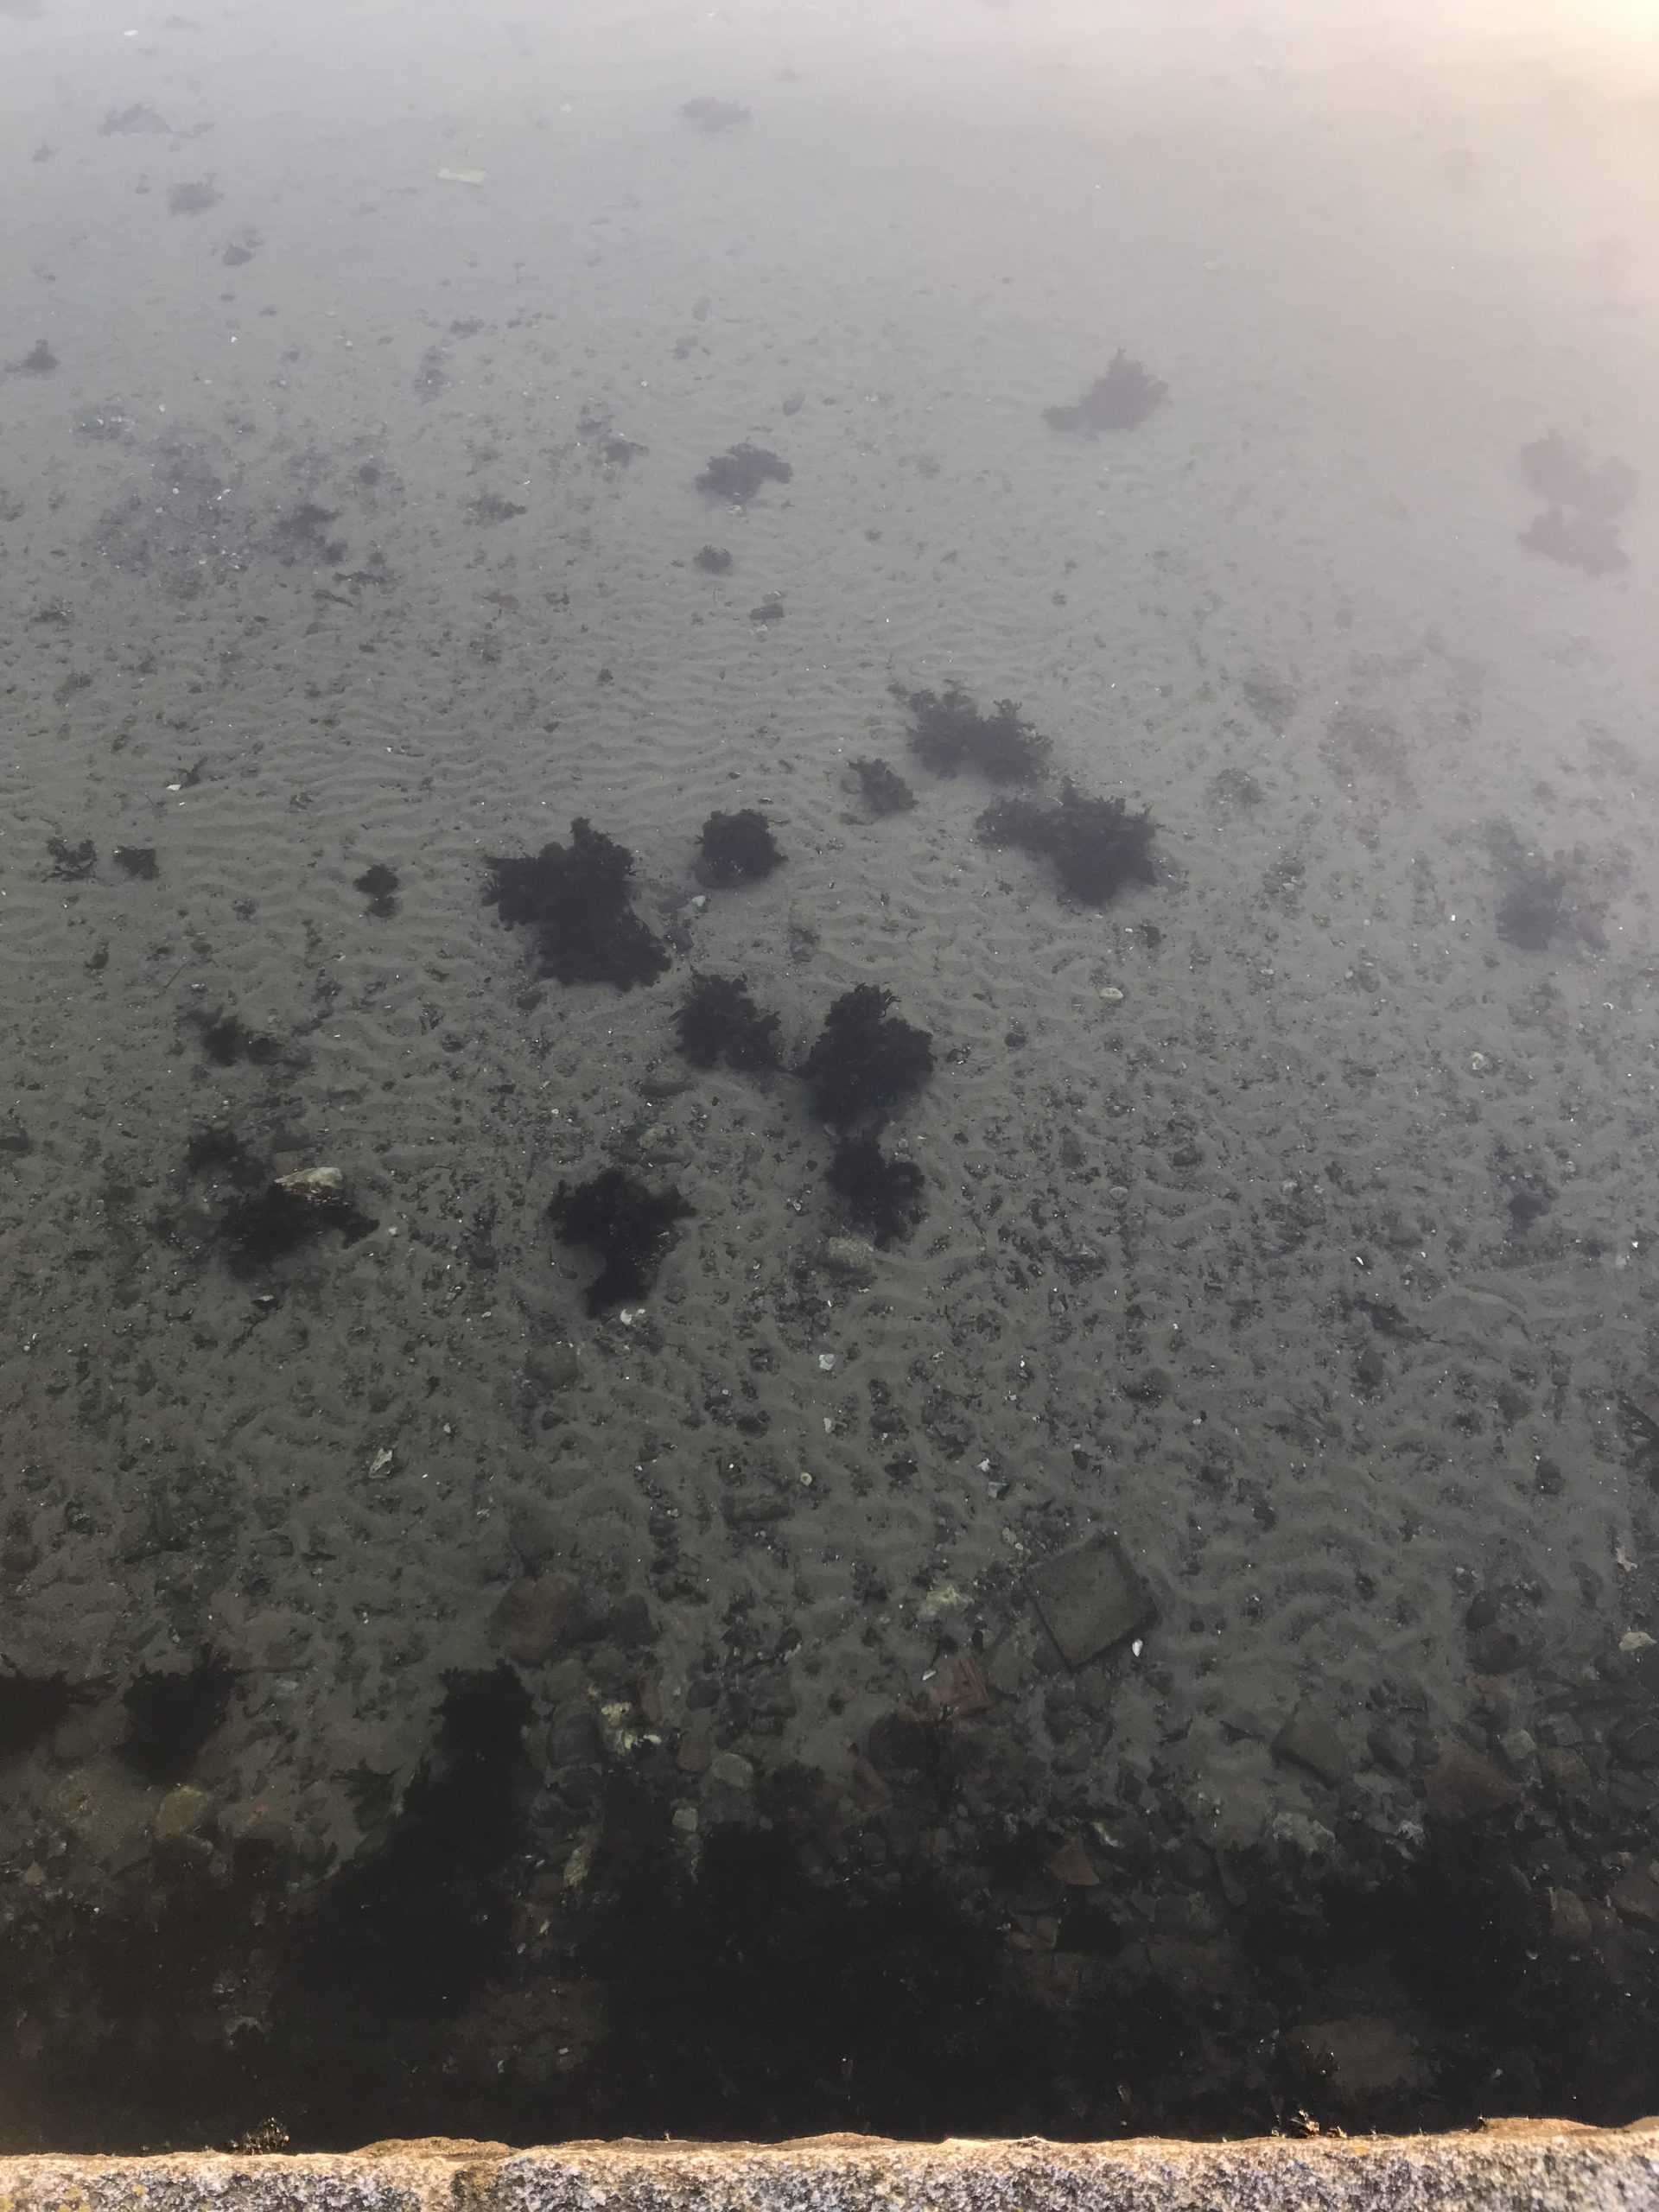
And there is a lot going on in the picture below. We see an effect of grain size with coarser grains not showing many ripples and the fine mud not showing any, either. But that might also be due to algae mats protecting the mud from erosion?

Below we see a similar thing again. I think the longer wavelengths closer to the sea wall are due to the shallower water depth there (hence more energy and higher velocities in the waves’ orbitals), then a slightly deeper part, then a corser-grained part and then mud covered in algae.

Here is another nice example of what I call “choppy ripples” — a lot choppier closer to the small and large stones at the sea wall than further offshore, and then a smooth bottom even further out. I haven’t quite figured out why the small stones there align perpendicularly to the sea wall. Any ideas, anyone? I’ve seen that so much on beaches, it must be quite obvious!

Oh, and here is a nice example of an obstacle influencing ripples. I like how they bend around the edge if that stone step! And also again very clearly different regimes related to different grain sizes and water depths.

And again…

Here is another picture where algae mats seem to inhibit ripple formation.

And here is an example of that phenomenon I talked about earlier that I haven’t really figured out: When there are no ripples, we often see debris in rows perpendicular to the sea wall. Why???

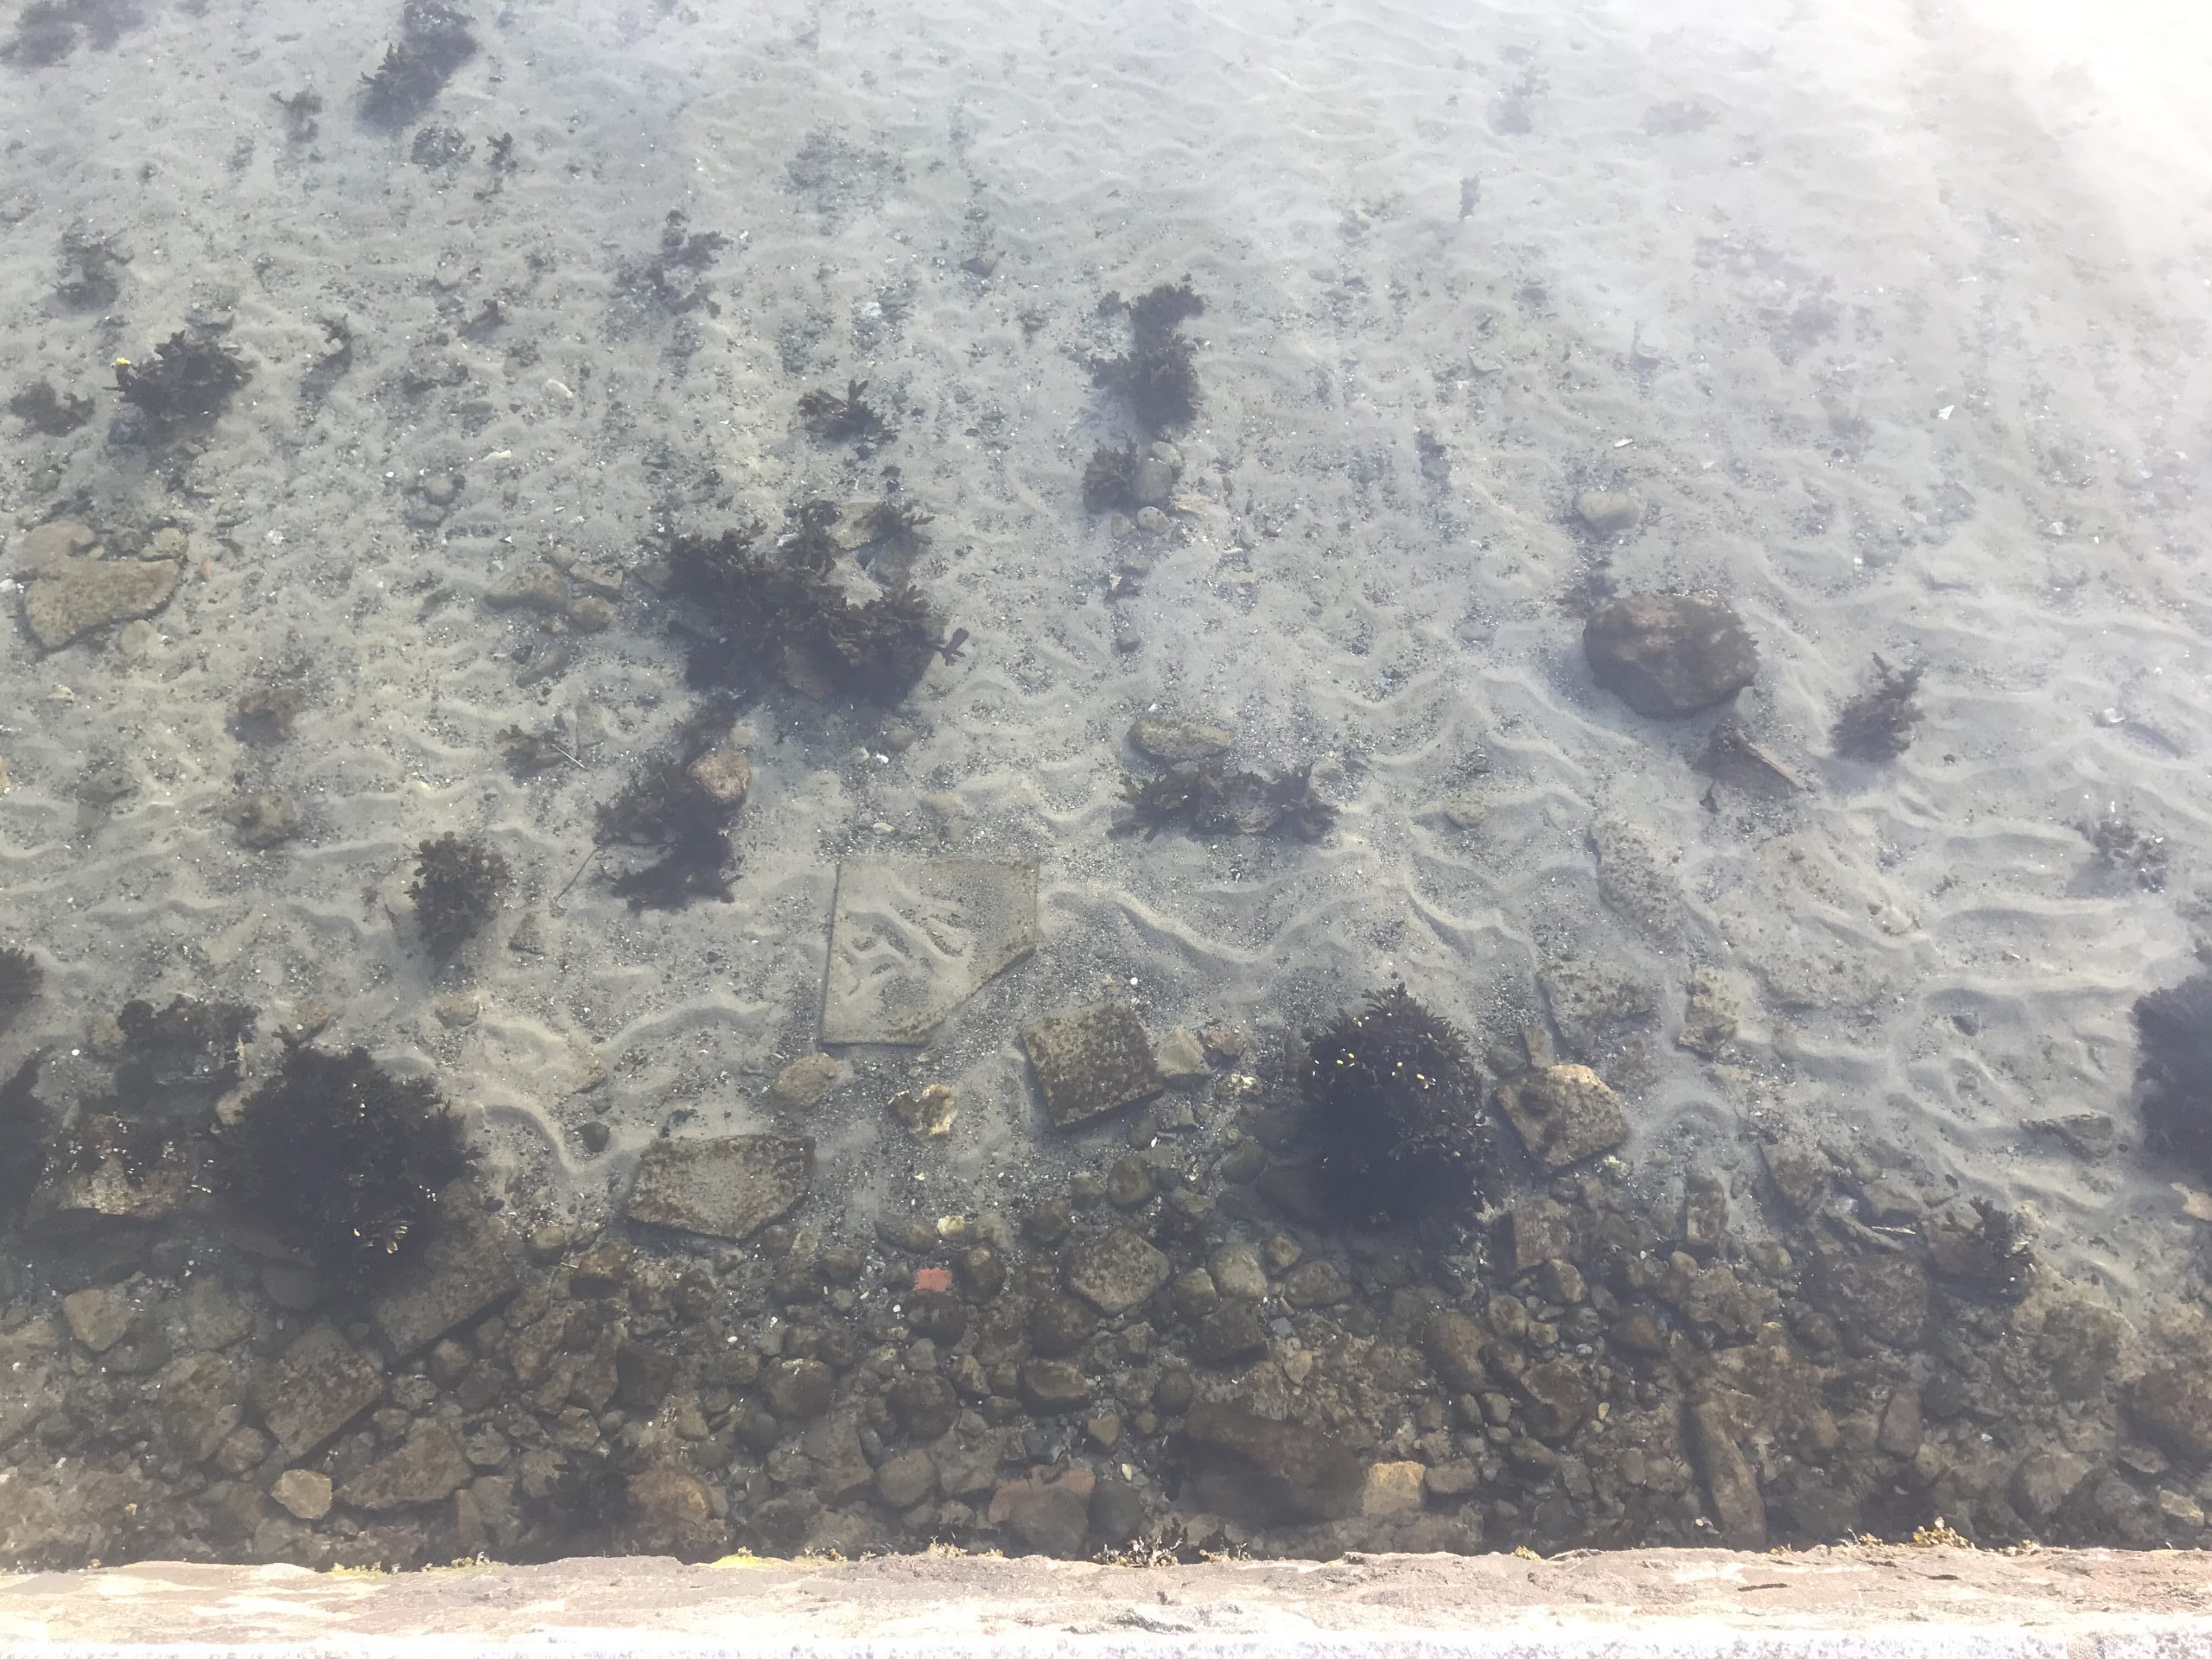
One thing I find very cool is when there are large, flat stones on the seafloor and they get partly covered in sand that forms ripples. I just think it looks super pretty!

Another one of those:

And here some very choppy ripples!

Here the ripples become more regular the further away from the seawall we look.

And now this one, if the light wasn’t so horrible, I would print and frame and put on my wall!

If you have made it all the way to the end of this post, tell me: Aren’t these ripples in the sand almost as fascinating as actual waves? And do you understand what’s going on there?

“Excursion week” in Oceanography 101 while physically distancing
My friend’s university recently decided that “excursion week” (a week in May during which there are no lectures or exercises or anything happening at university to make time for field courses during the semester) is cancelled this year. Which is, of course, not surprising given the current situation, but it isn’t cancelled as in “go have a week of vacation”, it’s cancelled as in “one more week of lectures”. Which is putting even more of a burden on people who are already struggling to provide students with the best teaching they can in a new, online setting. To help my friend out (as well as anybody else who might be teaching intro to oceanography classes right now), I’ve collected a couple of ideas of how to fill this week in a way that’s keeping at least a bit of the spirit of exploration alive.

Learning about concepts, observations, experimentation

Of course I can’t give you a solution that perfectly replaces a field course by something that isn’t a fieldcourse. But that doesn’t mean that many of the learning outcomes usually associated with field courses can’t be had in non-fieldcourse settings.

What are the learning outcomes that you care about most? Understanding of specific concepts? Then maybe those concepts, even though most impressively seen at the location where you typically go for your field course, can be observed in other places, too, if students are guided to find them. Or learning to observe following a specific protocol? Then maybe this protocol can be followed (or mostly followed) while collecting a different type of data than it is usually used on. Here are a couple of suggestions of ways to do this:

A: Field course at home

There are two different scenarios that I think can work well here: Having students explore the world right outside their home with a focus on topics from their course, or having them explore the enormous amount of available datasets on the internet.

A.1: Exploring the neighbourhood

Assuming students are able to walk around outside their homes (as they currently are where I’m at), having them explore the neighbourhood. There are different kinds of tasks that could work depending on your learning outcomes:

A.1.1: Find examples of specific science concepts

The tasks can be very specific (“find examples of hydraulic jumps“, “observe tidal flows in a river by watching moored structures move“) or not so specific (“pick a topic related to our class and find a way to observe it”). I think this is a really nice task because it helps students discover how prevalent the concepts are in their daily lives, rather than being something that only exists in books and lectures and really far-away locations that field courses would go to. Careful, as you see with my wave watching, this can get addictive!

A.1.2: Explain something you know for sure they will be able to observe

If you know where your students currently are, you can also ask them to observe specific features and explain them (“Make a time series of positions of that moored structure in the tidal river and relate the positions to the tidal cycle“, or for tons of ideas in Bergen see #BergenWaveWatching on Elin’s blog). This is also a really nice task, again because it brings concepts from the lecture into students’ real lives. It’s also maybe a little easier to relate to the rest of your course since you have a better idea of what they will be observing and interpreting.

A.2: Exploring the interwebs

This is just a quick side note, but of course there are TONS of data available on the internet. From observations of salinity, temperature, pressure mounted on seals in Antarctica, to winds and waves observed from satellites. Many of them even come with interfaces ready to do easy plots. And I’ve been a big fan of the lovely people on Twitter (shoutout to @aida_alvera and @remi_wnd particularly, I always love your posts!) that post interesting features from recent satellite images. So much to discover! Trying that for myself has been on my to do list for quite a while. You’d think I would find time for it during Corona isolation, wouldn’t you?

A.3: Ask others for observations that students can work with

Kinda like what I do with #friendlywaves where people send me pictures of waves and I try to explain the physics I see (while dreaming that it’s me on that ship in Lofoten…). This would be so much fun if students took pictures of interesting features they saw (or went through their old pics) and then shared them and asked each other for ideas what might have happened there. Or if you asked people to take pictures for you, or accessed webcams (like this one, looking at Saltstraumen, the strongest tidal current!), took screenshots and analysed those. I’d totally be in!

[Edit 13.5.2020: Here is a cool example of a virtual field course that was done at UNIS, using videos of field sites and discussing them in groups]

B: Kitchen Oceanography

Of course, #KitchenOceanography is my solution to everything. Need to make a class more interesting? Bring some #KitchenOceanography to the classroom! Can’t teach in-person classes but want people to still have hands-on experiences? Let them do #KitchenOceanography at home! Feel down in isolation and need something to cheer you up? Do some #KitchenOceanography!

So here are a couple of ways to have students do #KitchenOceanography while physically distancing.

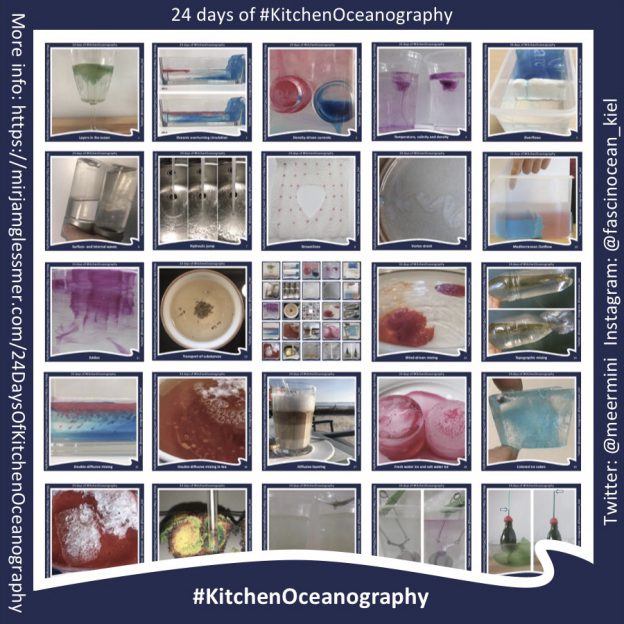
B.1: Following my 24 days of #KitchenOceanography

If you haven’t seen my 24 days of #KitchenOceanography yet, you might want to check it out. If you want to give your students a recipe for kitchen oceanography, there is probably something in there that works with your Oceanography 101 class! You could ask them to do one experiment that you find most relevant to your class, or pick one they find most interesting, or distribute all 24 experiments over all the students and have them report back.

And even though I’m so depriciatingly talking about “recipes” and structured activities, be assured that for most students things won’t end after they’ve done the experiment. There is ALWAYS something they observe that they still want to figure out, so there will be more experimentation going on than you expect!

B.2: Problem solving

This is a little more difficult to do if you and your students only communicate electronically and you can’t give them physical samples to investigate (but if you can place samples somewhere where students can easily and safely pick them up, you could for example give them salt water samples and ask them to figure out the sample’s salinity, or give them a fresh water and a salt water sample and ask them to figure out which one is which only using ice cubes). But there are still tons of ways problem solving can be practiced, for example by asking students to figure out ways to measure temperature, salinity and density.

B.3: Open-ended investigation

This is the most fun way to do kitchen oceanography, but depending on whether students have ever done these kinds of experiments before or not, it might be worth starting with a more guided kitchen oceanography experiment. But ultimately, this is where you ask students to figure things out in their kitchens. Currently on the list of things I want to try when I get the time (again, how is Corona isolation not the time for this kind of stuff? But somehow it isn’t): Can I actually see a change in the refraction of a spoon in a glass of very cold salt water as compared to warm fresh water? How big is that density effect? Would I be able to see the spoon bend where it goes through a density stratification in my glass? I bet you, once I start playing with this, that’s that for that evening!

C: Bonus idea: Ocean podcasts & books

There are two oceanography-themed podcasts that I really enjoy listening to (and I’m not a podcast person!): Climate Scientists and Treibholz. Both would be great to listen to interviews with super cool scientists while dreaming yourself away to expeditions to the Arctic or Antarctica. There is so much to learn from other people’s experiences in the field — why not ask students to listen to other people’s experiences with a focus on either the science, or the methods, or anything else?

And of course there are tons of books that would lend themselves to that, too, for example xplorer’s diaries. Nansen’s “Farthest North” (1897) for example fits super well if you wanted to talk about the discovery of dead water

Bringing it all together

The big question is: Once your students have done the tasks of finding/producing and describing phenomena, what do they do with that? It might not come as a surprise, but I think that they should be encouraged to publicly share them on the internet. Both because it’s a good opportunity for them to build their scicomm profile, but also because there are surpisingly many people who get really excited about (read here how Prof. Tessa M Hill‘s student Robert Dellinger posted a video of an overturning circulation on his 70-ish follower Twitter account, and the video has, as of  April 16th, 70 retweets and 309 likes!) and that’s such a motivating feedback for them!

Of course, the sharing and excited reactions could also happen within your university’s learning management system, but honestly … no. Ask them to share it via social media! I, for one, am definitely more than happy to comment and ask questions and share my excitement there! :-)

A #friendlywaves from Lofoten

A #friendlywaves post: you send me the pictures, I talk about physics! Today: My friend A sent me these lovely pictures from Lofoten, knowing I love wave watching. And there is so much to see!

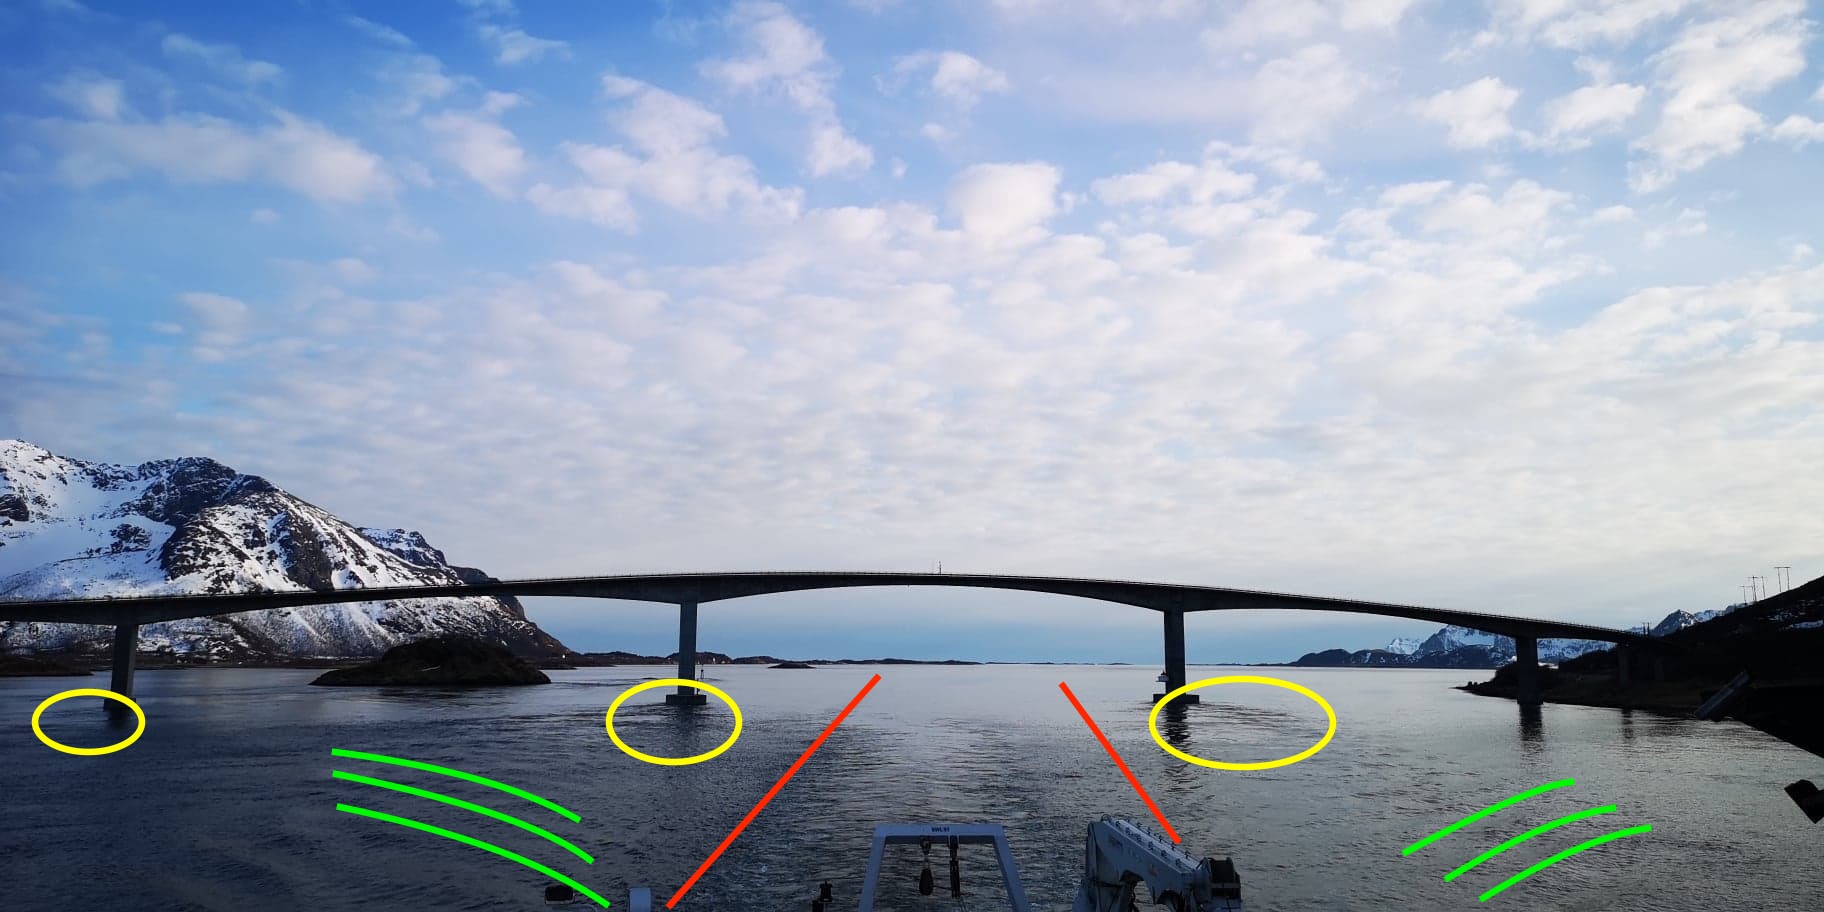
Let’s begin with the picture above, where we are looking out over the stern of a ship towards a bridge. There are two different kind of things that jump out to me: The ship’s wake and the tidal current.

The ship’s wake consists of two parts: The turbulent wake we see right in the middle of the picture, behind the A-frame crane (in between the red lines below), and the feathery V-shaped wake (some of the individual “feathers” are marked in green).

And then there is the turbulent backwater behind the bridge’s pylons that’s caused by the tidal current going through underneath the bridge. Pretty cool, isn’t it?

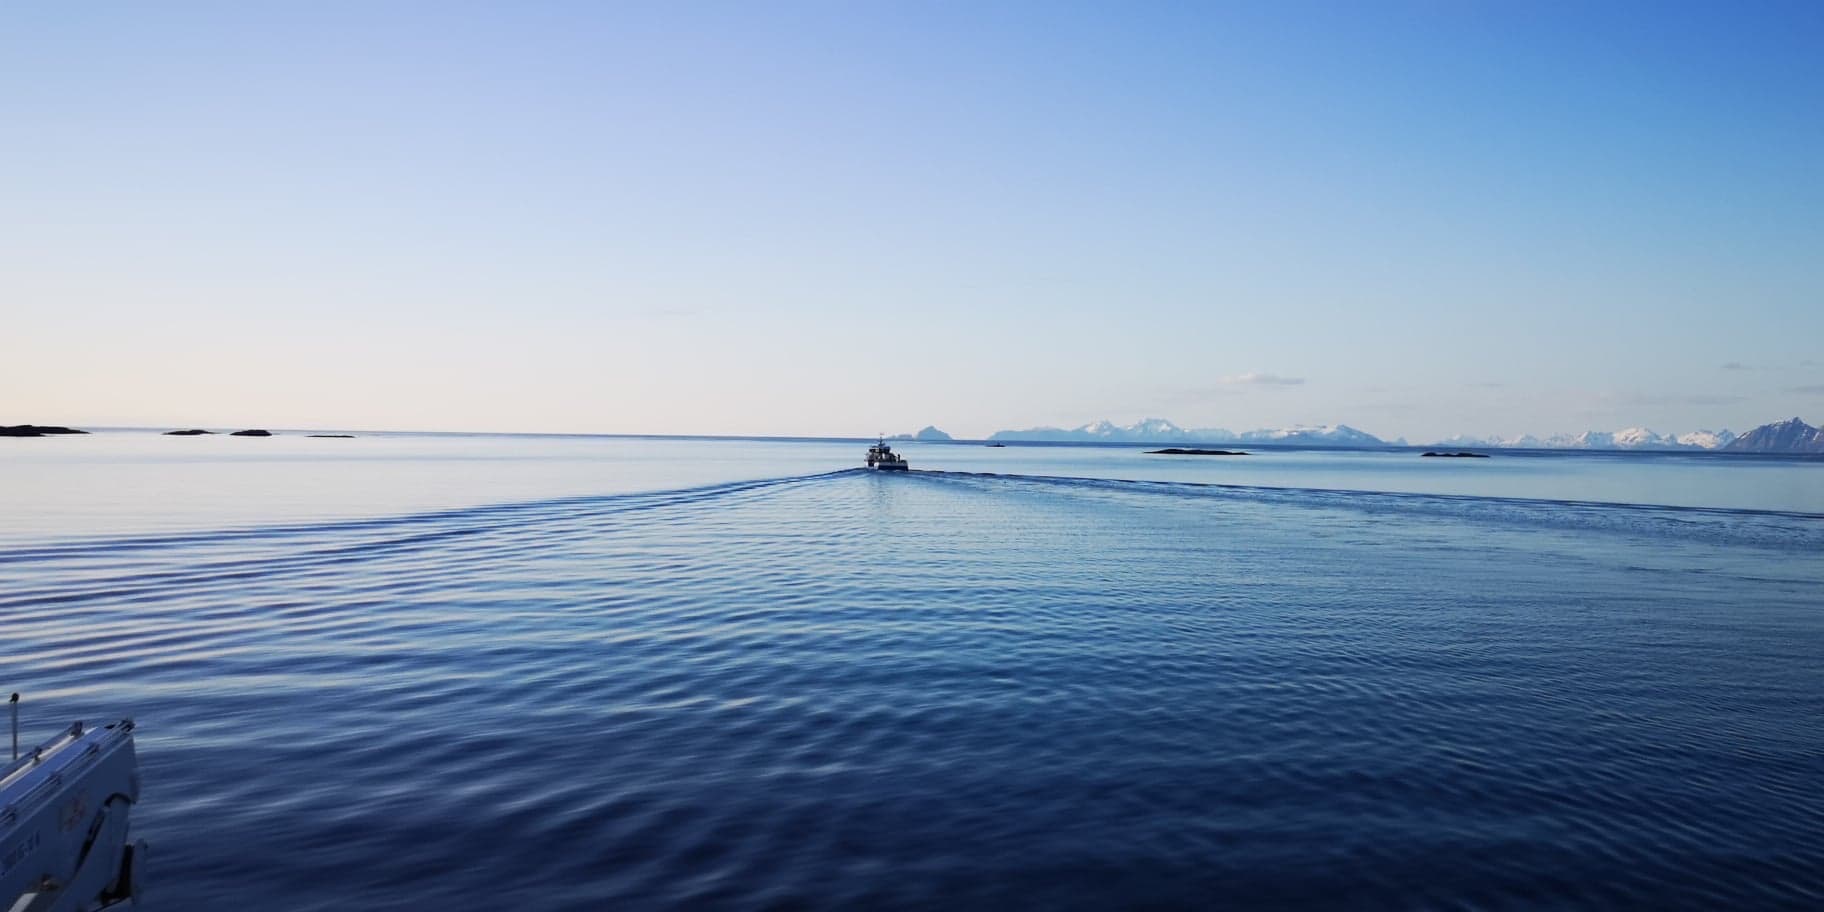
And now on to the next picture, that is one of the most beautiful wave pictures I’ve seen the last couple of weeks: Now we are sailing in the wake of a second ship.

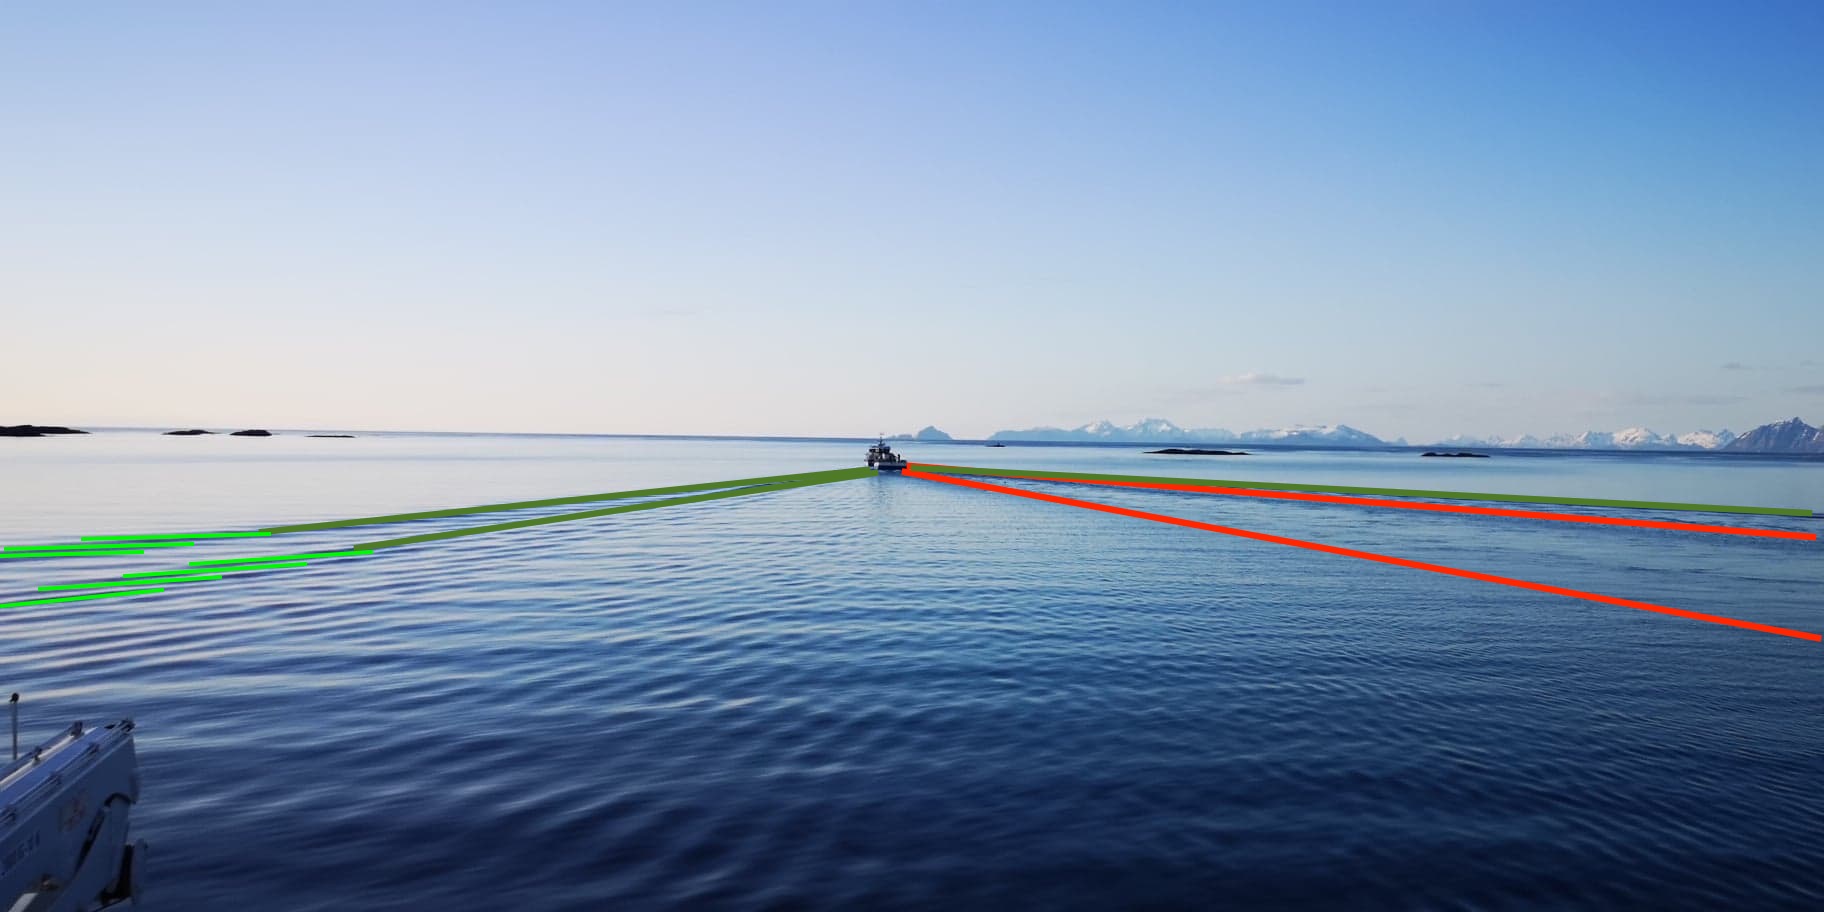
We are following the other ship a bit off to the side, therefore the perspective is a little confusing. Between the red lines, we see the other ship’s turbulent wake. Additionally, it has an interesting V-shaped wake that actually consists of two stacked Vs, a bit like this: <<

One of the Vs is the actual bow wave radiating from where the ship’s bow cuts through the water, the second one detaches further backwards from the ship. Both Vs are marked in dark green below. But to the left of the picture, in light green, I marked some of the individual “feathers”, wavelets that make up the V-shaped wake.

Isn’t it fascinating? I love this.

Evaluation rubric for Instagram posts (in scicomm and/or science classes!)

Social media is a great tool in science communication, so learning how to use it well is helpful not only for people who self-identify as science communicators, but also for scientists and scientists-to-be.

Teaching social media science communication skills

I’ve explained why I think that that is generally a good idea in our recent virtual poster, but here is an even more recent example of how well it can work: In early April, Prof. Tessa M Hill encouraged her class at UC Davis to do kitchen oceanography experiments and post pictures or videos on the internet. Her student Robert Dellinger posted a video of an overturning circulation on Twitter that got me super excited (and he kindly agreed to write this guest post on it) and as of now, April 16th, it has 70 retweets and 309 likes. That’s  an incredible reach! And if you think it’s just a lucky strike, another student from that class, Linnea Byrd, posted pictures on Instagram which got 276 likes. This might be to a beautiful cover pic and an account with a high following in the first place, but that’s still a lot of people exposed to kitchen oceanography. Both are definitely examples of very successful scicomm!

Talking with Prof. Kerstin Kremer in preparation for a recent science communication course I taught at her university, I decided that I wanted to set up an “evaluation rubric” that can be used for two purposes: As tool in teaching; and to evaluate social media posts.

Making expectations transparent to students

When teaching about the use of social media in science communication, there is a fine balance between, on the one side, a lot of information on what works and what doesn’t (aka “the rules”), and on the other hand the fact that the things that work best are when those exact rules are purpusefully and skillfully broken. But in order to do that, I believe that one needs to first know “the rules”, and the rubric below gives a structured overview that can be used as guidlines when creating an Instagram post.

Grading the students’ Instagram posts

For some classes, Instagram posts are created as artefacts that contribute to the course grade. In those cases, it is very important to be very clear about what the learning outcomes are and how they will be evaluated; especially if the posts are evaluated by someone who did not teach the class themselves. For this, the rubric below might be helpful.

Evaluation rubric for the scicomm aspect of Instagram posts

Please note:

  • This rubric is an example only and needs to be adapted and/or expanded to match your classes learning outcomes. Here, the focus is exclusively on the use of Instagram as a communication tool. For examples of how to expand this rubric for use in different contexts, see below
  • If points are awarded for each category listed below, they should obviously not be weighted equally when calculating a grade, but priorized according to the class’s learning outcomes
  • I’ve only formulated the end points; obviously this could be expanded to explicitly name intermediate qualitiy levels if that makes grading easier for you; I just wanted to put up a general framework.

The basic rubric is structured into four categories: The captions/comments of a post, the use of hashtags and tags, and the use of images.

Caption / Comments Not good………………….. …………………very good
Purpose Post does not fit in the usual context of the account and its target group; no context is given for why it is posted on that account It becomes clear why the post is published on a given account for its target group, either because it fits right in, or because contextual information is given
Background The post cannot be understood without pre-existing background knowledge All relevant background information is supplied
Structure No structure obvious The text is structured according to an obvious structure (hero’s journey, chronological, pro/con, facts/discussion, …)
Comments Caption breaks off in the middle of the sentence and continues in a comment without any explanation linking the two If the text is too long for the main caption, there is a comment at the end of the main caption pointing out that the text continues in a comment below
Jargon A lot of jargon in a text for kids, or too imprecise language for highly specialized/educated readers Choice of terminology appropriate for target group
Sentence length Only 3-word sentences or one sentence for the whole paragraph Good readability because of appropriate sentence length
Spelling and grammar Seems like post has not been proofread Correct spelling and grammar
Outlook Post “just ends” The reader is given a “next step”: Link to further reading, key word to google, invitation to follow, call to action, …
Emojis Way too many or unrelated to the topic Appropriately used for the target audience and topic


Tags of other accounts Not good………………….. …………………very good
Fit Way too many, and for no apparent reason Relevant accounts are tagged (e.g. photographer of picture, institution that did the research, people that were involved in the project, people shown in the picture, …)


Hashtags Not good………………….. …………………very good
Number None, or way too many 3-11
Fit No relation of hashtags to content of post, or bad fit Hashtags describe the content of the post well and enable potentially interested audiences to find it
Language Hashtag in random languages Language matches the language of the post or complements it in a useful way (e.g. English post with English hashtags additionally uses German technical terms as hashtags to point to scicomm at a German institution)


Picture Not good………………….. …………………very good
Best practice Picture does not follow best practice recommendations Picture follows best practice recommendations, e.g. no polar bears to raise awareness for climate change, careful with protest imagery, causes showed at scale, … (For climate communication practices, see climatevisuals.org)
Fit Picture unrelated to content of post The picture contributes information to the post
Reference Picture is not referred to in post Each picture is referenced in the text and has a clear purpose to the narrative
Quality Picture clearly not tailored for Instagram and no explanation for why it was used anyway The focus is on the relevant aspect or it is explained why the focus is elsewhere
Rights Picture not credited to rights holder The author holds the rights and/or gives appropriate credit

Evaluation rubric for other aspects of Instagram posts

Of course, you might also want students to break some of “the rules” I gave above if your focus is on other aspects. For example, of you are very interested in how well students are working with literature, even though that is not something that is traditionally done well on Instagram, it is a very valid learning outcome that you might not want to give up, even if it breaks the traditional Instagram style. Then you could include criteria like these ones:

To practice citations Not good………………….. …………………very good
Citation number No citations Appropriate number of citations
Citation quality Cited literature not relevant for the topic discussed in the post, or list very incomplete All relevant literature to the topic is cited
Citation correctnes Incorrect use of citation style or inappropriate citation style Appropriate citation style, correctly used

Or if you are using Instagram posts in place of more traditional lab reports, of course additional learning outcomes are to be evaluated. Categories might then include, for example, the ones below. But use any criteria that you would use to evaluate a lab report!

As a lab report Not good………………….. …………………very good
Question It doesn’t become clear why experiments were done It is clearly stated what research question is being investigated
Context It doesn’t become clear if anyone else has ever done work related to the experiment presented here The experiment is placed in the context of existing research and theories
Hypothesis No hypothesis is stated A hypothesis is clearly stated and it is also justified on what basis it was formulated
Plan It is not clear which steps are being done, in which order, and why A clear plan of steps is presented together with a rationale for the steps and their order
Method It is not clear what methods are being used, and why It is clearly stated which methods are being used and for what reason they were chosen
Observations There are none Observations are clearly described
Interpretation It is not clear how conclusions are formed from the observations, or there are no conclusions There is a clear separation between observations and the conclusions that are being drawn on the basis of those observations

Now let me know what you think. Was this blogpost useful for you? What other aspect of using social media in science teaching would you be interested in?

Anna is answering questions on our Nature article at #ShareEGU20

It feels like an enourmously long time ago that our article on “ice front blocking of ocean heat transport to an Antarctic ice shelf” got published in Nature, but it was in fact only a little more than two months ago. Only right after, life changed so drastically that it feels as if it’s been decades since…

But anyway, here is your chance to ask any and all questions related to that article that you might have! At #shareEGU20, EGU’s “sharing geosciences online” event, anyone can log onto their system and ask main author of the article, Anna Wåhlin, all they ever wanted to know! How cool is that?