Tag Archives: tank experiment

Standing waves in a tank

And really high order ones, too!

On Monday, I showed you a movie on wave generation in Hamburg Ship Model Basin (HSVA)’s wave tank. At the end of that movie, we see that the wave energy is being dissipated by a “beach”. Well, we actually see that some of the energy is reflected in those cute little baby waves. And there is another fraction of the total energy that passes through the beach into another part of the tank. And that’s what I want to show you today.

When I’ve talked about standing waves in a tank before, that always meant the simplest form: Only one node. We have always tried to avoid higher-order modes before, partly because they are a lot more difficult to generate, at least using our method.

But here is what happened in the wave tank:

Isn’t it beautiful?

Stokes drift

When a higher-order effect suddenly becomes important.

During our excursion to Hamburg Ship Model Basin (HSVA), one of the experiments we ran was on Stokes drift. You can already see in that post’s movie that there is some swimming thing moving down the tank in the direction of wave propagation, but of course we had to quantify.

“Experiment” sounds too sophisticated for what actually happened: We dropped a piece of styrofoam in the waves and took the time it took that styrofoam piece to travel two meters. The piece of styrofoam has the advantage over the other swimming thingy that it hardly sinks into the water, and therefore constitutes an almost passive tracer of the waves’ movements.

Now, we all know that Stokes drift is one of those ugly non-linear higher-order things that we ignore as much as possible. It is basically the effect of orbital movements not being closed circles, but rather spirally things. But we have all heard over and over again that the effect can be neglected, and whenever we see a bird bobbing up and down in the waves but also moving horizontally, we quickly rationalize that it must be swimming autonomously, or that there is a current superimposed on the wave field.

So, what do you think, how long will it take for that little styrofoam piece to travel 2 meter’s distance? Of course that depends on the kind of wave field, but give it a rough guess. What’s your estimate?

36 seconds! To travel 2 meters! That doesn’t sound so insignificant now, does it? I’m still trying to figure out why that happened because it seems way too fast. And according to theory it should even have travelled faster than that. So please excuse me while I put on my thinking cap…

Wave tank

Excursion to Hamburg Ship Model Basin.

I recently got to join a class on their excursion to Hamburg Ship Model Basin (HSVA, “Hamburgische Schiffbau-Versuchsanstalt” klingt so viel besser!). Those are amazing facilities and shipbuilding students are always excited to go there and get a glimpse at all the exciting research going on. Since they are working on the cutting edge of naval architecture, unfortunately I couldn’t take pictures of any of the model ships. But that doesn’t make this any less exciting – I still got to take pictures of the waves! :-)

IMG_0717

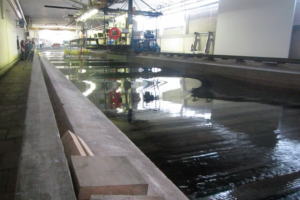
Waves in the “small” towing tank (80 m in contrast to 300 m) at HSVA. Notice the student group in the back on the left? That’s how long the tank is. And they aren’t even at the far end… 

Below is a movie of waves being generated in the 80 meter long towing tank. Pretty amazing!

Thanks for taking us, Robinson! :-)

Eddies in a jar

Rotating experiments in your kitchen.

Do you know those Saturday mornings when you wake up and just know that you have to do oceanography experiments? I had one of those last weekend. Unfortunately, I didn’t have a rotating table at hand, but luckily most of my experiments work better than the exploding water balloon time-lapse I showed you on Monday, so this is what I did:

MVI_0698

Dye spiral

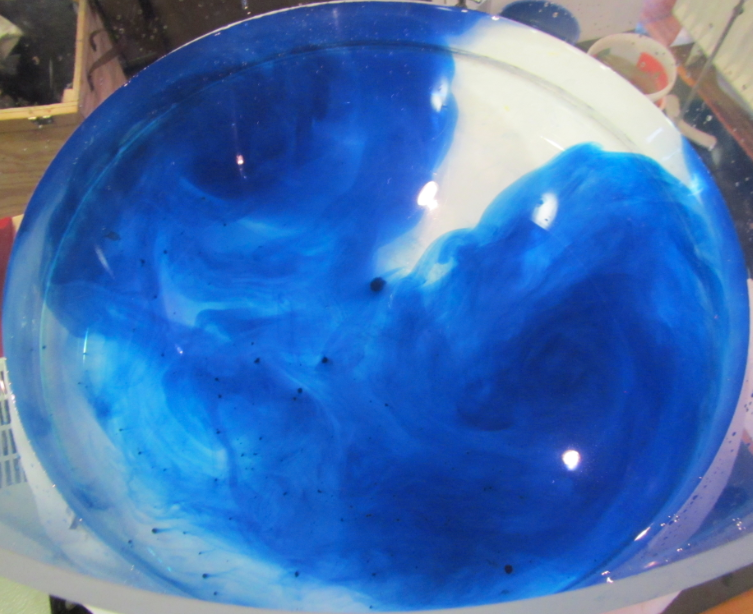
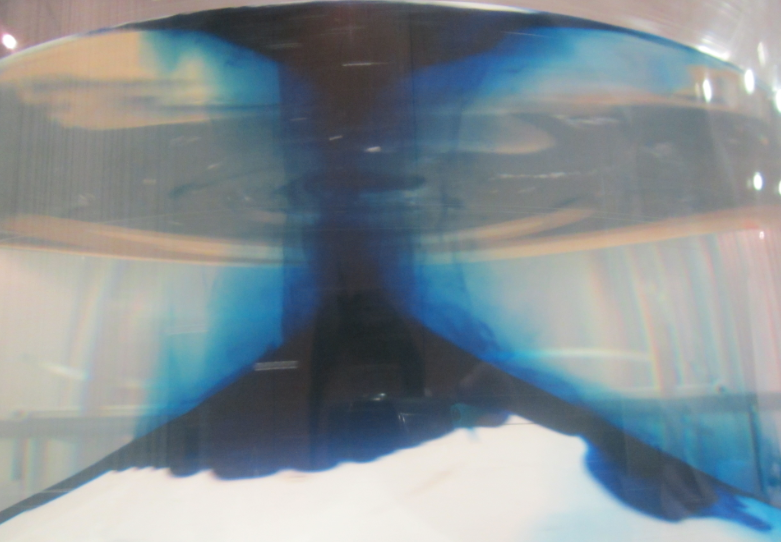
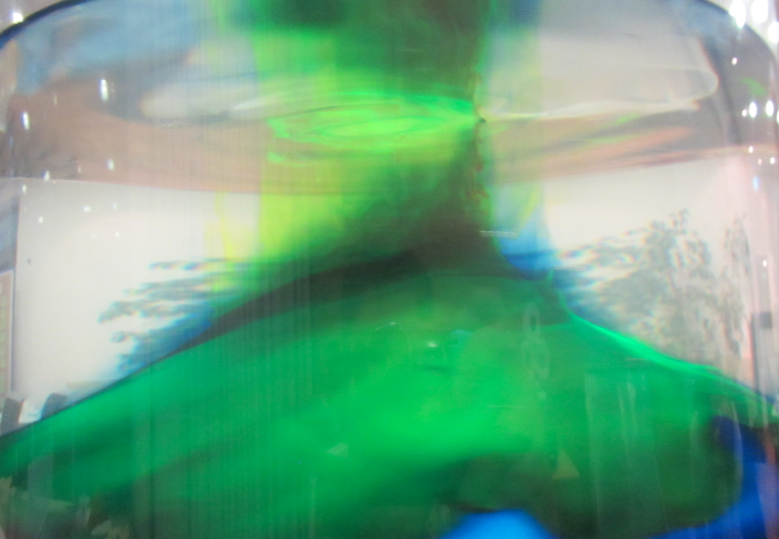
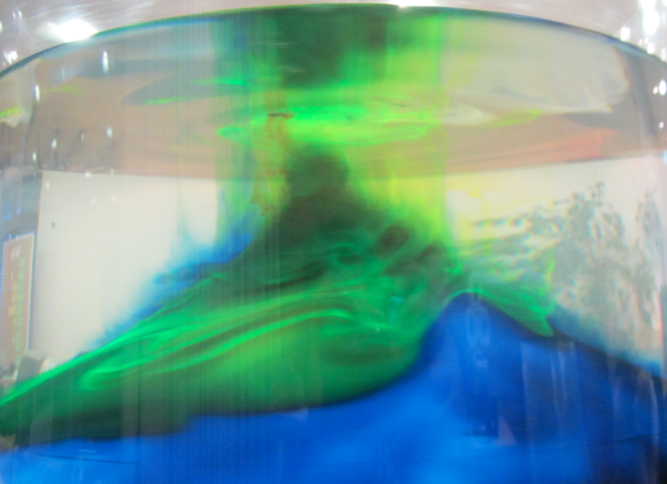
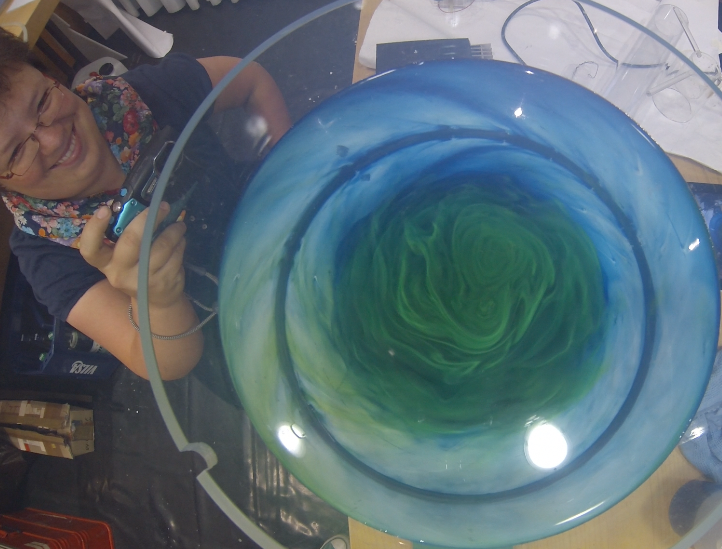
I took a large cylindrical jar, filled it with water, stirred, let it settle down a little bit and then injected dye at the surface, radially outward from the center. Because the rotating body of water is slowed down by friction with the jar, the center spins faster than the outer water, and the dye streak gets deformed into a spiral. The sheet stays visible for a very long time, even as it gets wound up tighter and tighter. And you can see the whole eddy wobble a bit (or pulsate might be the more technical term) because I introduced turbulence when I stopped stirring. So pretty, the whole experiment. And so satisfying if you need a really quick fix of oceanography on a Saturday morning!

Watch the movie below if you want to see more. Or even better: Go play yourself! It’s easier than making one of those microwave mug cakes and sooo goooooood :-)

Creating a continuous stratification in a tank, using the double bucket filling method

Because I am getting sick of stratifications not working out the way I planned them.

Creating stratifications, especially continuous stratifications, is a pain. Since I wanted a nice stratification for an experiment recently, I finally decided to do a literature search on how the professionals create their stratifications. And the one method that was mentioned over and over again was the double bucket method, which I will present to you today.

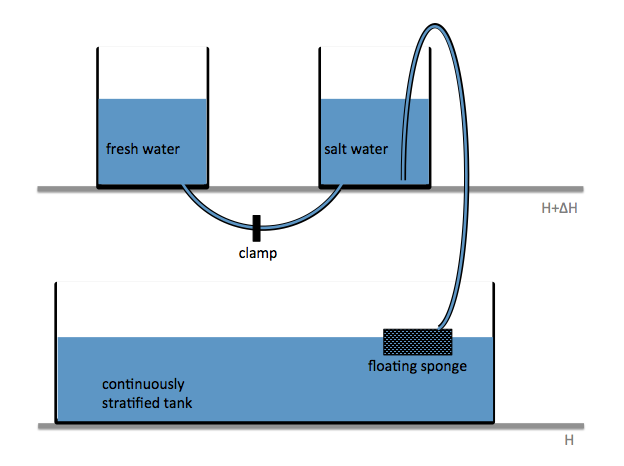
Two reservoirs are placed at a higher level than the tank to be filled, and connected with a U-tube which is initially closed with a clamp. Both reservoirs are filled with fresh water. To one of the buckets, salt is added to achieve the highest desired salinity in the stratification we are aiming for. From this bucket, a pump pumps water down into the tank to be filled (or, for the low-tech version: use air pressure and a bubble-free hose to drive water down into the tank as shown in the figure above!); the lower end of the hose rests on a sponge that will float on the water in the tank. When the pump is switched on (or alternatively, the bubble-free hose from the reservoir to the tank opened), the clamp is removed from the U-tube. So for every unit of salt water leaving the salty reservoir through the hose, half a unit of fresh water flows in to keep the water levels in both reservoirs the same height. Thus the salt water is, little by little, mixed with fresh water, so the water flowing out into the tank gets gradually fresher. If all goes well, this results in a continuous salinity stratification.

Things that might go wrong include, but are not limited to,

  • freshwater not mixing well in the saline reservoir, hence the salinity in that reservoir not changing continuously. To avoid that, stir.
  • bubbles in the U-tube (especially if the U-tube is run over the top edges of the reservoirs which is a lot more feasible than drilling holes into the reservoirs) messing up the flow. It is important to make sure there is no air in the tube connecting the two reservoirs!
  • water shooting out of the hose and off the floating sponge to mess up the stratification in the tank. Avoid this by lowering the flow rate if you can adjust your pump, or by floating a larger sponge.

P.S.: For more practical tips for tank experiments, check out the post “water seeks its level” in which I describe how to keep the water level in a tank constant despite having an inflow to the tank.

Simulations of hetonic explosions

Because sometimes it’s easier to control a computer than rotation, salinity, water and dye.

After looking at a non-rotating cylinder collapse the other day, it is time to look at proper hetonic explosions (you know? The experiment on the rotating tank where a denser column of water at the center of the tank is released when the whole tank has reached solid body rotation). In Bergen, we used to show this experiment as a “collapsing column” experiment, the tilting of a frontal surface under rotation. For those cases, all the parameters of the experiment, e.g. the rotation rate, the density contrast, the water height, the width of the cylinder, were set up such as to ensure that one single column would persist in the middle of the tank. At JuniorAkademie, we’ve also run it in other setups, to form dipoles or quadrupoles. For a real hetonic explosion, we would typically go for even more eddies than that.
Screen shot 2014-08-25 at 7.36.25 PM

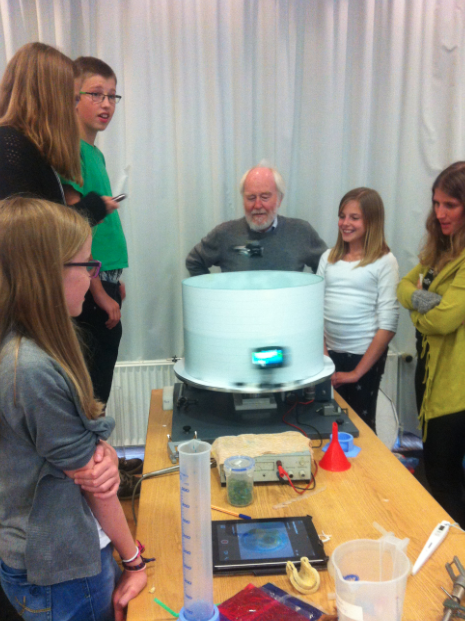
Students watching the experiment shown below. We put paper on the outside of the tank because all the feet swiping past are kind of distracting on the movie later, but that is obviously really annoying for live observers. But in our defense – we only did this once for one experiment late one evening, and didn’t expect so many people to be interested in the experiment! Plus they got to watch on the tablet which showed the top-camera’s view via WiFi… ;-)

But if you read through all those posts then, you might remember that I’ve been complaining about how it is really difficult to set up an experiment in such a way that you have total control over the amount of vortices that form. Firstly, because the system is inherently chaotic, but let’s forget about that for a minute. But then because the calculations aren’t that easy for school kids to do, and then even when everything is calculated correctly, water has to be prepared with the correct salinity, the rotation has to be set to the correct period, the cylinder has to be completely centered in the tank, the water level has to be just right and when the cylinder is pulled up, this has to happen with a swift movement as to add as little disturbance as possible. Not an easy task, especially when there is a camera mounted on the tank!

To show us what to expect, Rolf did some model simulations for us. This is what a monopole looks like:
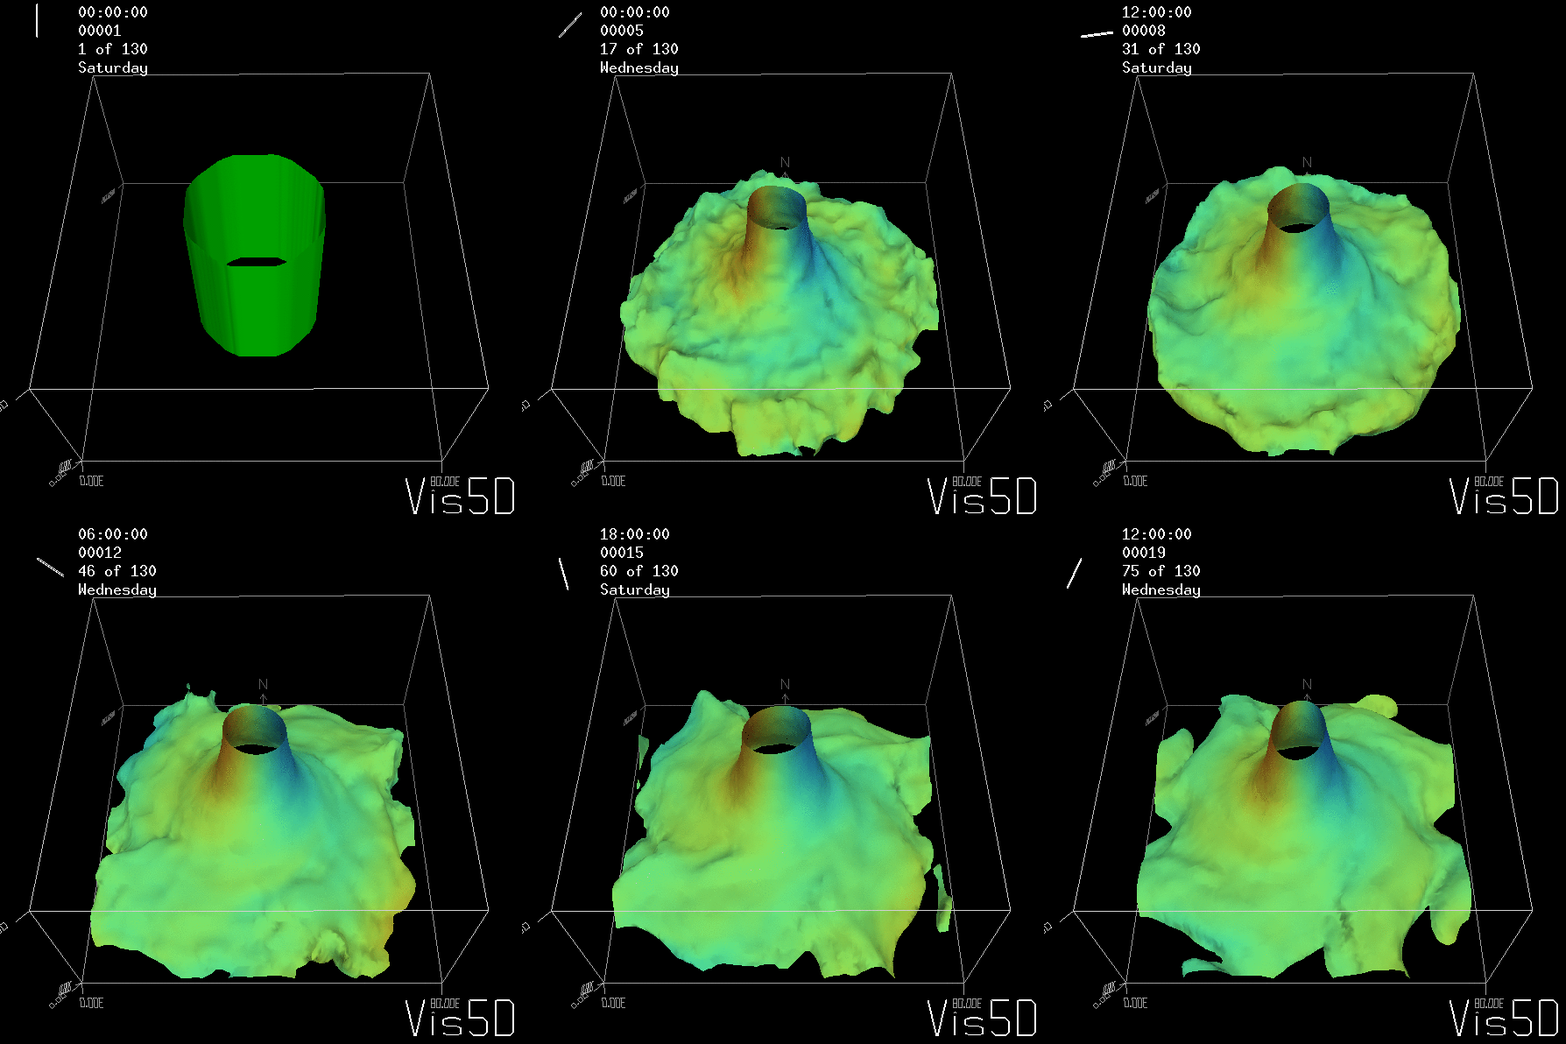
Shown is an isoline in density, separating the dense water below from the lighter water above. Superimposed are the horizontal velocities, so you get a sense of the rotation.

For more advanced experimentalists to recreate, here a dipole:
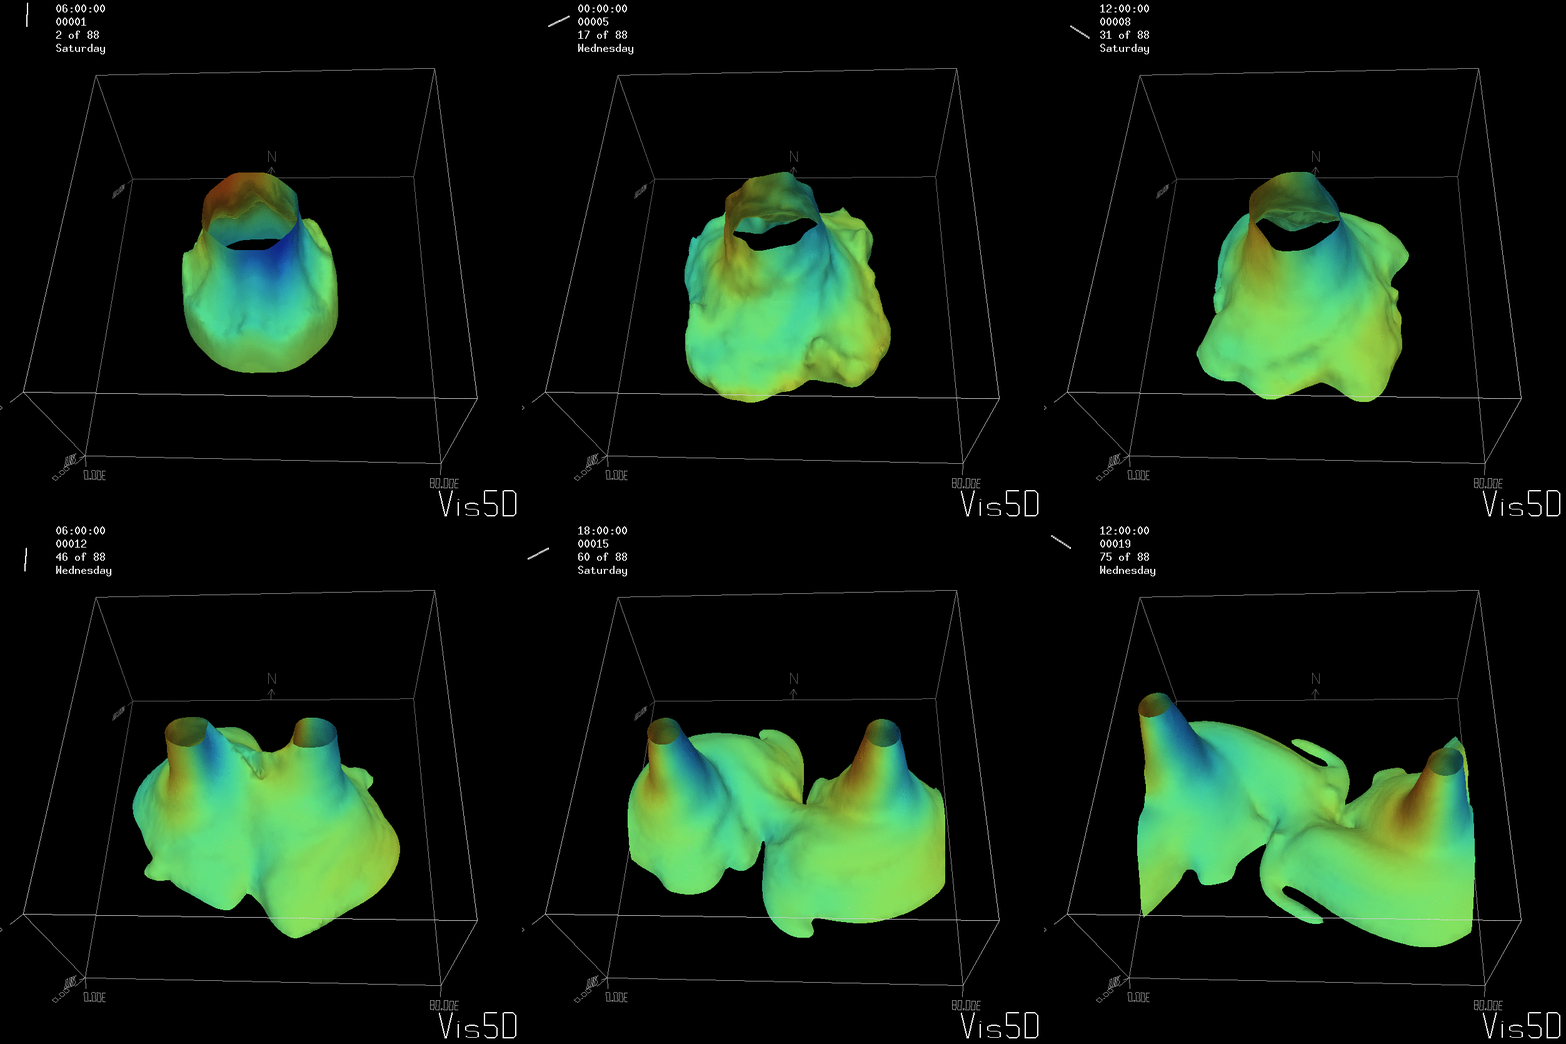
As for the monopole, you see chimneys that are open on top. That is because the density is higher than the one of the isoline inside the eddy, so you get the impression that you can look inside.

But the picture is different for quadrupoles, here the four eddies (that form when the central column breaks up) do not reach the water surface any more, hence they appear closed in the visualization below.
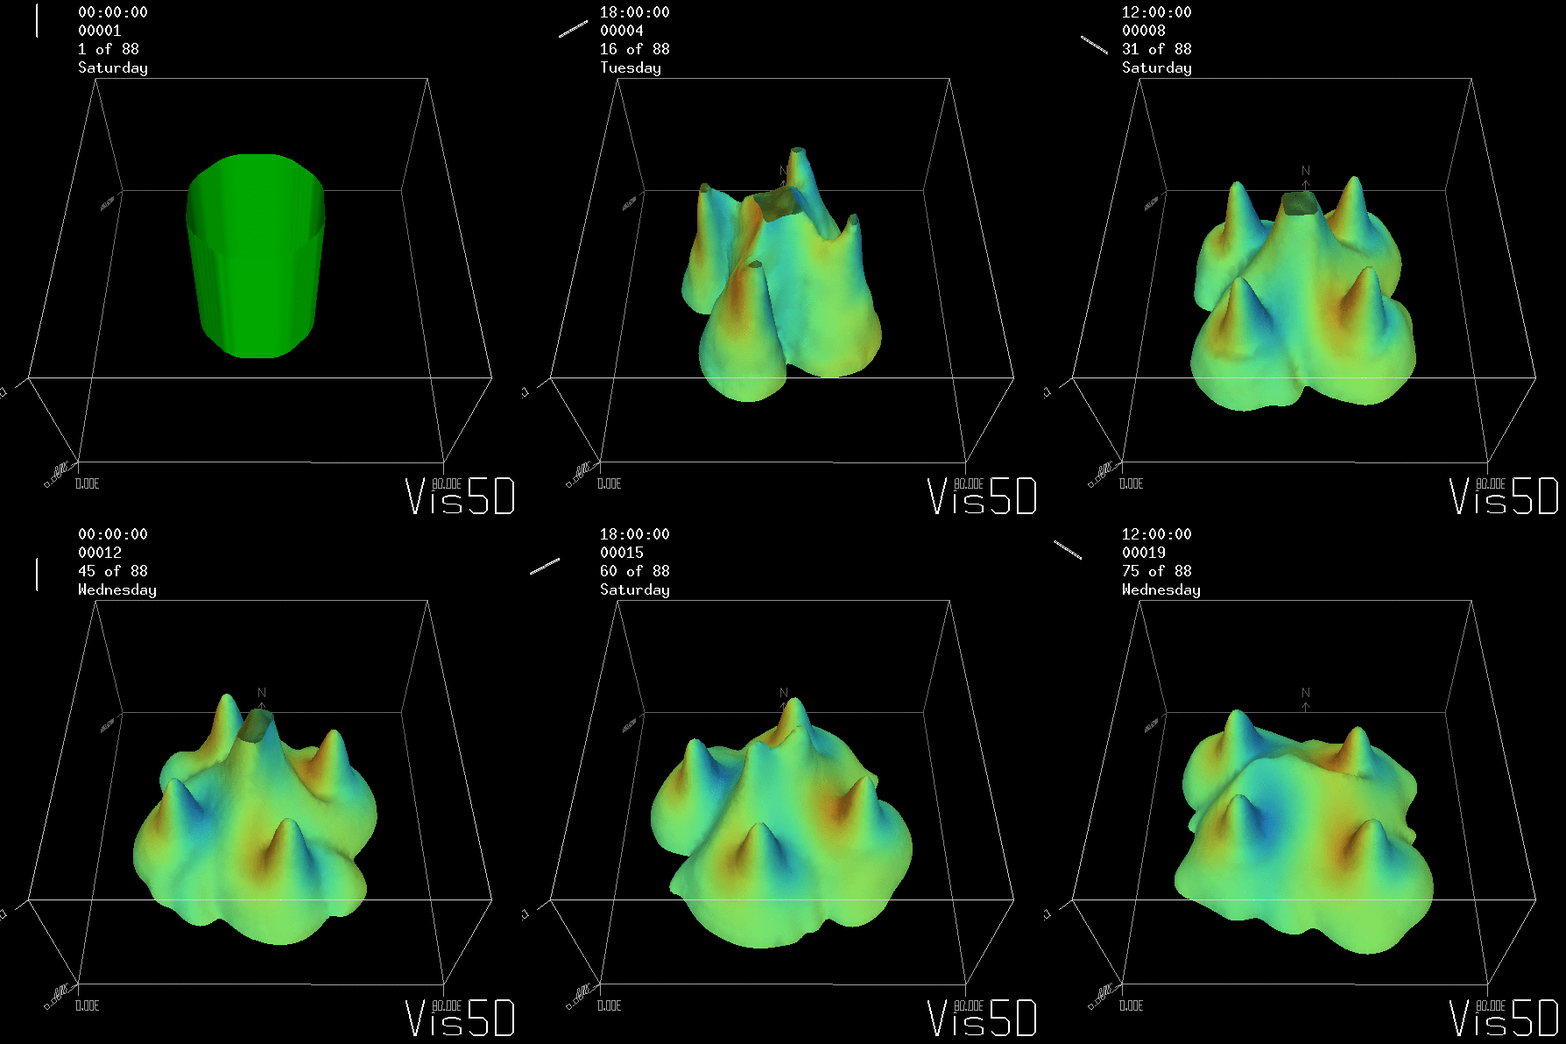
Btw, the time is of course not measured in weekdays, that’s just a glitch in the visualization that we didn’t fix.

Seeing the simulated situations for the three cases above was quite comforting  after having run this experiment a couple of times. When you run the experiment in a tank, there is always a lot of turbulence that you wish wasn’t there. But it really helps to keep your expectations in check when you see that in the simulation there are always little vortices, trying to break away from the main ones, too, and that that is how it is supposed to be.

So now for an attempted experimental monopole, which turned out as a dipole due to turbulence introduced when removing the cylinder, similarly to what happened to us in the no-rotation collapsing column experiment.

When you watch the side views closely, you can see that the tank appears to be wobbling (which we usually can’t see, because this is the only time we taped a camera to the side of a tank – usually when filming from the side, I film from outside the rotating system, holding the camera in my hand). You see it most clearly when the yellow dye crystals are added – the water is sloshing back and forth, and that is most definitely not how it is supposed to be. Oh, the joys of experimentation! But what is pretty awesome to see there is how the vertical dye streaks get pulled apart into sheets as they get sucked into the vortices. Reminds me of Northern Lights! :-)

Collapsing column

Or: This is what happens to a hetonic explosion experiment without rotation.

I’ve posted a lot while at JuniorAkademie a while back, so it is hard to believe there are still experiments from that time that I haven’t shown you. But I’ve probably only shown you about half the experiments we’ve done, and there are plenty more in the queue to see the light of day on this blog!

Today I want to talk about hetonic explosions (you know? The experiment on the rotating tank where a denser column of water at the center of the tank is released when the whole tank has reached solid body rotation). In Bergen, we used to show this experiment as a “collapsing column” experiment, the tilting of a frontal surface under rotation. For those cases, all the parameters of the experiment, e.g. the rotation rate, the density contrast, the water height, the width of the cylinder, were set up such as to ensure that one single column would persist in the middle of the tank. At JuniorAkademie, we’ve also run it in other setups, to form dipoles or quadrupoles. For a real hetonic explosion, we would typically go for even more eddies than that.

Today I want to show you this experiment under very special conditions: The no rotation case!

For all of you oceanographers out there who know exactly what that experiment will look like, continue reading nevertheless. For all of you non-oceanographers, who don’t know why some oceanographers might be disappointed by this experiment, continue reading, too!

You see, one of the fundamental assumptions we often make when teaching is that what is exciting to us, the instructor, is exciting to the students, too. And the other way round – that experiments that we might find boring will be boring the students, too. But I often find this to be completely wrong!

In case of the hetonic explosion experiment with no rotation, the experts know what will happen. We pull out the cylinder containing the denser water, so the denser water column will collapse and eventually form a layer of denser water underneath the rest of the water. We know that because we are aware of the differences between rotating and non-rotating systems. However, many students are not. And if you don’t have a strong intuition of how the water will behave, i.e. that in this case you will eventually have two layers, rather than a dense column surrounded by lighter water, it is not terribly exciting when you finally do the rotating experiment and – contrary to intuition – the dense water does not end up below the lighter water. So in order to show you in my next post what to be excited about, today I am showing you the normal, non-rotating experiment:

http://vimeo.com/105481230

But note that the experiment is not nearly as boring as you might have thought! We had put a lot of vaseline at the bottom of the cylinder to prevent the denser water from leaking out, so when the cylinder was pulled up, it gave an impulse to the dense column, which ended up splitting up into a dipole upon hitting the wall of the tank. Still looks pretty cool, doesn’t it? And for this to be a good teaching video, I really should have continued filming until the layers had settled down. In my defense I have to say that we had a second experiment set up at the other rotating table that we wanted to run, so I had to get the cameras over to the other table… And you’ll see those movies in my next post!

Double overflow

Because sometimes one overflow simply isn’t enough.

Finn’s group came up with – and ran – an overflow experiment with many different densities and even more colors. While the movie didn’t turn out too well, the idea was pretty awesome.

Rolf went ahead and modeled the experiment right away. And because the plume didn’t go across the second ridge in a dramatic enough fashion, he did the same experiment again, this time with a higher density contrast.

overflow_saltier

Salinity – the higher, the redder, the lower, the bluer. Density higher than in the figure above. Figure courtesy of Rolf Käse

If you compare those two figures, you notice that the second one is a lot more diffusive than the first one. To test whether the model was doing well, we obviously had to run both experiments in the tank, too. Watch the movie below to see how they turned out:

Turns out that also for us, the run with the higher density contrast is a lot more diffusive. Kelvin-Helmholtz-instabilities develop on the first down slope of the first ridge, and generally a lot more mixing is going on. To get an impression of the regions of high mixing and recirculation, rather than guessing from the diffusing salinities, Rolf displayed the horizontal velocity:

overflow_velocity_saltier

Along-tank velocity. Blue to the left, red to the right. Figure courtesy of Rolf Käse.

Notice the high mixing whenever the plume is running down a slope, and then the recirculations in the valleys. Pretty awesome, huh?

Cylinder collapse on a cone

Water running uphill during spin-down – how much more awesome can it get?

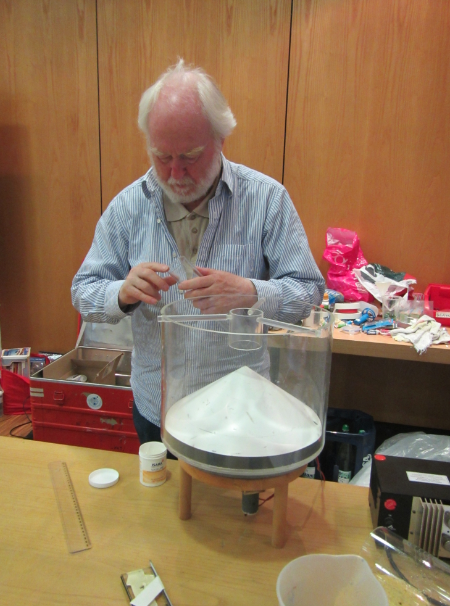
After hours, when all but the most curious students had left, Rolf and I ran another collapsing cylinder experiment, this time on Rolf’s old disk player turned rotating table.

IMG_9097

Rolf setting up the experiment

Rolf has a cone-inset for the round tank, and we set a cylinder on top of the cone and filled it with dyed salt water. The rest of the tank was filled with fresh water and the whole system spun up into solid body rotation. Then the cylinder was pulled out and here is what happened:

IMG_9107

Column sitting on top of the cone!

The column sat right on top of the cone! And stayed there, and stayed there, and stayed there. Slowly a bottom boundary layer started creeping down the slope, so we decided to add more color.

IMG_9119

Still only one column on top of the cone

Nice to see that, for a change, we calculated all the parameters correctly! But then The Boss himself had done the calculations this time round…

IMG_9120

The column creeping back up the slope during spin-down

But the most fascinating thing happened during spin-down when we had stopped the tank: The column slowly withdrew up the slope again! Our two fascinated students were absolutely wowed (and that’s saying something – they were really impressed with the salt fingers earlier already).

Watch the movie below for some impressions of the experiment.

Salt fingering

My absolute favorite experiment ever: salt fingering.

I know I’ve said it before about another experiment, even today, but this is my absolute favorite experiment and I still get endlessly fascinated. I’ve written about salt fingering before, and given tips on run the experiment, but today we tried a different setup.

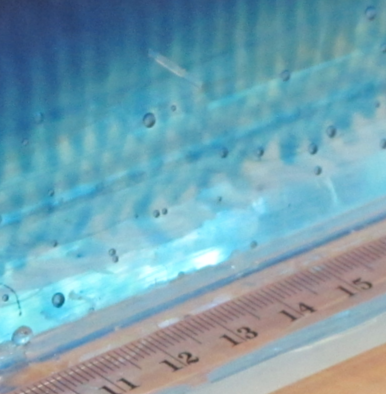
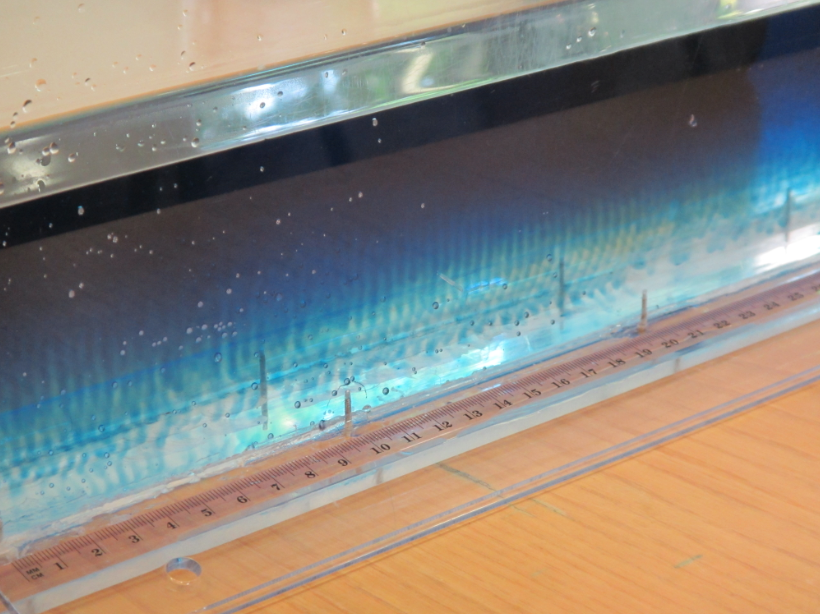
We used the same tank as in the “influence of salinity and temperature on density“, put warm, dyed water on the one side of the dam and cold fresh water on the other side.

Contrary to Rolf’s advice, we didn’t aim for specific temperatures and salinities to hit the density ratio in a specific way, but just went for really hot and really cold.

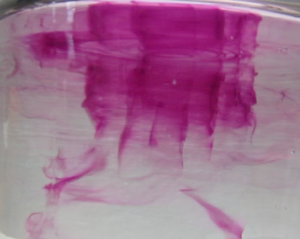
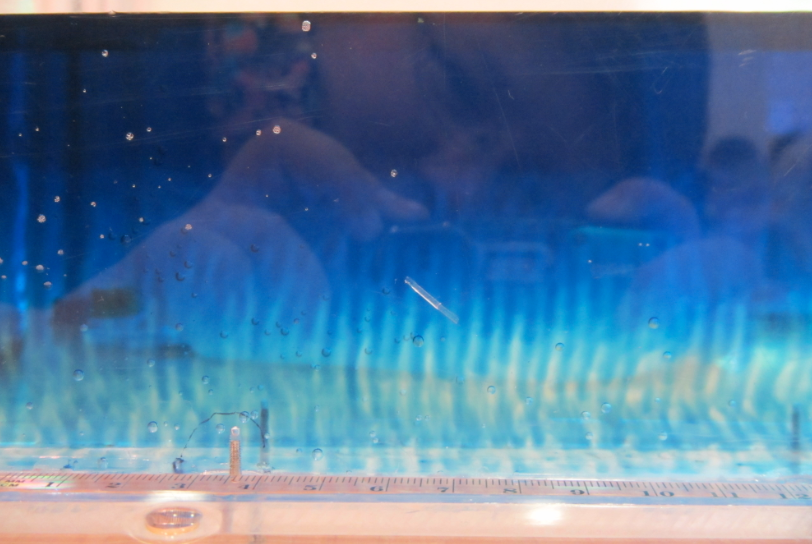
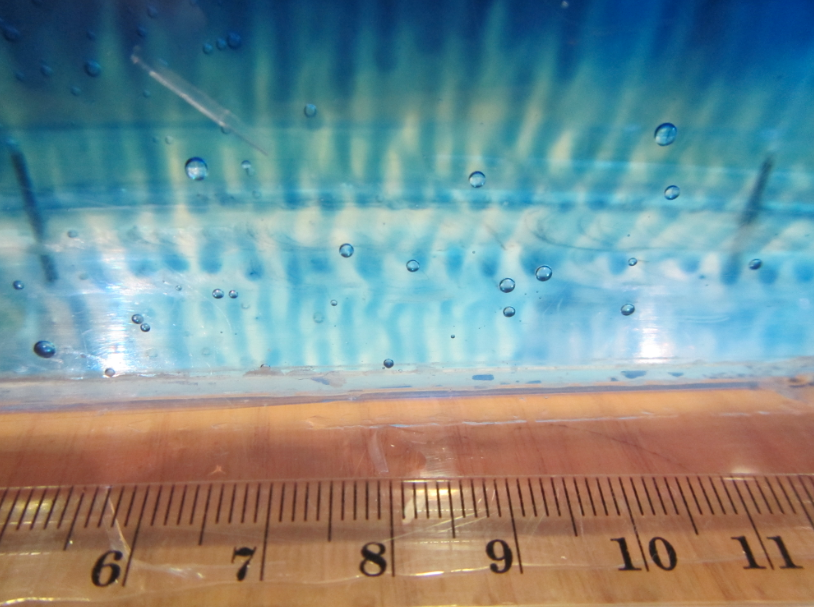
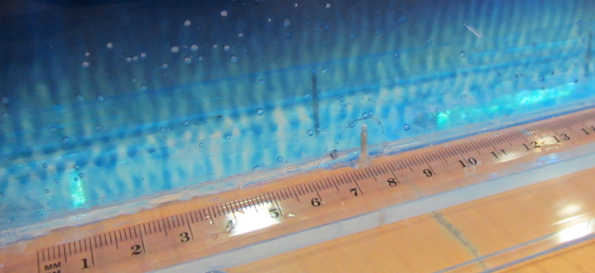
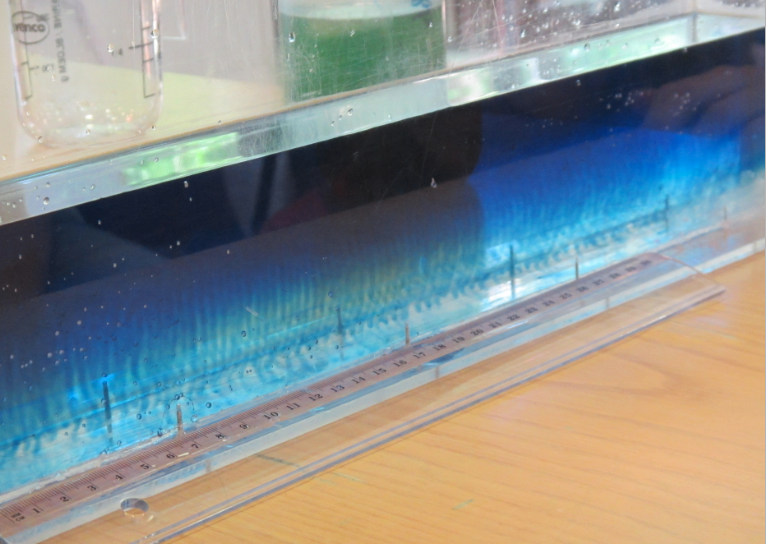
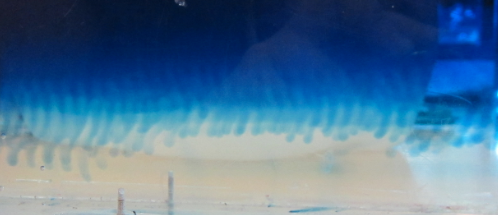
We pulled the parting out, and after a couple of minutes, salt fingers started to develop.

Unfortunately, they are really difficult to take pictures of.

But a lot of students watched and will hopefully remember what they saw.

And even if not – I thought it was awesome and Rolf said they were the best salt fingers he had seen yet – even though we just winged it ;-)