Tag Archives: literature

Even though students in the active classroom learn more, they feel like they learn less

If you’ve been trying to actively engage students in your classes, I am sure you’ve felt at least some level of resistance. Even though we know from literature (e.g. Freeman et al., 2014) that active learning increases student performance, it’s sometimes difficult to convince students that we are asking them to do all the activities for their own good.

But I recently came across an article that I think might be really good to help convince students of the benefits of active learning: Deslauriers et al. (2019) are “measuring actual learning versus feeling of learning in response to being actively engaged in the classroom” in different physics classes. They compare active learning (which they base on best practices in the given subject) and passive instruction (where lectures are given by experienced instructors that have a track record of great student evaluations). Apart from that, both groups were treated equally, and students were randomly assigned to one or the other group.

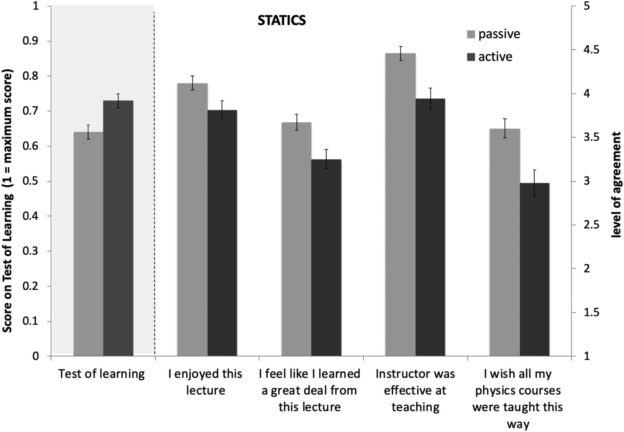
Figure from Deslauriers et al. (2019), showing a comparison of performance on the test of learning and feeling of learning responses between students taught with a traditional lecture (passive) and students taught actively for the statics class

As expected, the active case led to more learning. But interestingly, despite objectively learning more in the active case, students felt that they learned less than the students in the passive group (which is another example that confirms my conviction that student evaluations are really not a good measure of quality of instruction), and they said they would choose the passive learning case given the choice. One reason might be that students interpret the increased effort that is required in active learning as a sign that they aren’t doing as well. This might have negative effects on their motivation as well as engagement with the material.

So how can we convince students to engage in active learning despite their reluctance? Deslauriers et al. (2019) give a couple of recommendations:

  • Instructors should, early on in the semester, explicitly explain the value of active learning to students, and explicitly point out that increased cognitive effort means that more learning is taking place
  • Instructors should also have students take some kind of assessment early on, so students get feedback on their actual learning rather than relying only on their perception
  • Throughout the semester, instructors should use research-based strategies for their teaching
  • Instructors should regularly remind students to work hard and point out the value of that
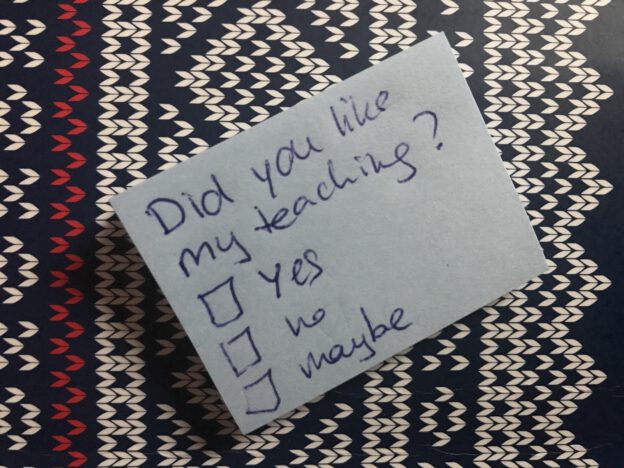
  • Lastly, instructors should ask for frequent student feedback throughout the course (my favourite method here) and respond to the points that come up

I think that showing students data like the one above might be really good to get them to consider that their perceived learning is actually not a good indicator for their actual learning, and convincing them that putting in the extra effort that comes with active learning is helping them learn even though it might not feel like it. I’ve always explicitly talked to students about why I am choosing certain methods, and why I might continue doing that even when they told me they didn’t like it. And I feel that that has always worked pretty well. Have you tried that? What are your experiences?

Measuring actual learning versus feeling of learning in response to being actively engaged in the classroom
Louis Deslauriers, Logan S. McCarty, Kelly Miller, Kristina Callaghan, Greg Kestin
Proceedings of the National Academy of Sciences
Sep 2019, 16 (39) 19251-19257; DOI: 10.1073/pnas.1821936116

#TeachingTuesday: Student feedback and how to interpret it in order to improve teaching

Student feedback has become a fixture in higher education. But even though it is important to hear student voices when evaluating teaching and thinking of ways to improve it, students aren’t perfect judges of what type of teaching leads to the most learning, so their feedback should not be taken onboard without critical reflection. In fact, there are many studies that investigate specific biases that show up in student evaluations of teaching. So in order to use student feedback to improve teaching (both on the individual level when we consider changing aspects of our classes based on student feedback, as well as at an institutional level when evaluating teachers for personnel decisions), we need to be aware of the biases that student evaluations of teaching come with.

While student satisfaction may contribute to teaching effectiveness, it is not itself teaching effectiveness. Students may be satisfied or dissatisfied with courses for reasons unrelated to learning outcomes – and not in the instructor’s control (e.g., the instructor’s gender).
Boring et al. (2016)

What student evaluations of teaching tell us

In the following, I am not presenting a coherent theory (and if you know of one please point me to it!), these are snippets of current literature on student evaluations of teaching, many of which I found referenced in this annotated literature review on student evaluations of teaching by Eva (2018). The aim of my blogpost is not to provide a comprehensive literature review, rather than pointing out that there is a huge body of literature that teachers and higher ed administrators should know exists somewhere out there, that they can draw upon when in doubt (and ideally even when not in doubt ;-)).

6 second videos are enough to predict teacher evaluations

This is quite scary, so I thought it made sense to start out with this study. Ambady and Rosenthal (1993) found that silent videos shorter than 30 seconds, in some case as short as 6 seconds, significantly predicted global end-of-semester student evaluations of teachers. These are videos that do not even include a sound track. Let this sink in…

Student responses to questions of “effectiveness” do not measure teaching effectiveness

And let’s get this out of the way right away: When students are asked to judge teaching effectiveness, that answer does not measure actual teaching effectiveness.

Stark and Freishtat (2014) give “an evaluation of course evaluations”. They conclude that student evaluations of teaching, though providing valuable information about students’ experiences, do not measure teaching effictiveness. Instead, ratings are even negatively associated with direct measures of teaching effectiveness and are influenced by gender, ethnicity and attractiveness of the instructor.

Uttl et al. (2017) conducted a meta-analysis of faculty’s teaching effectiveness and found that “student evaluation of teaching ratings and student learning are not related”. They state that “institutions focused on student learning and career success may want to abandon [student evaluation of teaching] ratings as a measure of faculty’s teaching effectiveness”.

Students have their own ideas of what constitutes good teaching

Nasser-Abu Alhija (2017) showed that out of five dimensions of teaching (goals to be achieved, long-term student development, teaching methods and characteristics, relationships with students, and assessment), students viewed the assessment dimension as most important and the long-term student development dimension as least important. To students, the grades that instructors assigned and the methods they used to do this were the main aspects in judging good teaching and good instructors. Which is fair enough — after all, good grades help students in the short term — but that’s also not what we usually think of when we think of “good teaching”.

Students learn less from teachers they rate highly

Kornell and Hausman (2016) review recent studies and report that when learning is measured at the end of the respective course, the “best” teachers got the highest ratings, i.e. the ones where the students felt that they had learned the most (which is congruent with Nasser-Abu Alhija (2017)’s findings of what students value in teaching). But when learning was measured during later courses, i.e. when meaningful deep learning was considered, other teachers seem to have more effective. Introducing desirable difficulties is thus good for learning, but bad for student ratings.

Appearances can be deceiving

Carpenter et al. (2013) compared a fluent video (instructor standing upright, maintaining eye contact, speaking fluidly without notes) and a disfluent video (instructor slumping, looking away, speaking haltingly with notes). They found that even though the amount of learning that took place when students watched either of the videos wasn’t influenced by the lecturer’s fluency or lack thereof, the disfluent lecturer was rated lower than the fluent lecturer.

The authors note that “Although fluency did not significantly affect test performance in the present study, it is possible that fluent presentations usually accompany high-quality content. Furthermore, disfluent presentations might indirectly impair learning by encouraging mind wandering, reduced class attendance, and a decrease in the perceived importance of the topic.”

Student expect more support from their female professors

When students rate teachers effectiveness, they do that based on their assumption of how effective a teacher should be, and it turns out that they have different expectations depending on the gender of their teachers. El-Alayi et al. (2018) found that “female professors experience more work demands and special favour requests, particularly from academically entitled students”. This was both true when male and female faculty reported on their experiences, as well as when students were asked what their expectations of fictional male and female teachers were. 

Student teaching evaluations punish female teachers

Boring (2017) found that even when learning outcomes were the same for students in courses taught by male and female teachers, female teachers received worse ratings than male teachers. This got even worse when teachers didn’t act in accordance to the stereotypes associated with their gender.

MacNell et al. (2015) found that believing that an instructor was female (in a study of online teaching where male and female names were sometimes assigned according to the actual gender of the teacher and sometimes not) was sufficient to rate that person lower than an instructor that was believed (correctly or not) to be male.

White male students challenge women of color’s authority, teaching competency, and scholarly expertise, as well as offering subtle and not so subtle threats to their persons and their careers

This title was drawn from the abstract of Pittman (2010)’s article that I unfortunately didn’t have access to, but thought an important enough point to include anyway.

There are very many more studies on race, and especially women of color, in teaching contexts, which all show that they are facing a really unfair uphill battle.

Students will punish a percieved accent

Rubin and Smith (1990) investigated “effects of accent, ethnicity, and lecture topic on undergraduates’ perceptions of nonnative English-speaking teaching assistants” in North America and found that 40% of undergraduates avoid classes instructed by nonnative English-speaking teaching assistants, even though the actual accentedness of teaching assistants did not actually influence student learning outcomes. Nevertheless, students judged teaching assistants they perceived as speaking with a strong accent as poorer teachers.

Similarly, Sanchez and Khan (2016) found that “presence of an instructor accent […] does not impact learning, but does cause learners to rate the instructor as less effective”.

Student will rate minorities differently

Ewing et al. (2003) report that lecturers that were identified as gay or lesbian received lower teaching ratings than other lecturers with undisclosed sexual orientation when they, according to other measures, were perfoming very well. Poor teaching performance was, however, rated more positively, possibly to avoid discriminating against openly gay or lesbian lecturers.

Students will punish age

Stonebraker and Stone (2015) find that “age does affect teaching effectiveness, at least as perceived by students. Age has a negative impact on student ratings of faculty members that is robust across genders, groups of academic disciplines and types of institutions”. Apparently, when it comes to students, from your mid-40ies on, you aren’t an effective teacher any more (unless you are still “hot” and “easy”).

Student evaluations are sensitive to student’s gender and grade expectation

Boring et al. (2016) find that “[student evaluation of teaching] are more sensitive to students’ gender bias and grade expectations than they are to teaching effectiveness.

What can we learn from student evaluations then?

Pay attention to student comments but understand their limitations. Students typically are not well situated to evaluate pedagogy.
Stark and Freishtat (2014)

Does all of the above mean that student evaluations are biased in so many ways that we can’t actually learn anything from them? I do think that there are things that should not be done on the basis of student evaluations (e.g. rank teacher performance), and I do think that most times, student evaluations of teaching should be taken with a pinch of salt. But there are still ways in which the information gathered is useful.

Even though student satisfaction is not the same as teaching effectiveness, it might still be desirable to know how satisfied students are with specific aspects of a course. And especially open formats like for example the “continue, start, stop” method are great for gaining a new perspective on the classes we teach and potentially gaining fresh ideas of how to change things up.

Also tracking ones own evaluation over time is helpful since — apart from aging — other changes are hopefully intentional and can thus tell us something about our own development, at least assuming that different student cohorts evaluate teaching performance in a similar way. Also getting student feedback at a later date might be helpful, sometimes students only realize later which teachers they learnt from the most or what methods were actually helpful rather than just annoying.

A measure that doesn’t come directly from student evaluations of teaching but that I find very important to track is student success in later courses. Especially when that isn’t measured in a single grade, but when instructors come together and discuss how students are doing in tasks that build on previous courses. Having a well-designed curriculum and a very good idea of what ideas translate from one class to the next is obviously very important.

It is also important to keep in mind that, as Stark and Freishtat (2014) point out, statistical methods are only valid if there are enough responses to actually do statistics on them. So don’t take very few horrible comments to heart and ignore the whole bunch of people who are gushing about how awesome your teaching is!

P.S.: If you are an administrator or on an evaluation committee and would like to use student evaluations of teaching, the article by Linse (2017) might be helpful. They give specific advice on how to use student evaluations both in decision making as well as when talking to the teachers whose evaluations ended up on your desk.

Literature:

Ambady, N., & Rosenthal, R. (1993). Half a minute: Predicting teacher evaluations from thin slices of nonverbal behavior and physical attractiveness. Journal of Personality and Social Psychology, 64(3), 431–441. https://doi.org/10.1037/0022-3514.64.3.431

Boring, A. (2017). Gender biases in student evaluations of teachers. Journal of Public Economics, 145(13), 27–41. https://doi.org/10.1016/j.jpubeco.2016.11.006

Boring, A., Dial, U. M. R., Ottoboni, K., & Stark, P. B. (2016). Student evaluations of teaching (mostly) do not measure teaching effectiveness. ScienceOpen Research, (January), 1–36. https://doi.org/10.14293/S2199-1006.1.SOR-EDU.AETBZC.v1

Carpenter, S. K., Wilford, M. M., Kornell, N., & Mullaney, K. M. (2013). Appearances can be deceiving: Instructor fluency increases perceptions of learning without increasing actual learning. Psychonomic Bulletin & Review, 20(6), 1350–1356. https://doi.org/10.3758/s13423-013-0442-z

El-Alayi, A., Hansen-Brown, A. A., & Ceynar, M. (2018). Dancing backward in high heels: Female professors experience more work demands and special favour requests, particularly from academically entitled students. Sex Roles. https://doi.org/10.1007/s11199-017-0872-6

Eva, N. (2018), Annotated literature review: student evaluations of teaching (SET), https://hdl.handle.net/10133/5089

Ewing, V. L., Stukas, A. A. J., & Sheehan, E. P. (2003). Student prejudice against gay male and lesbian lecturers. Journal of Social Psychology, 143(5), 569–579. http://web.csulb.edu/~djorgens/ewing.pdf

Kornell, N. & Hausman, H. (2016). Do the Best Teachers Get the Best Ratings? Front. Psychol. 7:570. https://doi.org/10.3389/fpsyg.2016.00570

Linse, A. R. (2017). Interpreting and using student ratings data: Guidance for faculty serving as administrators and on evaluation committees. Studies in Educational Evaluation, 54, 94- 106. https://doi.org/10.1016/j.stueduc.2016.12.004

MacNell, L., Driscoll, A., & Hunt, A. N. (2015). What’s in a name: Exposing gender bias in student ratings of teaching. Innovative Higher Education, 40(4), 291– 303. https://doi.org/10.1007/s10755-014-9313-4

Nasser-Abu Alhija, F. (2017). Teaching in higher education: Good teaching through students’ lens. Studies in Educational Evaluation, 54, 4-12. https://doi.org/10.1016/j.stueduc.2016.10.006

Pittman, C. T. (2010). Race and Gender Oppression in the Classroom: The Experiences of Women Faculty of Color with White Male Students. Teaching Sociology, 38(3), 183–196. https://doi.org/10.1177/0092055X10370120

Rubin, D. L., & Smith, K. A. (1990). Effects of accent, ethnicity, and lecture topic on undergraduates’ perceptions of nonnative English-speaking teaching assistants. International Journal of Intercultural Relations, 14, 337–353. https://doi.org/10.1016/0147-1767(90)90019-S

Sanchez, C. A., & Khan, S. (2016). Instructor accents in online education and their effect on learning and attitudes. Journal of Computer Assisted Learning, 32, 494–502. https://doi.org/10.1111/jcal.12149

Stark, P. B., & Freishtat, R. (2014). An Evaluation of Course Evaluations. ScienceOpen, 1–26. https://doi.org/10.14293/S2199-1006.1.SOR-EDU.AOFRQA.v1

Stonebraker, R. J., & Stone, G. S. (2015). Too old to teach? The effect of age on college and university professors. Research in Higher Education, 56(8), 793–812. https://doi.org/10.1007/s11162-015-9374-y

Uttl, B., White, C. A., & Gonzalez, D. W. (2017). Meta-analysis of faculty’s teaching effectiveness: Student evaluation of teaching ratings and student learning are not related. Studies in Educational Evaluation, 54, 22-42. http://dx.doi.org/10.1016/j.stueduc.2016.08.007

“Continue. Start. Stop.”. An article supporting the usefulness of my favourite method of asking for student feedback on a course!

I’ve been recommending the “Continue. Start. Stop.” feedback method for years an years (at least since my 2013 blog post), but not as a research-backed method but mostly based on my positive personal experience with it. I have used this method to get feedback on courses I’ve been teaching a couple of weeks into the course in order to improve my teaching both within the course as well as over the years. If there was anything that students thought would improve their learning, I wanted to be able adapt my teaching (and also, in a follow-up discussion of the feedback, be able to address student expectations that might not have been explicit before that I might or might not want to follow). I like that even though it’s a qualitative method and thus fairly open, it gives students a structure along which they can write their feedback. Also by asking what should be continued as well as stopped and started, it’s a nice way to get feedback on what’s already working well, too! But when I was asked for a reference for the method today, I didn’t really have a good answer. But then I found one: an article by Hoon et al. (2015)!

Studies on the “continue. start. stop.” feedback vs open feedback

In the first study in the article, two different feedback methods are compared over three different courses: a free form feedback and a structured format, similar to “continue. start. stop.”. From this study, the authors draw pointers for changing the feedback method in the free form course to a more structured feedback. They investigate the influence of this change in a second study.

In that second study, the authors find that using a structured feedback led to an increasing depth of feedback, and that the students liked the new form of giving feedback. They also find indications that the more specific the questions are, the more constructive (as compared to more descriptive texts in the open form; not necessarily more positive or negative!) the feedback is.

My recommendations for how to use the “continue. start. stop.” feedback

If anything, this article makes me like this feedback method even more than I did before. It’s easy and straight forward and actually super helpful!

Use this as formative feedback!

Ask for this feedback early on in the course (maybe after a couple of weeks, when students know what to expect in your course, but with plenty of the course left to actually react to the feedback) and use the student replies to help you improve your teaching. While this method can of course also be used as summative feedback at the end of the course, how much cooler is it if students can benefit from the feedback they gave you?

Ask full questions

One thing that I might not have been clear about before when talking about the “continue. start. stop.” feedback method is that it is important to actually use the whole phrases (“In order to improve your learning in this course, please give me feedback on the following points

  1. Continue: What is working well in this course that you would like to continue?
  2. Start: What suggestions do you have for things that could improve the course?
  3. Stop: What would you like us to stop doing?”

or similar) rather than just saying “continue. start. stop.” and assuming the students know what that means.

Leave room for additional comments

It is also helpful to give an additional field for other comments the students might have, you never know what else they’d like to tell you if only they knew how and when to do it.

Use the feedback for several purposes at once!

In the article’s second study, a fourth question is added to the “continue. start. stop.” method, and that is asking for examples of good practice and highlights. The authors say this question was mainly included for the benefit of “external speakers who may value course feedback as evidence of their own professional development and engagement with education”, and I think that’s actually a fairly important point. While the “continue. start. stop.” feedback itself is a nice addition to any teaching portfolio, why not think specifically about the kind of things you would like to include there, and explicitly ask for them?

Give feedback on the feedback

It’s super important that you address the feedback you got with your class! Both so that they feel heard and know whether their own perception and feedback agrees with that of their peers, as well as to have the opportunity to discuss what parts of their suggestions you are taking on, what will be changing as a result of their suggestions, and what you might not want to change (and why!). If this does not happen, students might not give you good feedback the next time you ask for it because they feel that since it didn’t have an effect last time, why would they bother doing it again?

Now it’s your turn!

Have you used the “continue. start. stop.” method? How did it work for you? Will you continue using it or how did you modify it to make it suit you better? Let me know in the comments below! :-)

Reference:

Hoon, A. and Oliver, E.J. and Szpakowska, K. and Newton, P. (2015) ‘Use of the ‘Stop, Start, Continue’ method is associated with the production of constructive qualitative feedback by students in higher education.’, Assessment and evaluation in higher education., 40 (5). pp. 755-767. [link]

“A brief history of climate in the Nordic Seas” — A #scipoem

A brief history of climate in the Nordic Seas*

Understanding of climate change
explaining a record’s full range
playing the cause-and-effect game
needs a closed, mechanistic frame

data: proxies or direct obs
predicted future poses probs
relationship is not the same:
needs a closed, mechanistic frame

mechanism seems to differ
Gulf Stream currently seems stiffer
than in future or past, we claim,
needs a closed, mechanistic frame

Understanding of climate change
needs a closed, mechanistic frame

*based on an article by Eldevik et al. (2014). Form is a “kyrielle sonett”

#scipoem on an Darelius et al. article about ice shelves

“Observed vulnerability of Filchner-Ronne Ice Shelf to wind-driven inflow of warm deep water”*

Let’s talk ab’t a favourite paper
“Observed vulnerability of Filchner-
Ronne Ice Shelf to
wind-driven inflow
of wa(-a-a-a-a)rm deep water”

An ice shelf is ice that is floating
on top of the sea as it’s flowing
down from a continent
this one is prominent
more ar’onl’ the Ross Shelf is coating.

In oc’nographers’ jargon, “deep water”
(as we learned by heart at my alma mater)
are defined by their propertie’
and live in the deep, deep sea
and currently they are getting hotter.

But “warm” is a relative measure
bathing in it would be no pleasure
it’s temperature typically
less than just one degree!
Go measure yourself at your leisure!

As winds weaken now during summer
warm water, like led by a plumber,
climbs up the continent
and can now circumvent
sills and reach ice from under.

If temperatures rise as projected
a lot of the ice will be ‘ffected.
Raising the lev’l o’ sea,
changing hydrography,
which needs to be further dissected.

Because of its climatic impact
which Elin has now shown to be fact
we need close observation
of deep water formation
so all changes can carefully be tracked.

*that’s the title of an article by (Elin) Darelius et al. (2016) which served as inspiration for this poem.

How our experiments relate to the real Antarctica

After seeing so many nice pictures of our topography and the glowing bright green current field around it in the tank, let’s go back to the basics today and talk about how this relates to reality outside of our rotating tank.

Figure 1 or Darelius, Fer & Nicholls (2016): Map. Location map shows the moorings (coloured dots), Halley station (black, 75°350 S, 26°340 W), bathymetry and the circulation in the area: the blue arrow indicates the flow of cold ISW towards the Filchner sill and the red arrows the path of the coastal/slope front current. The indicated place names are: Filchner Depression (FD), Filchner Ice Shelf (FIS), Luipold coast (LC) and Ronne Ice Shelf (RIS).

Figure 1 or Darelius, Fer & Nicholls (2016): Map. Location map shows the moorings (coloured dots), Halley station (black, 75°350 S, 26°340 W), bathymetry and the circulation in the area: the blue arrow indicates the flow of cold ISW towards the Filchner sill and the red arrows the path of the coastal/slope front current. The indicated place names are: Filchner Depression (FD), Filchner Ice Shelf (FIS), Luipold coast (LC) and Ronne Ice Shelf (RIS).

Above you see the red arrows indicating the coastal/slope front currents. Where the current begins in the top right, we have placed our “source” in our experiments. And the three arms the current splits into are the three arms we also see in our experiments: One turning after reaching the first corner and crossing the shelf, one turning at the second corner and entering the canyon, and a third continuing straight ahead. And we are trying to investigate which pathway is taken depending on a couple of different parameters.

The reason why we are interested in this specific setup is that the warm water, if it turns around the corner and flows into the canyon, is reaching the Filchner Ice Shelf. The more warm water reaches the ice shelf, the faster it will melt, contributing to sea level rise, which will in turn increase melt rates.

In her recent article (Darelius, Fer & Nicholls, 2016), Elin discusses observations from that area that show that pulses of warm water have indeed reached far as far south as the ice front into the Filchner Depression (our canyon). In the observations, the strength of that current is directly linked to the strength of the wind-driven coastal current (the strength of our source). So future changes in wind forcing (for example because a decreased sea ice cover means that there are larger areas where momentum can be transferred into the surface ocean) can have a large effect on melt rates of the Filchner Ice Shelf, which might introduce a lot of fresh water in an area where Antarctic Bottom Waters are formed, influencing the properties of the water masses formed in the area and hence potentially large-scale ocean circulation and climate.

The challenge is that there are only very few actual observations of the area. Especially during winter, it’s hard to go there with research ships. Satellite observations of the sea surface require the sea surface to be visible — so ice and cloud free, which is also not happening a lot in the area. Moorings give great time series, but only of a single point in the ocean. So there is still a lot of uncertainty connected to what is actually going on in the ocean. And since there are so few observations, even though numerical models can produce a very detailed image of the area, it is very difficult how well their estimates actually are. So this is where our tank experiments come in: Even though they are idealised (the shape of the topography looks nothing like “real” Antarctica etc.), we can measure precisely how currents behave under those circumstances, and that we can use to discuss observations and model results against.

Darelius, E., Fer, I., & Nicholls, K. W. (2016). Observed vulnerability of Filchner-Ronne Ice Shelf to wind-driven inflow of warm deep water. Nature communications, 7, 12300.

I am missing institute seminars! Or: Why we should talk to people who use different methods

You probably know that I have recently changed my research focus quite dramatically, from physical oceanography to science communication research. What that means is that I am a total newbie (well, not total any more, but still on a very steep learning curve), and that I really appreciate listening to talks from a broad range of topics in my new field to get a feel for the lay of the land, so to speak. We do have institute seminars at my current work place, but they only take place like once a month, and I just realized how much I miss getting input on many different things on at least a weekly basis without having to explicitly seek them out. To be fair, it’s also summer vacation time and nobody seems to be around right now…

But anyway, I want to talk about why it is important that people not only of different disciplines talk, but also people from within the same discipline that use different approaches. I’ll use my first article (Simulated impact of double-diffusive mixing on physical and biogeochemical upper ocean properties by Glessmer, Oschlies, and Yool (2008)) to illustrate my point.

I don’t really know how it happened, but by my fourth year at university, I was absolutely determined to work on how this teeny tiny process, double-diffusive mixing (that I had seen in tank experiments in a class), would influence the results of an ocean model (as I was working as student research assistant in the modelling group). And luckily I found a supervisor who would not only let me do it, but excitedly supported me in doing it.

Double-diffusive mixing, for those of you who don’t recall, looks something like this when done in a tank experiment:

IMG_9084

And yep, that’s me in the reflection right there :-)

Why should anyone care about something so tiny?

Obviously, there is a lot of value in doing research to satisfy curiosity. But for a lot of climate sciences, one important motivation for the research is that ultimately, we want to be able to predict climate, and that means that we need good climate models. Climate models are used as basis for policy decisions and therefore should represent the past as well as the present and future (under given forcing scenarios) as accurately as possible.

Why do we need to know about double-diffusive mixing if we want to model climate?

Many processes are not actually resolved in the model, but rather “parameterized”, i.e. represented by functions that estimate the influence of the process. And one process that is parameterized is double-diffusive mixing, because its scale (even though in the ocean the scale is typically larger than in the picture above) is too small to be represented.

Mixing, both in ocean models and in the real world, influences many things:

  • By mixing temperature and salinity (not with each other, obviously, but warmer waters with colder, and at the same time more salty waters with less salty), we change density of the water, which is a function of both temperature and salinity. By changing density, we are possibly changing ocean currents.
  • At the same, other tracers are influenced: Waters with more nutrients mix with waters with less, for example. Also changed currents might now supply nutrient-rich waters to other regions than they did before. This has an impact on biogeochemistry — stuff (yes, I am a physical oceanographer) grows in other regions than before, or gets remineralized in different places and at different rates, etc.
  • A change in biogeochemistry combined with a changed circulation can lead to changed air-sea fluxes of, for example, oxygen, CO2, nitrous oxide, or other trace gases, and then you have your influence on the atmosphere right there.

What are the benefits of including tiny processes in climate models?

Obviously, studying the influence of individual processes leads to a better understanding of ocean physics, which is a great goal in itself. But that can also ultimately lead to better models, better predictions, better foundation for policies. But my main point here isn’t even what exactly we need to include or not, it is that we need a better flow of information, and a better culture of exchange.

Talk to each other!

And this is where this tale connects to me missing institute seminars: I feel like there are too few opportunities for exchange of ideas across research groups, for learning about stuff that doesn’t seem to have a direct relevance to my own research (so I wouldn’t know that I should be reading up on it) but that I should still be aware of in case it suddenly becomes relevant.

What we need is that, staying in the example of my double-diffusive mixing article, is that modellers keep exploring the impact of seemingly irrelevant changes to parameterizations or even the way things are coded. And if you aren’t doing it yourself, still keep it in the back of your head that really small changes might have a big influence, and listen to people working on all kinds of stuff that doesn’t seem to have a direct impact on your own research. In case of including the parameterization of double-diffusive mixing, oceanic CO2 uptake is enhanced by approximately 7% of the anthropogenic CO2 signal compared to a control run! And then there might be a climate sensitivity of processes, i.e. double-diffusive mixing happening in many ore places under a climate that has lead to a different oceanic stratification. If we aren’t even aware of this process, how can we possibly hope that our model will produce at least semi-sensible results? And what we also need are that the sea going and/or experimental oceanographers keep pushing their research to the attention of modellers. Or, if we want less pushing: more opportunities for and interest in exchanging with people from slightly different niches than our own!

One opportunity just like that is coming up soon, when I and others will be writing from Grenoble about Elin Darelius and her team’s research on Antarctic stuff in a 12-m-diameter rotating tank. Imagine that. A water tank of that size, rotating! To simulate the influence of Earth’s rotation on ocean current. And we’ll be putting topography in that! Stay tuned, it will get really exciting for all of us, and all of you! :-)

P.S.: My #COMPASSMessageBox for this blogpost below. I really like working with this tool! Read more about the #COMPASSMessageBox.

message_box_dd

And here is the full citation: Glessmer, M. S., Oschlies, A., & Yool, A. (2008). Simulated impact of double‐diffusive mixing on physical and biogeochemical upper ocean properties. Journal of Geophysical Research: Oceans, 113(C8).

What you know about science is not necessarily what you believe about science

I’ve been working in science communication research for a good half a year now, and my views on outreach are constantly evolving. When I applied for this job, I was convinced that if only the public knew what we (the scientists) know, they would take better decisions. So all we need to do is inform the public, preferably using entertaining and engaging methods. However, I soon came to learn that this is known as the “deficit model” and that there is a lot of research saying that life isn’t that easy. Like, at all.

One article I really like makes it very clear that knowledge about what science says is not at all the same as believing in what science says. The article Climate-Science Communication and the Measurement Problem by Kahan (2015) (btw, a really entertaining read!) describes how changing a question on a questionnaire from “Human beings, as we know them today, developed from earlier species of animals” to “According to the theory of evolution, human beings, as we know them today, developed from earlier species of animals” has a big impact: While in the first case, religiosity of the respondents had a huge impact and even highly educated religious people are very likely to answer “no”, in the second case religious and non-religious people answer similarly correctly. So clearly the knowledge of what evolution theory says is there in both cases, but only in the latter case that knowledge becomes relevant in answering the question. In the first case, the respondents cultural identity dictates a different answer than in the second case, where the question is only about science comprehension, not about beliefs and identity. As the author says: a question about ““belief in” evolution measures “who one is” rather than “what one knows””.

The author then moves on to study knowledge and beliefs about climate change and finds the same thing: the relationship between science comprehension and belief in climate change depends on the respondents’ identities. The more concerned someone is about climate change due to their cultural background, the more concerned they become as their level of science comprehension increases. The more sceptical someone is, the more sceptical he becomes with increasing science comprehension: “Far from increasing the likelihood that individuals will agree that human activity is causing climate change, higher science comprehension just makes the response that a person gives to a “global- warming belief” item an even more reliable indicator of who he or she is.”

So knowledge (or lack thereof) clearly isn’t the problem we face in climate change communication — the problem is the entanglement of knowledge and identity. What can we do to disentangle the two? According to the article, it is most important to not reinforce the association of opposing positions with membership in competing groups. The higher-profile the communicators on the front lines, the more they force individuals to construe evidence that supports the claims of those high-profile members of their group in order to feel as part of that group and protect their identity. Which is pretty much the opposite of how climate science has been communicated in the last years. Stay tuned while we work on developing good alternatives, but don’t hold your breath just yet ;-)


Kahan, D. M. (2015). Climate-Science Communication and the Measurement Problem Political Psychology, 36, 1-43

On the impact of blogging — or how far does my message mix?

What is the impact of this blog? And who am I writing it for?

Those are not questions I regularly ask myself. The main reason I started blogging was to organise all the interesting stuff I was collecting for my introduction to oceanography lecture at the University of Bergen in one place, so I would be able to find it when I needed it again. And I wanted to share it with friends who were interested in teaching oceanography or teaching themselves.

Another of the reasons why I blog is that I notice a lot of exciting features in everyday life that relate to oceanography and/or physics, that other people would just walk past and not notice, and that I would like to share the wonder of all those things with others. And noticing all this stuff is so much FUN! The blog “gives me permission” to play, to regularly do weekend trips to weirs or ship lifts or other weird landmarks that I would probably not seek out as often otherwise.

But the other day I was browsing the literature on science blogging in order to come up with recommendations for the design of what is to become the Kiel Science Outreach Campus’ (KiSOC) blog. I came across a paper that resonated with me on so many levels: “Science blogs as boundary layers: Creating and understanding new writer and reader interactions through science blogging” by M-C Shanahan (2011). First, I really liked to see the term “boundary layer” in the title, since it brings to mind exciting fluid mechanics. Then second, I read that the boundary phenomena I was thinking of were really where the term “boundary layer” came from even in this context. And then I realised that I have had “boundary layer” experiences with this blog, too!

So what are those boundary layers about? Well, in fluid mechanics, they are the regions within fluids that interact with “something else” — the boundary of a flow, e.g. a pipe, or a second fluid of different properties.  They are a measure for the region over which temperature or salinity or momentum or any other property is influenced by the boundary. But the same construct can be used for social groups, i.e. in my case oceanographers and non-oceanographers. (You should, btw, totally check out the original article! Her example is even more awesome than mine)

But here is my own boundary layer experience: My sister sent me an email with the subject “double-diffusive mixing” and a picture she had taken! My sister is not an oceanographer, and I wasn’t even aware that she associated the term “double-diffusive mixing” with anything in particular other than me writing my Diplom thesis about it and probably talking about a lot. But that she would recognise it? Blew my mind!

Turns out what she saw is actually convection, but it doesn’t look that dissimilar from salt fingers, and how awesome is it that she notices this stuff and thinks of oceanography?

DSC03217

Day 1. The remaining pink soap starts making its way up through the refill of clear soap.

Obviously I asked for follow-up pictures:

DSC03232

Day 2. A lot of the pink soap has reached the top, passing through the clear refill.

DSC03267

Day 3. All of the “old” pink soap is now on its way up through the clear refill.

And I had another boundary layer experience recently: A sailor on the Norwegian research vessel Håkon Mosby with many many years experience at sea had seen my book and told me that he now looks at waves in a new way. How awesome is that? That’s the biggest compliment my book could get, to teach something new about visual observations of the ocean to someone who looks at the ocean every single day!

Anyway. Reading this article made me think about how happy both those boundary layer experiences made me, and that maybe I should actually start aiming at creating more of those. Maybe not with this blog, that I kinda want to keep as my personal brain dump, but there are so many different ways to interact more with people who would potentially be super interested in oceanography if only they knew about it… I guess there is a reason why I am working the job I am :-)


Shanahan, M. (2011). Science blogs as boundary layers: Creating and understanding new writer and reader interactions through science blogging Journalism, 12 (7), 903-919 DOI: 10.1177/1464884911412844

Nonlinear effects in shallow water waves

I recently googled for something related to the shape of waves and came across a photo of a wave that caught my eye, and it took me to a journey that lead to the article “nonlinear shallow ocean wave soliton interactions on flat beaches” by Ablowitz and Baldwin (2012).

What’s discussed in that article is that while many wave interactions can be seen as (more or less) linear, sometimes there are nonlinear effects that can be replicated in a model. So far so not surprising. But I got fascinated because the phenomenon they look at I have seen over and over again and never really paid any attention to it: Wave crests forming X or Y shapes. But looking through my archives, I even had dozens of pictures of this exact phenomenon! (Actually, I didn’t have to look further back than to a beautiful day last November, when I also observed the wavelength dependency of wave-object interactions)

Take for example the picture below: Do you see the H shape in the waves closest to shore? (In the article they would probably call it a more-complex shape, since it’s a double Y shape…)

img_8629

Below I’ve drawn into the picture what I mean by H-shape in green, and the typical kind of linear wave interaction in red (all crests just move on without influencing each other except in the spot where they occur at the same time, there they just add to each other):

img_8629-copy

Or below, I spot an X-shape:

img_8633

And here are several X- and Y-shapes

img_8635

And the picture below just to give you an orientation of where you are: Yep, it’s the same spot where we usually observe foam stripes, funny waves, or ice

img_8625


Mark J. Ablowitz, & Douglas E. Baldwin (2012). Nonlinear shallow ocean wave soliton interactions on flat beaches Physical Review E, vol. 86(3), pp. 036305 (2012) arXiv: 1208.2904v1