Tag Archives: kitchen oceanography

Tea and milk

More physics applications  connected to tea.

After the frustrations of taking pictures of steam in my last post, I decided that I could use the very same cute mug to show other stuff, too. I know it has been done over and over again, but we have new students every year, don’t we, so someone has to keep telling the old stories, right?

So. When should you pour the milk into your tea? Right away or a little later?
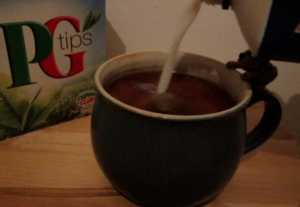
MVI_6063_2

Milk and tea

The answer, as you know, is “it depends”.

Do you want your tea as hot as possible? Then put the milk in right away and it won’t cool the tea down as much. Want the milk to cool down the tea as much as possible? Then wait for as long as you can before pouring it in.

The explanation behind this is of course that the cooling due to evaporation is happening faster the larger the temperature difference between the tea and the surrounding air. If you let it sit without milk, due to the larger temperature difference it cools down faster than if you poured in the cold milk, thus cooling it closer to room temperature, and then waited.

And there are even occasions when you would you put milk into the cup before adding the tea: If you have delicate china and don’t want to risk ruining it by pouring in almost boiling tea. Plus allegedly that way the milk doesn’t scald and form those weird flakes?
Blowing on hot tea

Why would it be interesting to talk about this in a science class?

As a kid I used to wonder why blowing on a hot soup or beverage should be a good idea. Wouldn’t my breath be warmer than room temperature, and hence shouldn’t the soup get warmer instead of colder?

Then I didn’t think about this question for 25 or so years (scary, I know), and then today, when I was blowing on my tea, I realized that by now I knew why I was doing it, even though I had never related my science knowledge to the everyday act of blowing on hot tea.

So why do we blow on hot tea?

The main reason is that at the tea’s surface, evaporation takes place. We can oftentimes see the steam coming off. The molecules that left the cup condense in a fog over the cup. If they stay in place, evaporation will slow. If we blow them away, the air is replaced with colder surrounding air, and evaporation continues.

Another reason is that as we blow on the surface, we create ripples. Hence the surface area is larger than before and more exchange can happen over a larger area. But I would guess that that effect is much smaller than the first one.

The main reason I wanted to write this blog post was because I could see the picture I wanted to show before my eyes: This sweet cup with the rabbit on the handle and the steam rising from it. Turns out it is really difficult to take pictures of that! At least with my camera and my lack of patience. And believe me – I tried for a full 15 minutes with different light sources at different angles and everything! So for now all you get to see is the video below where it is slightly better visible than in a still picture – and please try to imagine the steam! And I will be back once I’ve figured out how to document it properly!

Advection fog

When warm, moist air is advected and brought in contact with colder surfaces.

Recently I’ve been starting to think about a course I’ll be teaching later this year, and how it would be cool to have household examples for most, if not all, of the topics I’ll be talking about.

IMG_6054

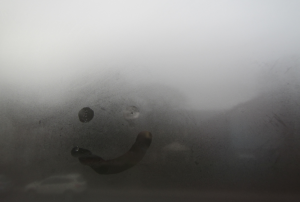
Fogged up bathroom window

So this is one example for advection fog: Warm, moist air moves against a cold window and condenses.

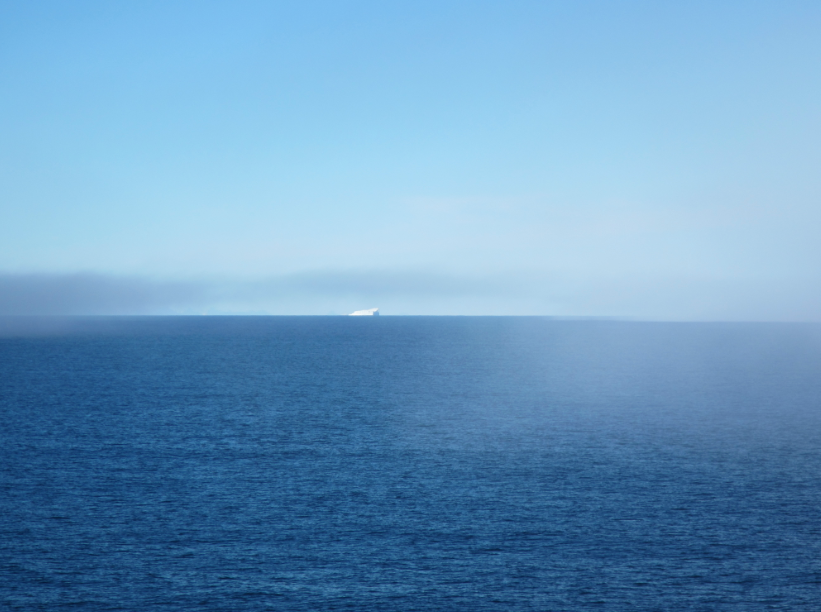
Of course you can also observe this over other cold surfaces, for example over the ocean:

In the movie below you can witness how the iceberg slowly vanishes as the fog closes in on the ship.

It can actually get pretty spooky.

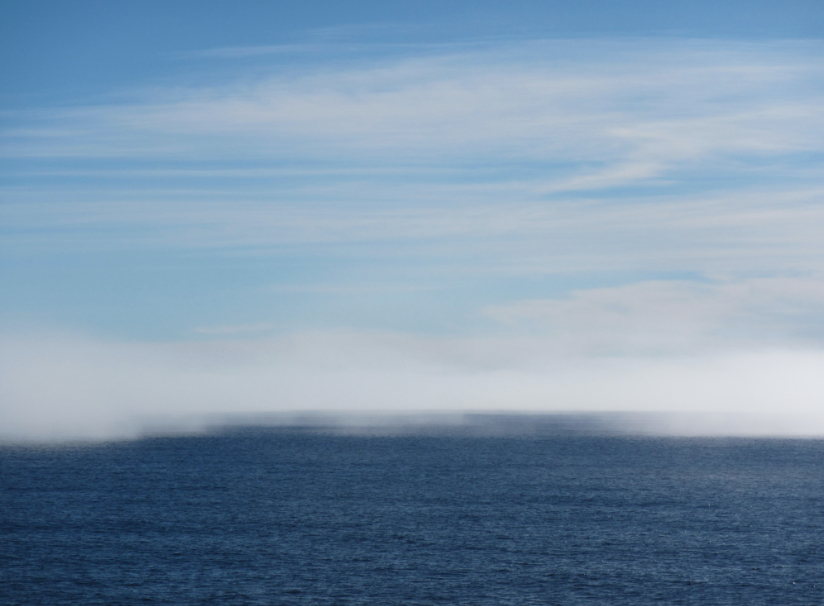
On this picture you can clearly see that the fog is confined to a shallow layer directly above the ocean’s surface. We were standing on the deck above the bridge, and there we were up high enough to see that it is indeed a thin layer and that the skies above are blue. From the working deck it felt like fog had swallowed us up and the Black Pearl was about to appear…

Hydraulic jump II

More movies of my kitchen sink.

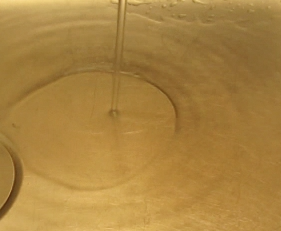
I am really fascinated by the hydraulic jumps in my kitchen sink. I can’t believe I haven’t used this before when I was teaching! Yes, movies of rivers and rapids are always really impressive, too, but how cool is it to be able to observe hydraulic jumps in your own sink? Let me remind you:

Hydraulic jump in my kitchen sink. Video here

So this is what happens when the water jet hits the (more or less) level bottom of the sink. But what would happen if it instead hit a slope?

Now, if I wasn’t working a full-time job, or if that job wasn’t completely unrelated to anything to do with hydraulic jumps, I would now proudly present movies of all kinds of hydraulic jumps on sloped surfaces. As it is, I can tell you that I have tons of ideas of where to go to make really nice movies, but for now this is all I can offer:

Yes, that is a chopping board in a sink. It shows really nicely how the hydraulic jump occurs closer to the point of impact of the jet as you go uphill (because the water slows down faster going in that direction than going downhill) and again how the radius depends on the flow speed of the jet. Stay tuned for a more elaborate post on this!

An overturning experiment

A simple experiment that shows how the large-scale thermally-driven ocean circulation works.

Someone recently asked me whether I had ideas for experiments for her course in ocean sciences for non-majors. Since most of the experiments I’ve been showing on this blog were run in the context of Bachelor or Master oceanography-major courses, she didn’t think that the experiments were as easily transferable to other settings as I had claimed.

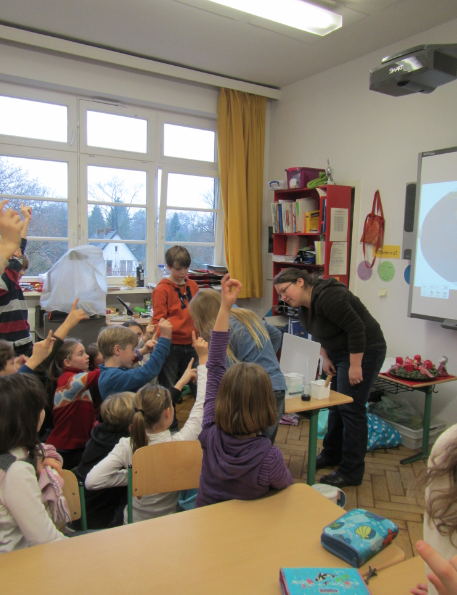
So here is proof: You can do pretty complex experiments with non-university level students. To prove my point, let’s go to a primary school.

IMG_3219

Experimenting with a primary school class.

The experiment we are running here is the global (thermal) conveyor belt. In a long and narrow tank filled with water, a heating and a cooling element are inserted at either end. Dye is added onto the elements to visualize the flow of water.

IMG_3212

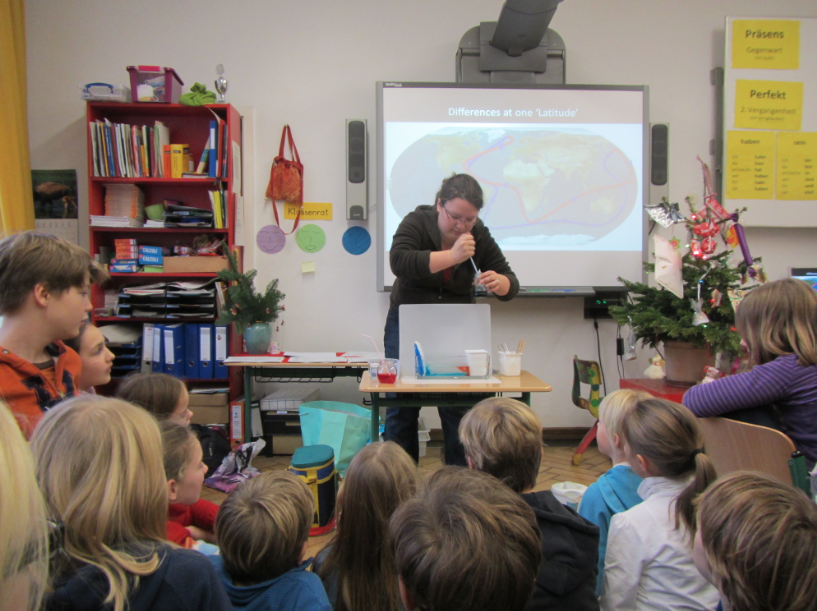
Adding dye to visualize the thermally driven flow in the tank.

In the image above you see that there is something blue near the bottom of the tank, and I am adding red dye to the other side. Blue is used to track the cold water and red to track the warm water (intuitive color-coding goes a long way, no matter how old your students are!)

IMG_3214

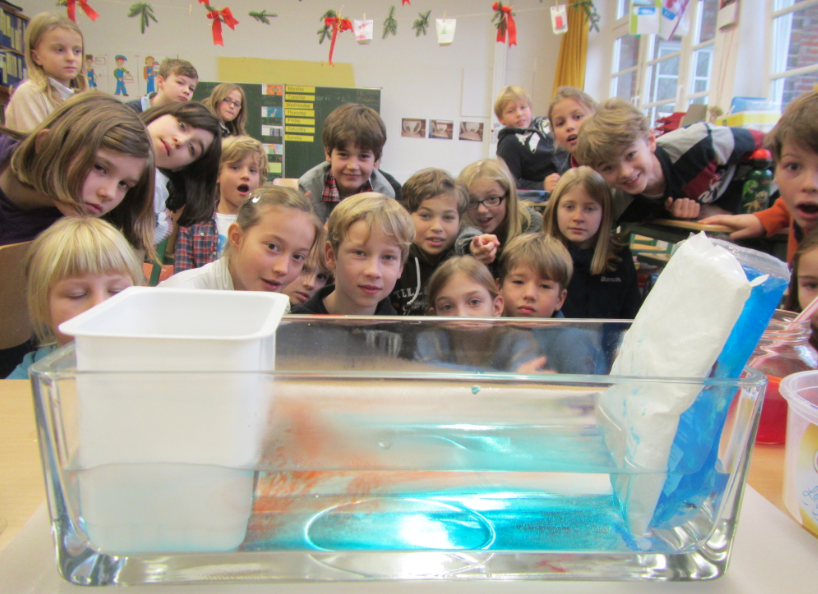
The experiment as seen by the teacher.

What you see here is the cold blue water sinking to the bottom of the tank and spreading, and the warm red water rising to the water’s surface and spreading there. As the warm water reaches the cooling pads, it gets cooled, becomes denser and sinks. Similarly, the cold water reaching the warming pads becomes less dense and rises, closing the loop.

Modeling the Denmark Strait Overflow

Ha, this is a bad pun. We are modeling the Denmark Strait Overflow – but in a non-numerical, small-scale-and-playdough kind of way.

More than a year ago, Kjetil and I ran that experiment with a group of high-school students and when writing a post about a much more sophisticated version of this experiment I realized I never documented this one in the first place. So here we go!

IMG_3604_small

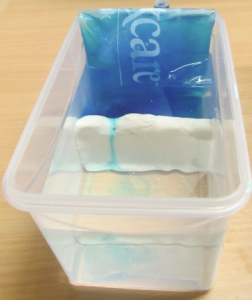
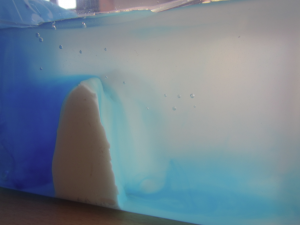
The set-up: Tupper ware with a modeling clay ridge (“let’s call it Greenland-Scotland-Ridge”) across, filled with water to a level above the ridge, cooled with a sport’s-injury cooling pack in “the North”.

Dye is added to the “northern end” of the tank (i.e. the end where the water is being cooled by a sport’s injury cooling pack). As the water cools, it becomes denser and fills up the reservoir on the northern end until it spills over the clay ridge.

IMG_3592_small

The overflow. See the blue, dense reservoir on the left and the dense water spilling over the ridge.

This is a very simple demonstration of how overflows actually work.

IMG_3607_small

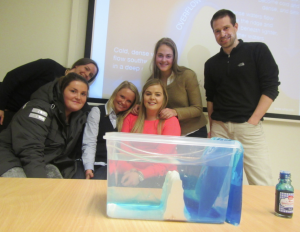
Kjetil, his Master student Eli and some of the high-school students. Can you see the sketch of the Denmark Strait Overflow on the slide in the background? (Plus, for everybody who is interested: This is the food coloring I have been using right there in the front right!)

Barometer problem.

Still talking about hydrostatic pressure.

Yes, I am not done with hydrostatic pressure yet!

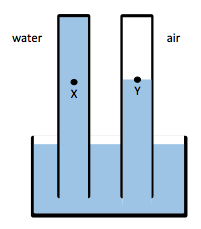
One of the problems students were given in the study “Identifying and addressing student difficulties with hydrostatic pressure” by Loverude, Heron and Kautz is a barometer problem.

hydrostaticpressure02

Barometer problem – compare the pressure at point x and y.

Students are asked to compare the pressure at point X and point Y. Apparently, this is not as obvious as it seems to me. So before I go into the detailed discussion (I might do it in a later post – anyone interested in reading it?), I thought I’d just set this up. Because to me it seems that if you see this sitting there with the liquid clearly not moving one way or another, the solution has to be clear. We’ll see what others think, but here we go:

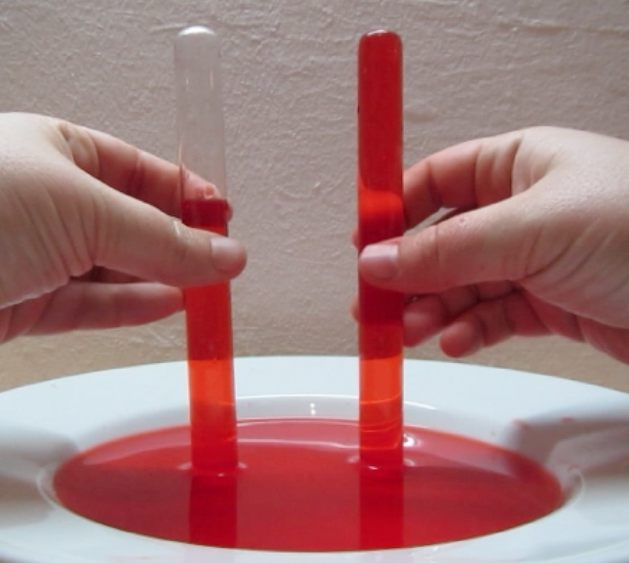
If you want proof that the tubes are open at the bottom and that there still is a hydrostatic equilibrium, watch the movie below. Spoiler alert: You might have fallen asleep by the time things start moving in the movie ;-)

Hydrostatic pressure

What are students not understanding about hydrostatic pressure?

Tomorrow (today by the time this post will go online, I guess) I will present the paper “Identifying and addressing student difficulties with hydrostatic pressure” by Loverude, Heron and Kautz at the Journal Club at work. So tonight I am trying out a couple of experiments that I would like to show with it.

I already know that I am not supposed to show the experiments during the talk, but I figure that there is no harm in having them prepared in case anyone wants to see them afterwards.

And good thing I tried them before instead of just assuming that they would work!

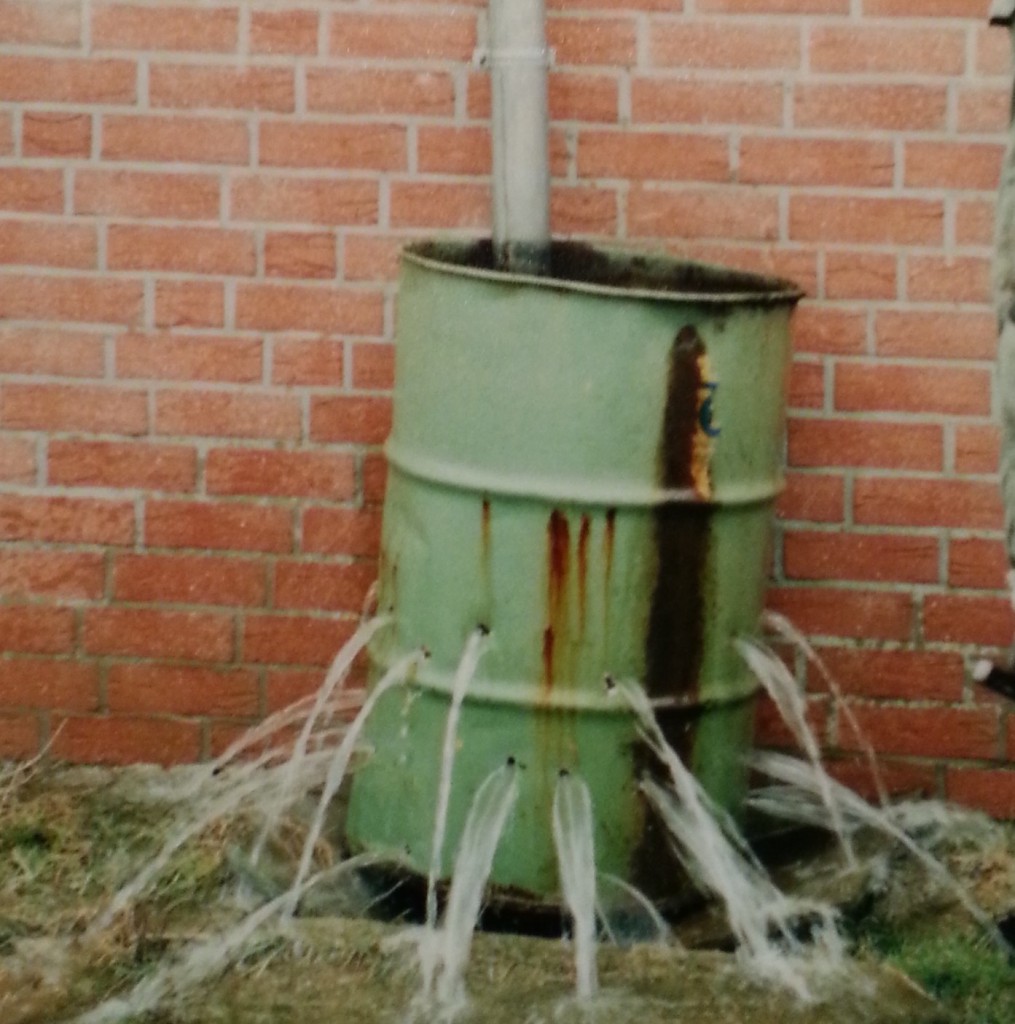
For the first experiment, I had this awesome idea to re-create something I saw as a child when on vacation on a farm:

I was clearly very impressed with it – this picture is from 1994 and I remembered it and asked my parents to track it down for me!

Anyway. Since I wasn’t sure if my colleagues would be happy with that amount of water on the floor, I decided to go for a smaller version of the same thing.

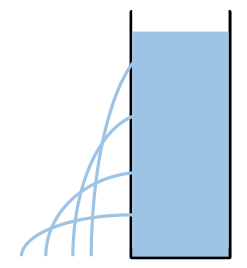
This is what I wanted it to look like (and what it looks like in my presentation):

hydrostaticpressure01

Hydro(almost)static pressure in the idealized case.

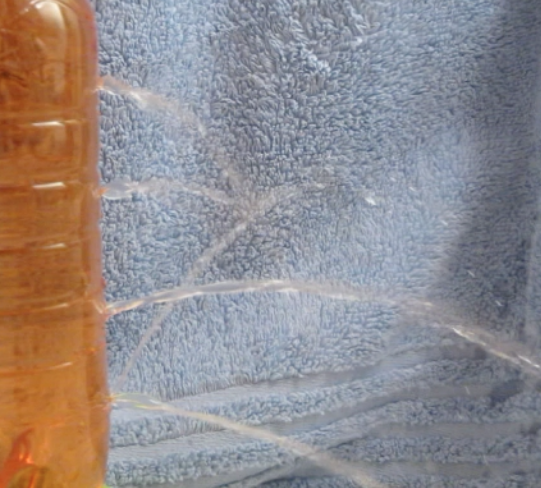
And this is what the experiment ended up looking like:

How disappointing! I guess the holes that I poked into the bottle aren’t well made. But good thing I tried. Watch the movie if you want to pay attention to if you ever want to present this experiment.

Yes. You want to use tape that keeps the water inside the bottle. Until you want to take the tape off. Then you wish you had used something that actually comes off…… ;-)

Cartesian diver – organic version

Using orange peel as cartesian divers.

Guess what my mom told me when we were playing with cartesian divers the other day? That orange peel works really well as a cartesian diver! Who would have thought?

And just because we like playing we tried both orange peel and tangerine peel. Watch!

Funnily enough, they behave very differently. While the thick orange peel works really well, the much less thick tangerine peel very quickly looses all the air bubbles and hence the buoyancy and the ability to adjust buoyancy. So if in doubt (and not interested in extending the experiment to a lesson in contrast and compare) – oranges are the way to go!