Tag Archives: density

Mediterranean outflow

Students demonstrating the mediterranean outflow in a tank.

As reported earlier, students had to conduct experiments and present their results as part of CMM31. Niklas chose to demonstrate the mediterranean outflow – warm and salty water leaving the Mediterranean and sinking to a couple of kilometer’s depth in the Atlantic Ocean.

Since I happened to be around, they allowed me to document the experiments and blog about it, but there is a great description, including a movie, to be uploaded on the webpages of the University Centre of the Westfjords.

When the guys were done with the experiment, I couldn’t help but suggest to tip the tank so that the densest water would spill back into “the Mediterranean”. Check out the movie below if you fancy playing!
Ship-generated internal waves

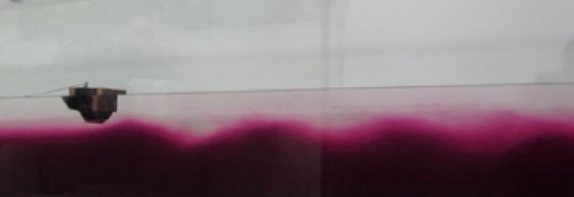
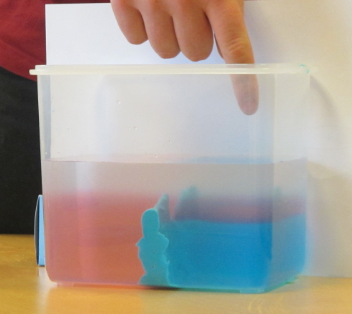
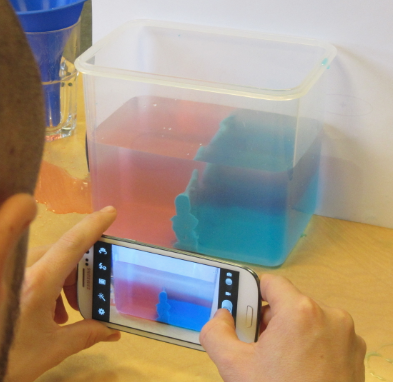
A tank experiment showing ship-generated internal waves.

When entering a fjord from the open ocean by ship, it can sometimes be noted that the speed of the ship changes even though apparently nothing else changed – the wind didn’t change, the position of the sails didn’t change, the settings on the engine didn’t change – whatever was driving the ship didn’t change. And yet, the ship slowed down. How can that be?

According to the legend (that I like to propagate in my classes), when this phenomenon was first noticed, people attributed it to sea monsters latching onto the ship and slowing it down. Or if not monsters, than at least mollusks and other not-quite mostery monsters. But then Bjerknes came along and, together with Ekman, set up experiments that explain what is taking all the energy away from propulsion. I’ll give you a hint:

Yes – the ship excites internal waves at a density interface. Since the stratification in a fjord is much stronger than in the ocean, driving into a fjord means loosing a lot more energy towards the generation of internal waves.

See the movie here:

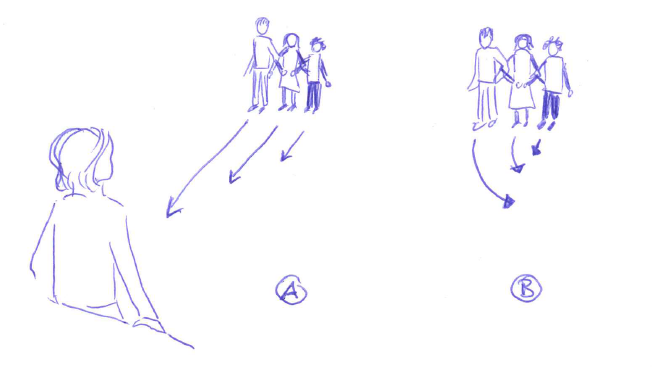
How sound is refracted towards the regions of minimum speed.

Students acting out the process of sound being refracted towards the region of minimum speed.

We’ve been talking about refraction lately. Waves get bent in the direction of lower velocity. This holds for light and sound and even ocean waves. However, students find it conceptually difficult to understand why waves are being bent towards lower rather than higher speeds, so I came up with this very simple demonstration.

Students, arms joint, are acting as a wave crest. Students on the one side of the student chain are told to move very slowly, students on the other side are asked to move quickly towards the instructor. Everybody takes care to not hurt anybody, so if tension builds up in the chain, everybody has to react to reduce the tension. What happens is that the “wave crest” of students changes direction towards the side of the slowest motion.

Easy visualization and – since it involved students getting up, joining arms and doing something – also very memorable. Win – win!

Another easy example: When you are sliding on an icy road and your foot gets caught in grass or gravel or something on one side (== region of lower velocity), you start skidding towards the side with the obstacle, not towards the middle of the icy road.

Fjord circulation

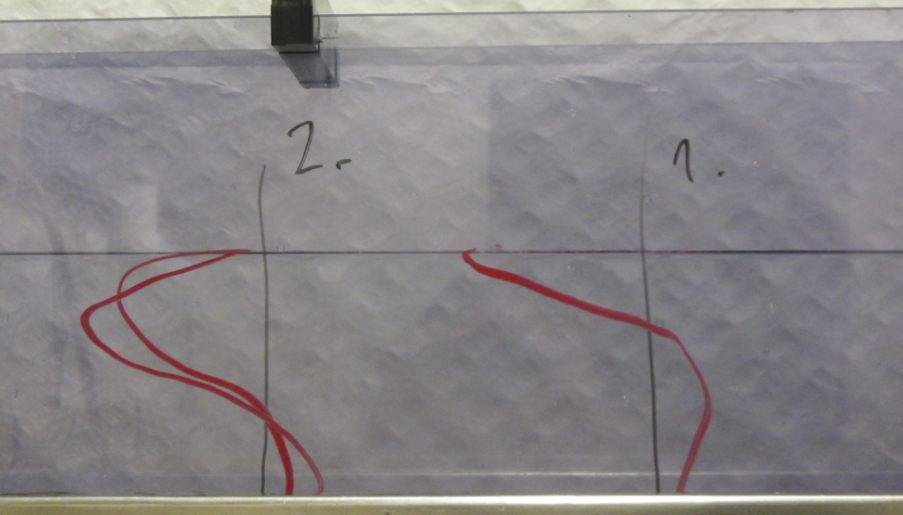
Tank experiment on a typical circulation in a fjord.

Traditionally, a fjord circulation experiment has been done in GEOF130’s student practicals. Pierre and I recently met up to test-run the experiment before it will be run in this year’s course.

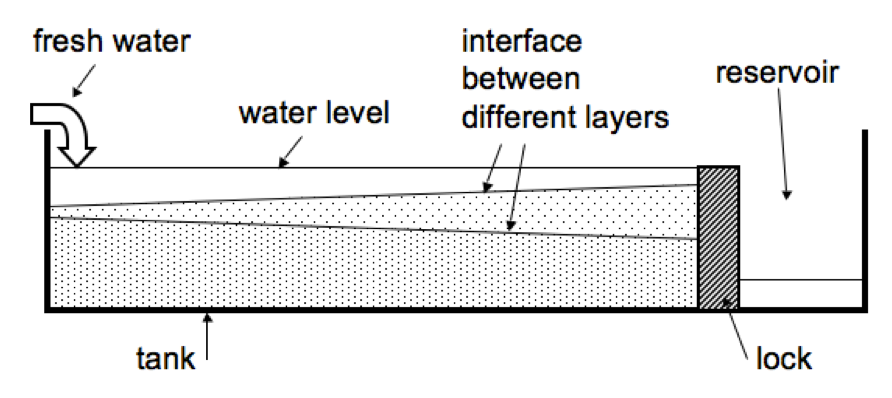
This is the setup of the experiment: A long and narrow tank, filled with salt water, a freshwater source at one end and an outlet at the other end. This sets up a circulation from the head towards the mouth of the fjord close to the surface, and a deep return flow.

Watch the movie below to see how different circulations are set up depending on the depth of the freshwater source. As in the picture, velocity profile 1 is for the case where freshwater is being added close to the surface, and in case 2 the freshwater is being added deeper down.

Dangers of blogging, or ice cubes melting in fresh water and salt water

When students have read blog posts of mine before doing experiments in class, it takes away a lot of the exploration.

Since I was planning to blog about the CMM31 course, I had told students that I often blogged about my teaching and asked for their consent to share their images and details from our course. So when I was recently trying to do my usual melting of ice cubes in fresh water and salt water experiment (that I dedicated a whole series on, details below this post), the unavoidable happened. I asked students what they thought – which one would melt faster, the ice cube in fresh water or in salt water. And not one, but two out of four student groups said that the ice cube in fresh water would melt faster.

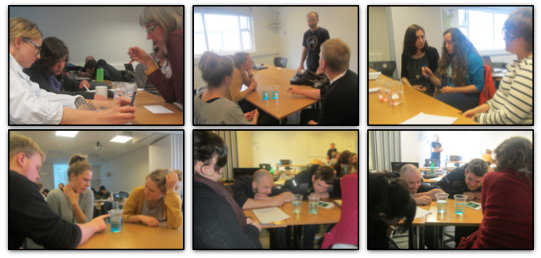
Student groups conducting the experiment.

Since I couldn’t really ignore their answers, I asked what made them think that. And one of the students came out with the complete explanation, while another one said “because I read your blog”! Luckily the first student with the complete answer talked so quickly that none of the other – unprepared – students had a chance to understand what was going on, so we could run the experiment without her having given everything away. But I guess what I should learn from this is that I have taken enough pictures of students doing this particular experiment so that I can stop alerting them to the fact that they can oftentimes prepare for my lectures by reading up on what my favorite experiments are. But on the upside – how awesome is it that some of the students are motivated enough to dig through all my blog posts and to even read them carefully?

For posts on this experiment have a look a post 1 and 2 showing different variation of the experiment, post 3 discussing different didactical approaches and post 4 giving different contexts to use the experiment in.

Measuring density

Students build a device to measure density.

As described in this post, I like to have students build “instruments” to measure the most oceanographic properties (temperature, salinity and density). I find that they appreciate oceanographic data much more once they have first-hand experience with how difficult it is to design instruments and make sense of the readings.

Students designing a hydrometer.

Measuring (relative) density is by no means easy. There are a lot of conceptual things to understand when developing hydrometers – one question that comes up every time is what to mark. The first idea tends be to mark displacement on the cup – either a zero-mark without the hydrometer in the cup and then the water level once the hydrometer is floating in the water, or the level of the bottom of the hydrometer. Which makes it fairly hard to measure other samples than the ones the instrument was initially calibrated with.

The student group working on the task was faced with – and overcame – many difficulties. The straw was top-heavy, so in order to float more or less vertically, it had to be cut down. They had four different test solutions, but they did not know the densities of those solutions, only their salinities, hence they developed their own density scale relative to which they measured the density of their solution. Pretty ingenious!

How a CTD works

Movie on how the most important instrument in oceanography works.

On our cruise on the WHOI research vessel Knorr in 2011, Sindre Skrede (find him on twitter or vimeo for many more exciting pictures and movies!) and I made a movie for his blog, describing the most important oceanographic instrument. We recently translated the movie from Norwegian to English and here it is. Enjoy!

Filling the tank

A movie of patterns observed in the flow when filling the tank for this experiment.

Even though there are tons of scientific things to discuss with this movie, like the different refraction of light in the two layers of different densities, or the filaments, or the restratification processes, I am mainly posting this because I think it is beautiful. Enjoy!

Details of lee waves in the tank.

A movie focusing on details of the lee waves in the tank.

In this post, we investigated lee waves in a tank in a general way. Here, I want to show a detail of those lee waves:

In this movie, the concept of hydraulic control becomes visible. On the upstream side of the mountain, the dense water layer forms a reservoir which is slightly higher than the mountain. On top of the mountain and towards its lee side, the layer of denser water is stretched thin and has a smooth surface until about half way down the mountain, where waves start to form. In this thin, smooth layer, flow speeds are higher than the wave speeds, hence disturbances of the interface are flushed downstream and cannot deform the interface. Only about halfway down the mountain, the phase speed becomes equal to the flow speed, hence waves can both form and stay locked in place relative to the mountain.

For more information on internal waves, check out these posts [which are scheduled to go online over the next couple of days]:

Surface imprints of internal waves

How internal waves in the ocean can be spotted on the surface.

Under certain conditions, internal waves in the ocean can be spotted at the ocean’s surface due to changes in surface roughness or to the movement of floating foam or debris. They can be spotted if half their wavelength is longer than the distance between the interface on which the internal wave is traveling and the water surface, so that the orbital movement caused by the internal waves reaches the water surface. In the tank, they can also be seen – for example by adding small floating particles to the water surface.

MVI_3064

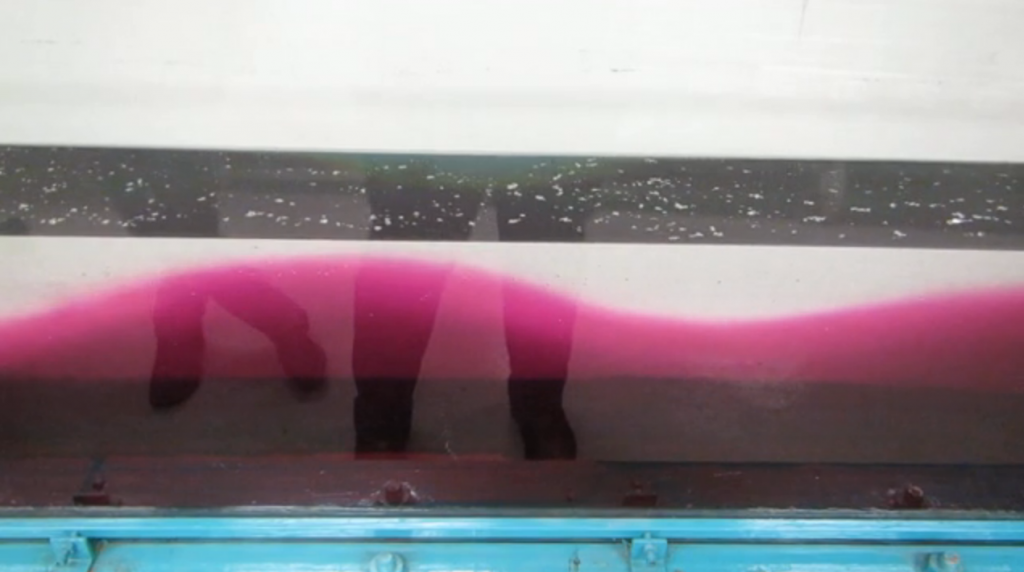
Internal wave in a tank. Seen from the side due to different coloring of the two layers, and on the surface in the distribution of floating tracer.

In the movie below, you can see the interface between water layers of different densities and the water surface with particles on it. The particles make it easy to spot how the water surface is being stretched and squeezed as internal waves travel through underneath.

For more information on internal waves, check out these posts [which are scheduled to go online over the next couple of days]: