Category Archives: tank experiment

Observing waves in a tank

So you thought filling water into a tank was boring? Not on my watch!

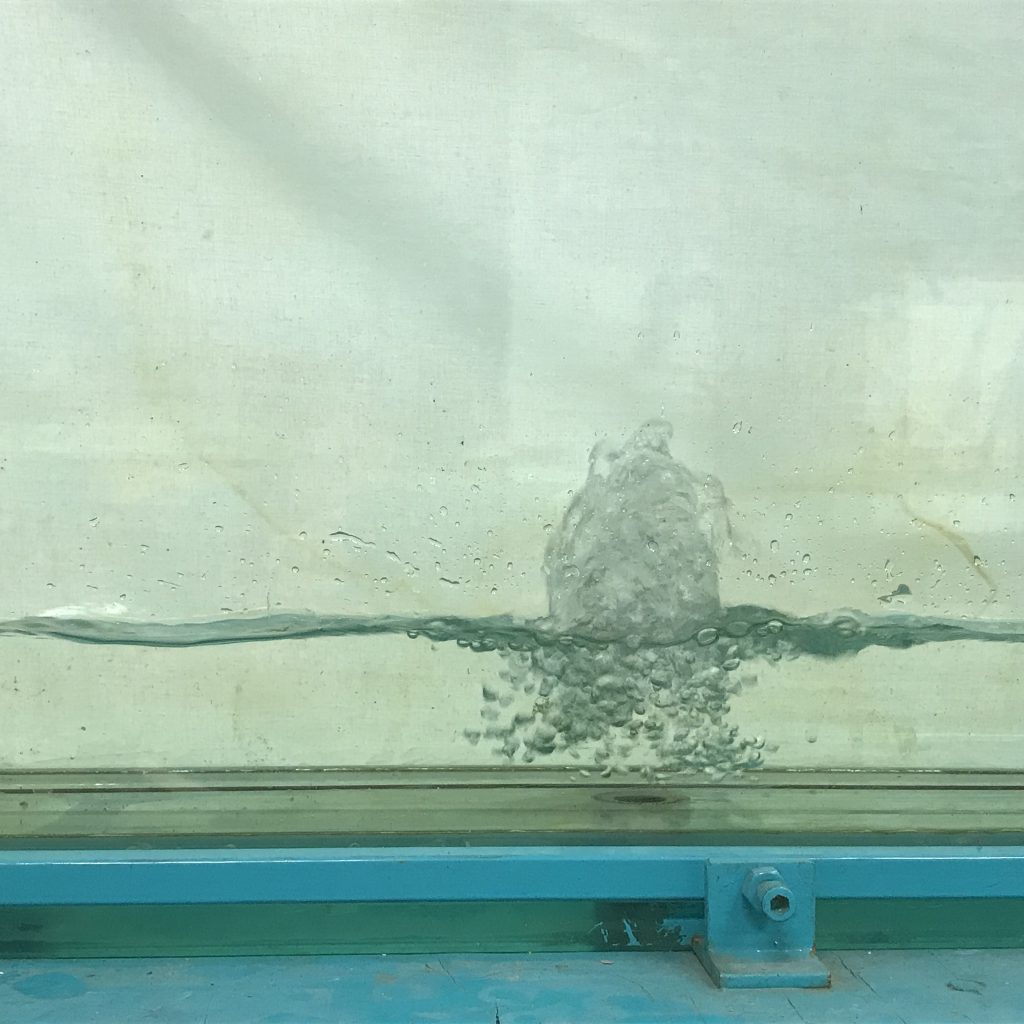
This is how we fill up the tank: Through a hole at the bottom. Which leads to a very nice fountain that slowly submerges as the water level rises:

…and to tons of nice waves, which are great to observe!

Propagation of waves

Below you see waves propagating. Can you spot the water’s orbital movement, i.e. water particles moving in circles, even though the wave phase is propagating from left to right?

Standing waves

After a while, waves are reflected at the end of the tank and propagate back, setting up a different, very cool, pattern:

Now the wave phase does not seem to travel any more! Instead, there are fixed points in space where water levels oscillate between maximum and minimum, and in between there are other points where the water level stays more or less the same. How cool is that?!

…And this is just filling the tank. Just wait how cool it gets when we are actually running our demonstrations! :-)

Please discuss: Experimental setup for Nansen’s “dead water”

During my last visit to Bergen in August, we set up a nice “dead water” experiment. However, there are nice experiments, and then there are awesome experiments, and since Elin wants to use this experiment in her teaching of the ocean and atmosphere dynamics class, we are going for the latter!

So I’ve done some reading and this is what I have come up with (and I am posting this before we’ve actually run the experiment as basis for discussion with Elin and anyone else who might be interested in discussing this. If you have any comments to share, please do! This is by no means final and I am really happy about any kind of input I am getting!)

Why we want to do an experiment

The ocean & atmosphere dynamics course is really theoretical. It would be nice to add something practical! At least for me it really helps to raise motivation to buckle down and think about the theory if I have observed something and I learn theory in order to understand or manipulate what I observed rather than just for the sake of learning theory.

What I want students to get out of the activity

Yay, learning outcomes! I know, people hate it when I start talking about those, but I really think they are the best starting point. So here we go:

  • Read (authentic) scientific literature, extract relevant information, apply it to an experiment and modify parameters accordingly
  • Get an intuitive understanding of the behaviour of internal waves
  • Explain qualitatively (and quantitatively?) how the speed of the boat and the phase velocity of internal waves relate to the drag on the boat

Why this experiment

  • Internal wave experiments get complex very very quickly. This is a two-layer system that should be comparatively easy to both control (Ha! I wish…) and interpret (Ha!! Yes. I know…).
  • This is a very nice historical example, too, going back to Nansen’s Fram expeditions. Nansen is a national hero in Norway, the Bjerknes Centre for Climate research which I am currently visiting is named after Bjerknes, who was involved in figuring this out. So lots of local references!

Setup of the experiment

Stratification

John Grue’s (2018) article “Calculating Fram’s Dead Water” uses the historical observations described by Nansen in “Farthest North” (1897) to quantify the conditions that led to Nansen’s observations: Nansen found a reduction of speed down to 1/5th of the expected speed, and Grue relates this to a density stratification, specifically a pycnocline depth. I’m using the Grue (2018) article as basis for our stratification in the tank, which we set up to best resemble the one the Fram experienced.

Layer depths

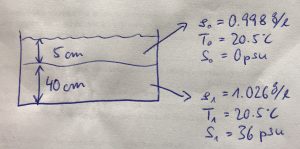
Grue describes a strong wave wake and force for a ratio of the ship’s draught (b0) to upper layer depth (h0) close to 1. For our model “Fram”, b0 is 5cm, which leads to an h0 of 5cm, too.

Grue used a ratio of h0/h1 of 1/18, which would lead to h1 of 90 cm. This is unfortunately not possible since our tank is only 50cm deep (of which the upper two cm cannot be used because of braces needed to stabilise the tank, and the water level needs to be another 3 or so cm lower because the ship will need to be able to pass below the braces. Hence our max h1 is approximately 40cm, leading to a ratio of h0/h1 of 1/8. No idea if this makes a difference? Something for students to discuss…

We could obviously also use a smaller model ship with half the drought and we’d be fine. Maybe we should do that just to figure out if it makes a difference.

Density stratification

To set up the density, we can manipulate both temperature and salinity of the water we are using.

For practical reasons, the temperature the water in our tank should be room temperature (so the tank can sit all set up, waiting for class, without equilibration with the room messing things up). Temperature in the teaching lab was T0=20.5°C when I checked this morning.

To minimize the amount of salt we need to use, we’ll use the freshest possible setup, with the upper layer having a salinity of S0=0g/l.

Grue describes a density difference between the layers of ρ0/ρ1 = 1/1.028. Using the density ρ0=0.998 g/l (calculated from T0 and S0 as above), this ratio leads to a density of ρ1=1.026g/l. For T1=T0=20.5°C, S0 thus needs to be 36g/l. (Phew! And seeing that I typically use 0 for “fresh” and 35 for “salty” anyway, this was a lot of thinking to come to pretty much the same result ;-))
How to move the boat

After just pulling it by hand in previous experiments (which was surprisingly difficult, because you need to pull veeery slowly, without jerking on the string), we’ve been thinking about different ways to move the boat.

First we thought we should program an Arduino to really slowly pull the ship through the tank, and use a dynamometer (you know, one of those spiral feathers that shows you how much force is applied by how far it stretches. Or the easy version, a rubber band) to figure out the drag of the ship.

But as I looked a little more into the experiment, and I found a really neat website by Mercier, Vasseur and Dauxois (2009) describing the experiment and the weight drop setup they used. They make the point that the dead water phenomenon is actually not about a constant speed evolution, it’s about applying a constant force and seeing how the boat reacts to that. Which I find convincing. That way we see the boat being slowed down and accelerating again, depending on its interactions with the internal waves it is creating which is a lot more interesting than seeing a feather or rubber band stretch and contract.

Mercier et al. have the boat strapped to a belt with constant tension on it, which they then force via a pulley system with a drop weight of a few milligrams (I think our friction might be higher then theirs was, so we might need a little more weight!).

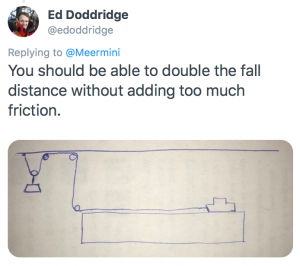
Only problem here (and I am not quite sure how big a problem this really is): We can only pull the boat for a distance as long as the ceiling in the basement is high, and that’s definitely nowhere near the length of our 6m tank. That seems a waste, but maybe a shorter distance is still enough to see all we want to see (and at least we won’t have reflections from the ends of the tank interfering if we pick the stretch in the middle of the tank)? Or is there an easy way to use pulleys or something to have the weight seem to fall deeper? Any ideas, anyone?

10.10.2018 — Edited to include this idea I got on Twitter. This is so obvious yet I didn’t think of it. Thanks a lot, Ed, I will definitely try that! Also, is anyone still doubting the usefulness of social media?
11.10.2018 — Edited: Wow, as a sailor it’s really embarrassing that people have to point me to all kinds of different pulley systems to get this problem done! Only two issues I have now: 1) What I’ve been ignoring so far but can’t ignore any longer: The weight of the rope will increase with the length of the rope, hence the force won’t be constant but increasing, too. Since we are expecting to be working with weights of the order of a couple of paper clips, even a thin yarn might contribute substantially to the total force. Will definitely have to weigh the yarn to figure out how large that effect is! 2) Since we are expecting such tiny weights to be enough, all the blocks needed in a pulley system are already way too heavy, so we’ll have to figure out some light weight fix for that!

Mercier et al. also used a magnet at the back of the ship and one outside the tank to release the boat, which is a neat idea. But, as they point out, one could also just release the ship by hand, which is what I think we’ll opt for.

What we could ask students to do

Figure out the experimental setup

We could ask them to do basically what I did above — figure out, based on the Grue (2018) article, how to run a tank experiment that is as similar as possible to the situation Nansen described having experienced on the Fram.

Discuss layer depths

In the setup I described above, our ration of layer depths is 1/8 instead of the 1/18 assumed in the Grue (2018) article. Does that actually make a difference? Why would it? Do we think the differences are large enough to warrant running the experiment with the 1/18 ratio, even though that means changing the stratification and getting a new boat?

Check on how close we are to theory

For the density stratification as described above, the relationship
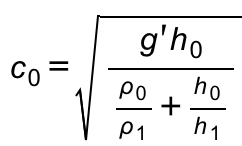
gives a phase velocity of the internal wave of c0=0.1m/s, meaning that it would take a wave crest 1min to cross our 6m long tank. We’ll see how that holds up when we do the experiment! And we could ask the students to do those calculations and compare them to the observations, too.

Compare dead water, deep water and shallow water cases

In their 2011 article, Mercier, Vasseur and Dauxois show the drag-speed relationships for dead water, deep water and shallow water (in Figure 1). The resistance will obviously be different for our setup since we’ll likely have a lot more friction, but qualitatively the curves should be similar. Might be fun to test! And also fun to interpret.

Even if we concentrate on the dead water case only (so we don’t have to empty and refill the tank), there is a lot to think about: Why is there a maximum in the resistance in the dead water case with both lower and higher speeds having a lower resistance? Probably related to how the ship interacts with the internal waves, but can we observe, for example, which Froude number that happens at, i.e. how fast the ship is moving relative to the phase velocity of the internal wave (which we both calculate and observe beforehand)?

Now it’s your turn!

What do you think? What’s your feedback on this? My plan is to go down to the lab tomorrow to figure out how to pull the boat with a drop weight. If you think that’s a really bad idea, now would be the time to tell me, and tell me what to do instead! :-)

Really, I welcome any feedback anyone might have for me! :-)

Fun notes that didn’t fit anywhere else

11.10.2018 — Edited: My former colleague Robinson pointed me to a research project he is involved in related to dredging the Elbe river (to make it possible for large container ships to reach the port of Hamburg) where they actually also look at how much ships are being slowed down, not by internal waves necessarily, but by the turbulence and turbidity they cause in the muddy river bed! That’s really cool! But the scaling is completely off from our experiment so their setup is unfortunately not transferable (they drag big objects with constant speed through the actual Elbe and measure the force that is needed).
Experiment: Double-diffusive mixing (salt fingering)

On the coolest process in oceanography.

My favorite oceanographic process, as all of my students and many of my acquaintances know, is double-diffusive mixing. Look at how awesome it is:

Double-diffusive mixing happens because heat and salt’s molecular diffusion are very different: Heat diffuses about a factor 100 faster than salt. This can lead to curious phenomena: Bodies of water with a stable stratification in density will start to mix much more efficiently than one would have thought.

In the specific case of a stable density stratification with warm, salty water over cold, fresh water, finger-like structures form. Those structures are called “salt fingers”, the process is “salt fingering”.

IMG_4233_sehr_klein

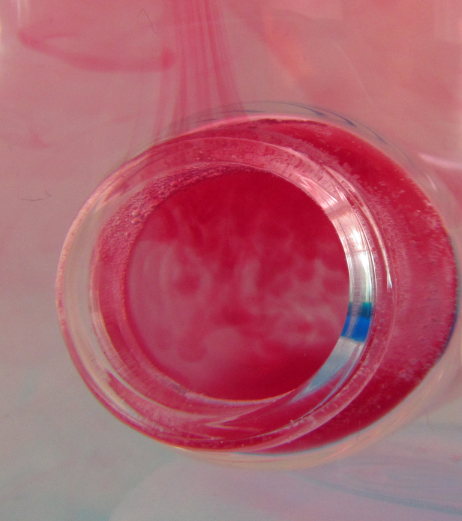
Salt fingering occuring with the red food dye acting as “salt”.

Even though salt fingers are tiny compared to the dimensions of the ocean, they still have a measurable effect on the oceanic stratification in the form of large-scale layers and stair cases, and not only the stratification in temperature and salinity, but also on nutrient availability in the subtropical gyres, for example, or on CO2 drawdown.

Over the next couple of posts, I will focus on double diffusive mixing, but less on the science and more on how it can be used in teaching. (If you want to know more about the science, there are tons of interesting papers around, for example my very first paper)

How to easily set up the stratification for the salt fingering process.

Setting up stratifications in tanks is a pain. Of course there are sophisticated methods, but when you want to just quickly set something up in class (or in your own kitchen) you don’t necessarily want to go through the whole hassle of a proper lab setup.

For double diffusive mixing, there are several methods out there that people routinely use.

For example the hose-and-funnel technique, where the less dense fluid is filled in the tank first and then the denser fluid is slid underneath with the help of a hose and a funnel. And a diffuser at the end of the hose. And careful pouring. And usually a lot more mixing than desired.

Or the plastic-wrap-to-prevent-mixing technique, where the dense fluid is put into the tank, covered by plastic wrap, and then the lighter fluid is poured on top. Then the plastic wrap is removed and by doing so the stratification is being destroyed. (No video because I was frustrated and deleted it right away)

Or some other techniques that I tried and didn’t find too impressive. (No videos either for the same reason as above)

But then accidentally I came across this method (as in: I wanted to show something completely different, but then I saw the salt fingers and was hooked):

Granted, this is not a realistic model of an oceanic stratification. But as you can see towards the end of that movie, that turns out to be a blessing in disguise if you want to talk about the process in detail. As you see in the movie, the salt fingers inside the bottle are much smaller than the salt fingers outside the bottle. Because, clearly, inside the bottle the warm water is cooled both at the interface with the cold water inside the bottle, and by heat conduction through the walls of the bottle, since the water is surrounded by cold water. The warm water that flowed out of the bottle and up towards the water’s surface is only cooled at the interface with the water below (the air above is warmer than the cold water). So this gives you the perfect opportunity to discuss the scaling of salt fingers depending on the stratification without having to go through the pains of actually preparing stratifications with different gradients in temperature or salinity.

IMG_9084

Self-portrait with salt fingers :-)

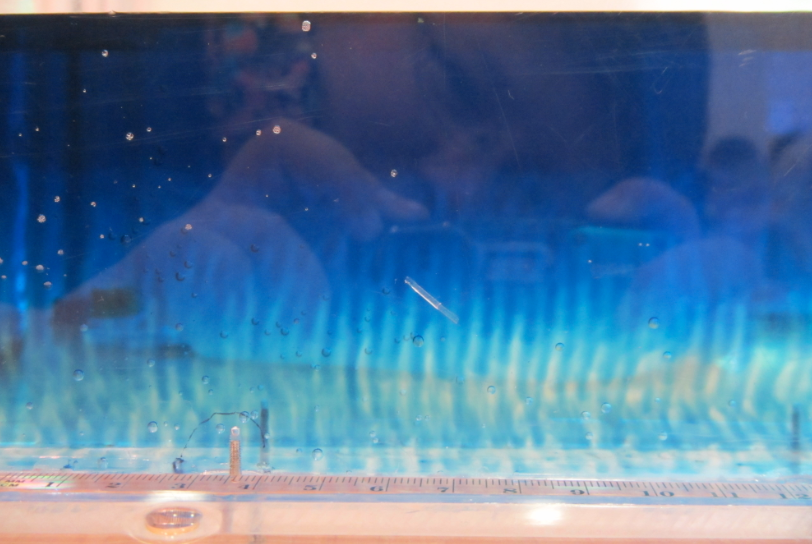
In my experience, the best salt fingers happen when you use hot water with dye (as the warm and salty top layer) and cold fresh water below. Salt fingers develop quickly, you don’t have the hassle of hitting the exact temperatures or salinities to make the density stratification statically stable, yet unstable in salinity, and it ALWAYS works.


IMG_9079

Double-diffusive mixing. Scale at the bottom is centimeters.


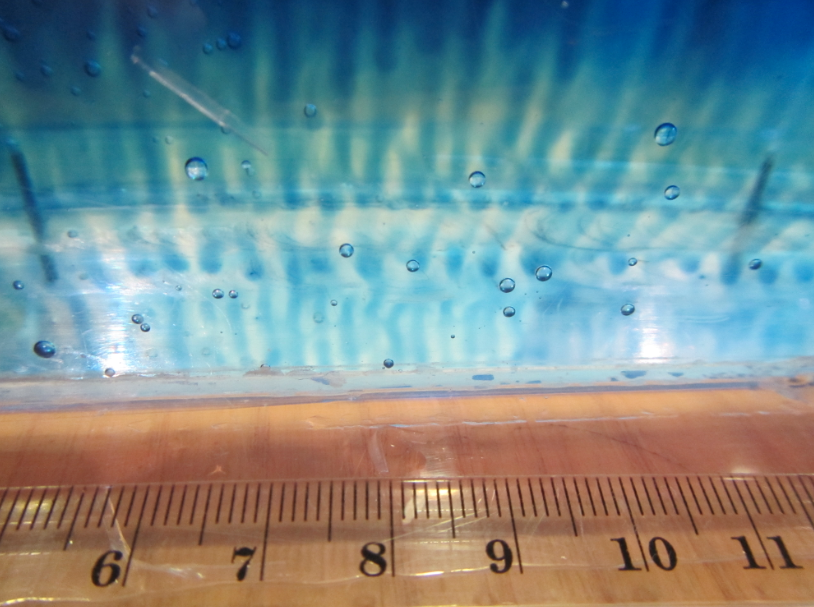
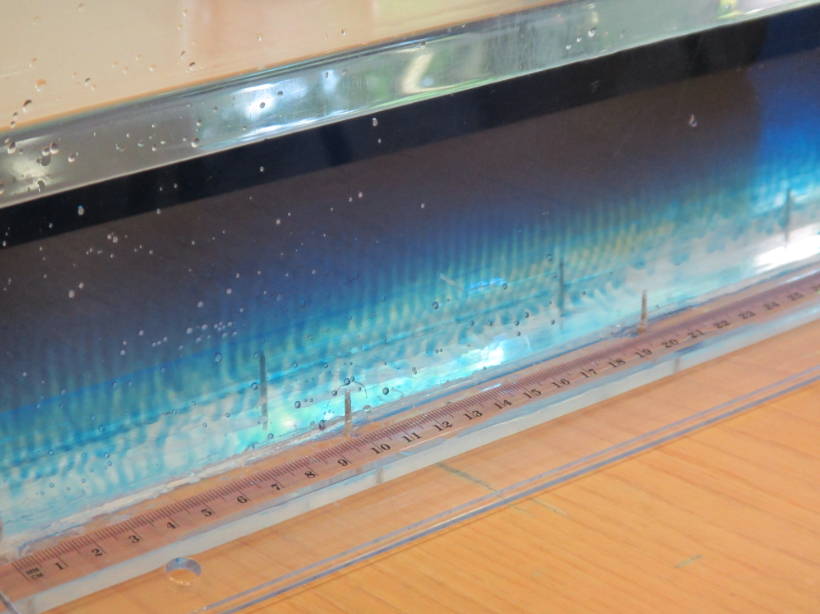
IMG_9054

Salt fingering in a tank. Scale at the bottom is centimeters.

And look at how beautiful it looks! Do you understand why I LOVE double diffusion?

P.S.: This text originally appeared on my website as a page. Due to upcoming restructuring of this website, I am reposting it as a blog post. This is the original version last modified on November 4th, 2015.

I might write things differently if I was writing them now, but I still like to keep my blog as archive of my thoughts.

Experiment: Temperature-driven circulation

My favorite experiment. Quick and easy and very impressive way to illustrate the influence of temperature on water densities.

This experiment is great if you want to talk about temperature influencing density. Although it doesn’t actually show anything different from a temperature driven overturning experiment, where circulation is determined by hot water rising and cold water sinking, somehow this experiment is a lot more impressive. Maybe because people are just not used to see bottles pouring out with the water coming out rising rather than plunging down, or maybe because the contrast of the two bottles where one behaves exactly as expected and the other one does not?

Anyway, it is really easy to do. All you need is a big jar and two small bottles. Cold water in one of the small bottles is dyed blue, hot water in the other small bottle is dyed red. Both are inserted in the jar filled with lukewarm water (movie below).

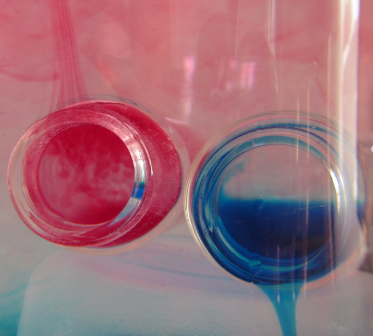
Using bottles with a narrower neck than mouth is helpful if you want to use the opportunity to talk about not only temperature-driven circulation, but also about double-diffusive mixing (which you see in form of salt fingers inside the red bottle in the picture above).

Isn’t this beautiful?

P.S.: This text originally appeared on my website as a page. Due to upcoming restructuring of this website, I am reposting it as a blog post. This is the original version last modified on December 2nd, 2015.

I might write things differently if I was writing them now, but I still like to keep my blog as archive of my thoughts.

Waves in a density stratification. One of the most beautiful tank experiments I’ve ever seen.

It’s pretty impressive when a mountain moves through a stratification and generates lee waves. But what I find even more impressive: The waves that travel behind the mountain when the mountain is long gone. See here:

This kind of stuff looks more like a numerical simulation than something actually happening in a tank, doesn’t it? I am pretty stoked that we managed to set up such a nice stratification! Those are the things that make me really really happy :-)

(The setup of this experiment is the same as in this post)

Tank experiment: Lee waves in a fancy density (and dye) stratification

Did you seriously think we’d stop tank experiments with only 2-layer systems? Nooo!

Today, the plan was to set up a continuous stratification, which I have been planning to do for many years. After fiddling with the setup all morning (do you have any idea how many fittings on all kinds of hoses are needed to get that to work well?), reality set in and we ended up doing a quasi-continuous stratification, i.e. 12 density layers dyed in 6 different colors*.

And this is what it looks like when you tow a mountain through that stratification (and try to ignore the excited audience being reflected in the tank): Still very nice lee waves and surprisingly little turbulence!

*We set up the tank to contain the same amount of salt as our 2-layer system yesterday, so instead of one big density jump from about 1000g/l to 1026g/l, this now happened in 5 smaller, more or less regular, jumps. And here is how we did it in the end: Two large reservoirs (unfortunately of different diameters), one containing freshwater, the other one filled up to the same height, containing as much salt as we had in our experiment yesterday. Now the height of the reservoirs was divided in 12 equal dzs, and for each dz that went out of the “freshwater” tank into the experimental tank, we added salt water of the same dz to the “freshwater” tank, which thus continued to increase in salinity. The water that we mixed that way went through a hose and entered the experimental tank through the bottom of the tank through a hole over which we had put the mountain (to contain mixing to a small volume and also so we didn’t have to watch water shooting out of that hole in our nice stratification). So as the water we added became increasingly dense, it nicely layered itself underneath the other water in the tank. And we just had to add more and more dye for the color gradient. Easy peasy :-)

The one where it would help to understand the theory better (but still: awesome tank experiment!)

The main reason why we went to all the trouble of setting up a quasi-continuous stratification to pull our mountain through instead of sticking to the 2 layer system we used before was that we were expecting to see a tilt of the axis of the propagating phase. We did some calculations of the Brunt-Väisälä frequency, that needs to be larger than the product of the length of the obstacle and the speed the obstacle is towed with (and it was, by almost two orders of magnitude!), but happy with that result, we didn’t bother to think through all the theory.

And what happened was what always happens when you just take an equation and stick the numbers in and then go with that: Unfortunately, you realize you should have thought it through more carefully.

Luckily, Thomas chose exactly that time to come pick me up for a coffee (which never happened because he got sucked into all the tank experiment excitement going on), and he suggested that having one mountain might not be enough and that we should go for three sines in a row.

Getting a new mountain underneath an existing stratification is not easy, so we decided to go for the inverse problem and just tow something on the surface rather than at the bottom. And just to be safe we went with almost four wavelengths… And look at what happens!

We are actually not quite sure if the tilting we observed was due to a slightly wobbly pulling of the — let’s use the technical term and go for “thingy”? — or because of us getting the experiment right this time, but in any case it does look really cool, doesn’t it? And I’ll think about the theory some more before doing this with students… ;-)

Dead water — the fancy experiment including Nansen himself

Now that we do have a really awesome 12-layer 6-color stratification, we obviously had to do the dead water experiment again. This time we chose to include a not-too-happy-looking Nansen on the ship, too!

I love this even more than the one we did yesterday!

“Dead water” or: ship-generated internal waves

And here is another experiment that can be done with the same stratification as the lee waves: Towing a ship to explore the phenomenon of “dead water”!

Dead water is well known for anyone sailing on strong stratifications, i.e. in regions where there is a shallow fresh or brackish layer on top of a much saltier layer, e.g. the Baltic Sea of some fjords. It has been described as early as 1893 by Fridtjof Nansen, who wrote, sailing in the Arctic: “When caught in dead water Fram appeared to be held back, as if by some mysterious force, and she did not always answer the helm. In calm weather, with a light cargo, Fram was capable of 6 to 7 knots. When in dead water she was unable to make 1.5 knots. We made loops in our course, turned sometimes right around, tried all sorts of antics to get clear of it, but to very little purpose.” (cited in Walker,  J.M.; “Farthest North, Dead Water and the Ekman Spiral,” Weather, 46:158, 1991)

Finding the explanation for this phenomenon took a little while, but in 1904, Vilhelm Bjerknes explained that “in the case of a layer of fresh water resting on the top of salt water, a ship will not only produce the ordinary visible waves at the boundary between the water and the air, but will also generate invisible waves in the salt-water fresh-water boundary below” — a lot of the ship’s work is now going towards generating the internal waves at the interface rather than for propulsion.

It’s hard to imagine how a ship will generate waves somewhere in the water below, so we are demonstrating this in the tank:

Isn’t it fascinating to think about how far oceanography has come in only a little over a hundred years? And despite all the extremely powerful instrumentation and modelling that we have available now, how cool are even such simple demonstrations in a tank? These are the moments where I know exactly why I went to study oceanography in the first place, and why it’s still the most fascinating subject I can think of…

Lee waves in the tank

Did you guess what we needed the stratification for? Yes — we are moving mountains again! :-)

What we want to look at: How a current reacts to an obstacle in its way, especially a current in a stratification. But since it is really difficult to set up a current in a tank, let alone a stratified one, we are doing the next best thing: Moving the obstacle relative to the water rather than the other way round.

And this is what it looks like:

Et voilà: Beautiful lee waves!

And look at the paper bits floating on the surface and how they visualize convergences and divergences in the upper layer!

The three layers in the pink all have (more or less) similar densities, and are only dyed slightly differently because we had to make several batches of dyed salt water to be able to fill the tank. But look how well they show that the wave is really happening at the interface, and that the other layers are phase locked. What would happen if the stratification inside the pink layer was stronger? Just wait and see…. ;-)