Category Archives: observation

Tank experiment: Lee waves in a fancy density (and dye) stratification

Did you seriously think we’d stop tank experiments with only 2-layer systems? Nooo!

Today, the plan was to set up a continuous stratification, which I have been planning to do for many years. After fiddling with the setup all morning (do you have any idea how many fittings on all kinds of hoses are needed to get that to work well?), reality set in and we ended up doing a quasi-continuous stratification, i.e. 12 density layers dyed in 6 different colors*.

And this is what it looks like when you tow a mountain through that stratification (and try to ignore the excited audience being reflected in the tank): Still very nice lee waves and surprisingly little turbulence!

*We set up the tank to contain the same amount of salt as our 2-layer system yesterday, so instead of one big density jump from about 1000g/l to 1026g/l, this now happened in 5 smaller, more or less regular, jumps. And here is how we did it in the end: Two large reservoirs (unfortunately of different diameters), one containing freshwater, the other one filled up to the same height, containing as much salt as we had in our experiment yesterday. Now the height of the reservoirs was divided in 12 equal dzs, and for each dz that went out of the “freshwater” tank into the experimental tank, we added salt water of the same dz to the “freshwater” tank, which thus continued to increase in salinity. The water that we mixed that way went through a hose and entered the experimental tank through the bottom of the tank through a hole over which we had put the mountain (to contain mixing to a small volume and also so we didn’t have to watch water shooting out of that hole in our nice stratification). So as the water we added became increasingly dense, it nicely layered itself underneath the other water in the tank. And we just had to add more and more dye for the color gradient. Easy peasy :-)
Lee waves in the tank

Did you guess what we needed the stratification for? Yes — we are moving mountains again! :-)

What we want to look at: How a current reacts to an obstacle in its way, especially a current in a stratification. But since it is really difficult to set up a current in a tank, let alone a stratified one, we are doing the next best thing: Moving the obstacle relative to the water rather than the other way round.

And this is what it looks like:

Et voilà: Beautiful lee waves!

And look at the paper bits floating on the surface and how they visualize convergences and divergences in the upper layer!

The three layers in the pink all have (more or less) similar densities, and are only dyed slightly differently because we had to make several batches of dyed salt water to be able to fill the tank. But look how well they show that the wave is really happening at the interface, and that the other layers are phase locked. What would happen if the stratification inside the pink layer was stronger? Just wait and see…. ;-)

Kelvin-Helmholtz instabilities

I’m back at my happy place — the teaching lab at GFI in Bergen! :-)

Here a quick look at what we’ve been doing today: Filling the large wave tank! With clear fresh water and then salty pink water that forms a layer below. As the pink water flows underneath the clear water, there is shear between the two layers, waves form and then they break. Beautiful Kelvin-Helmholtz shear instabilities!

Why have we filled the large tank? Just you wait and see… ;-)

Experiment: Interference of waves

Interference of waves is something often taught either using light as a practical example, or without a practical example. Here I want to show a couple of observations as well as a simple experiment.

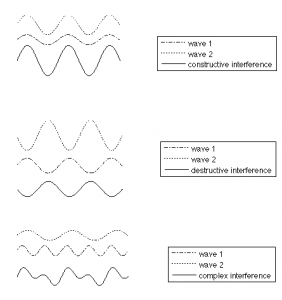
When talking about waves, it is often difficult to explain that wave heights of different components of a wave field can be added to each other to give a resulting wave field, but that each of those components continues to travel with its own direction and speed and comes out of the wave field basically unaltered. Students learn about constructive, destructive and complex interference (see image below), but it is hard to realize that those interactions are only momentary and that waves come out on the other side without having changed their shape.

Constructive, destructive and complex interference of waves.

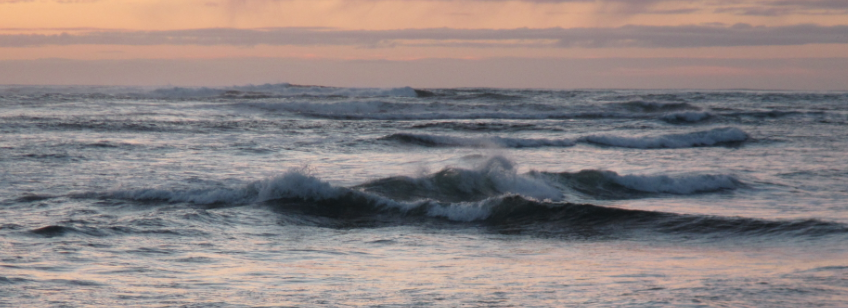
In the ocean or on lakes or rivers, you are sometimes lucky enough to observe interference of waves. At a lighthouse in the southwest of Iceland, I took the image below: Two distinct fields were meeting each other at an almost 90 degree angle, interacted and left on the other side still clearly recognizable.

Two wave crests meeting at approximately 90 degree angle.

The waves met, interacted, and left the area of interaction. Watch the movie below to get an impression!

Of course, it is very hard to plan your course such that you happen to observe this out in the “real world”. But interference of waves is so easy to set up, in any pool or tub of water! If your body of water is very small, you can even create waves with only one source and have the reflection from a wall interfere with the “original” wave (actually, you’ll probably have to, because otherwise the reflected waves will mess with the ones you are creating).

Screen shot 2015-08-16 at 11.44.47 AM

Feet tapping in the lake in Ratzeburg to create a pattern of wave interference

Check out the movie below! This is so easy to do, yet so impressive if you have never observed it before.

P.S.: This text originally appeared on my website as a page. Due to upcoming restructuring of this website, I am reposting it as a blog post. This is the original version last modified on November 27th, 2015.

I might write things differently if I was writing them now, but I still like to keep my blog as archive of my thoughts.

Asking students to take pictures to help them connect theory to the reality of their everyday lives

— This post was written for “Teaching in the Academy” in Israel, where it was published in Hebrew! Link here. —

Many times students fail to see the real-life relevance of what they are supposed to be learning at university. But there is an easy way to help them make the connection: Ask them to take pictures on their smartphones of everything they see outside of class, write a short sentence about what they took a picture of, and why it is interesting, and submit it on an electronic platform to share with you and their peers. And what just happened? You made students think about your topic on their own time!

Does it work?

Does it work? Yes! Obviously there might be some reluctance to overcome at first, and it is helpful to either model the behaviour you want to see yourself, or have a teaching assistant show the students what kind of pictures and texts you are looking for.

Do I have to use a specific platform?

Do I have to use a specific platform? No! I first heard about this method after Dr. Margaret Rubega introduced the #birdclass hashtag on Twitter for her ornithology class. But I have since seen it implemented in a “measuring and automation technology” class that already used a Facebook group for informal interactions (see here), and by a second class on the university’s conventional content management system. All that is required is that students can post pictures and other students can see them.

Do you have examples?

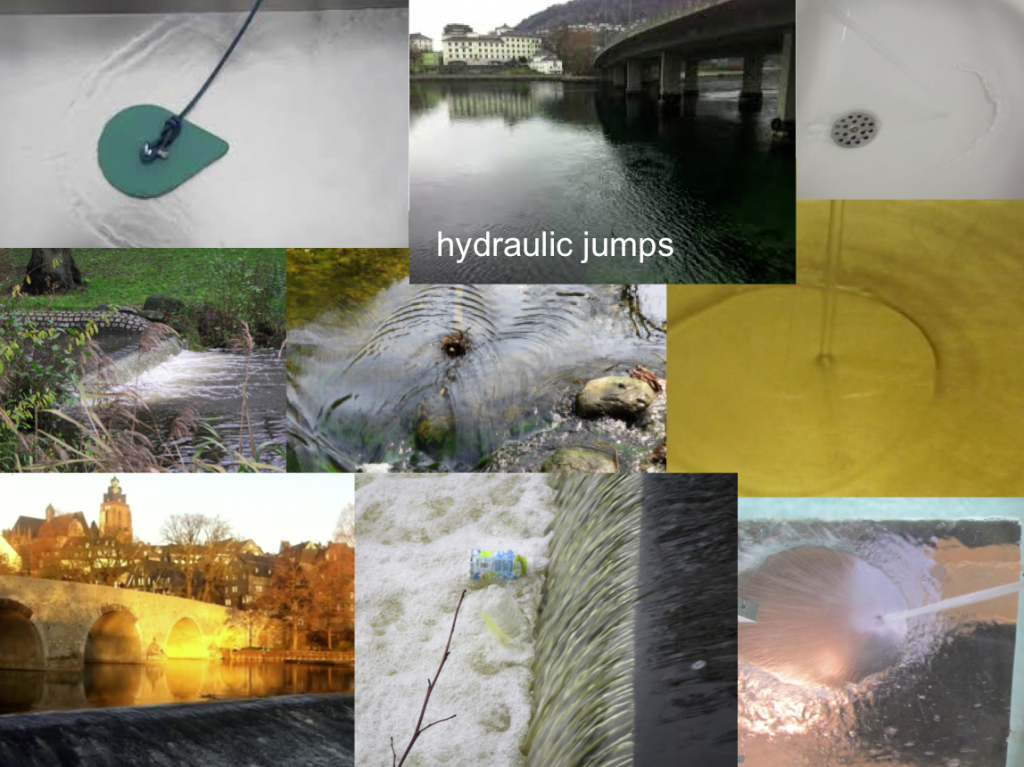
One example from my own teaching in physical oceanography: Hydraulic jumps (see figure below). The topic of hydraulic jumps is often taught theoretically only and in a way that students have a hard time realizing that they can actually observe them all the time in their real lives, for example when washing your dishes, cleaning your deck or taking a walk near a creek. But when students are asked to take pictures of hydraulic jumps, they start looking for them, and noticing them. And even if all of this only takes 30 seconds to take and post a picture (and most likely they spent more time thinking about it!), that’s 30 extra seconds a student thought about your content, that otherwise he or she would have only thought about doing their dishes or cleaning their deck or their car.

hydraulic_jumps

Collection of many images depicting hydraulic jumps found in all kinds of environments of daily life

And even if you do this with one single topic and not every single topic in your class, once students start looking at the world through the kind of glasses that let them spot the hydraulic jumps, they are going to start spotting theoretical oceanography topics everywhere. They will have learned to actually observe the kind of content you care about in class, but in their own world, making your class a lot more relevant to them.

An additional benefit is that you, as the instructor, can also use the pictures in class as examples that students can relate to. I would recommend picking one or two pictures occasionally, and discussing for a minute or two why they are good examples of the topic and what is interesting about them. You can do this as introduction to that day’s topic or as a random anecdote to engage students. But acknowledging the students’ pictures and expanding on their thoughts is really useful to keep them engaged in the topic and make them excited to submit more and better pictures (hence to find better examples in their lives, which means to think more about your course’s topic).

Does this work for subjects outside of STEM, too?

Does this work for subjects outside of STEM, too? Yes! In a language class, for example, you could ask people to submit pictures of something “typically English [or whatever language you are teaching]”. You can then use the pictures to talk about cultural features or prejudices. This could also be done in a social science context. In history, you might ask for examples of how a specific historical period influences life today. In the end, it is not about students finding exact equivalents – it is about them trying to relate their everyday lives to the topics taught in class and the method presented in this article is just a method to help you accomplish that.

P.S.: This text originally appeared on my website as a page. Due to upcoming restructuring of this website, I am reposting it as a blog post. This is the original version last modified on October 1st, 2016.

I might write things differently if I was writing them now, but I still like to keep my blog as archive of my thoughts.

The mystery of Lokksund. Mysterious as ever, and I am still intrigued…

Forget climate change and all the big questions, there is this one thing that is really bugging me because I haven’t figured it out yet, but I really want to: This morning, when I was searching my old backup drives for data for my friend, I came across my favorite oceanography riddle of all times (which is still, as far as I know, unsolved!).

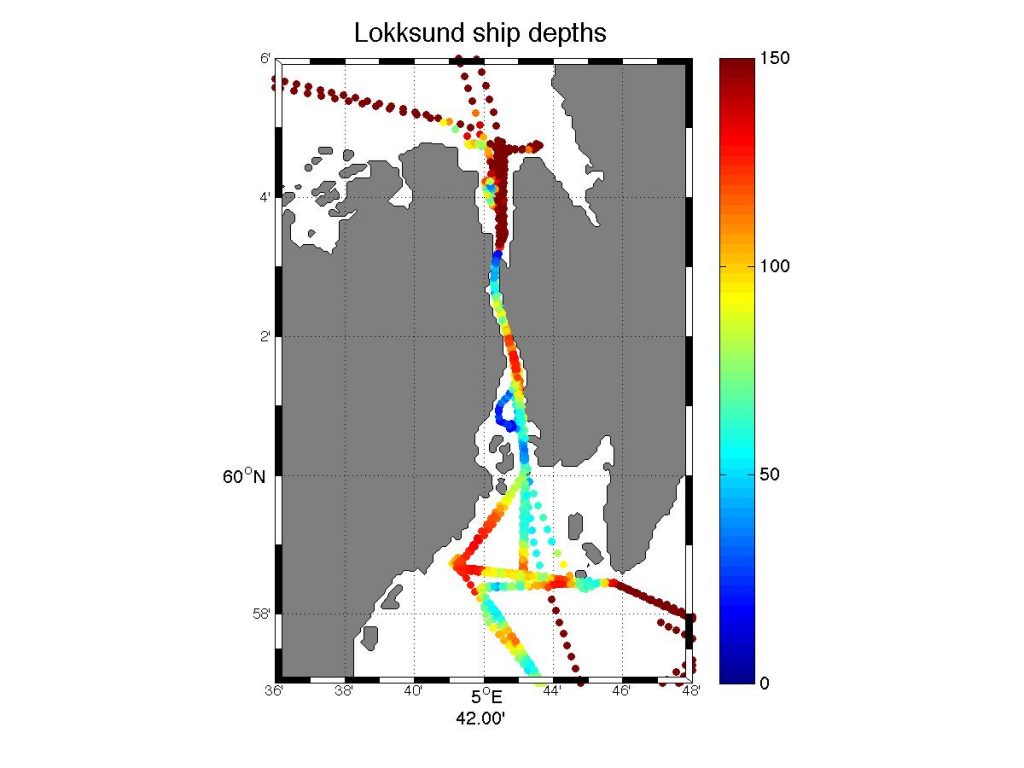
In 2012 and 2013, I went on cruises in the area of Hardangerfjorden, and there is one place that I find very intriguing: A narrow straight, connecting Hardangerfjorden in the south to Bjørnafjorden in the north. This straight is called Lokksund, and in its narrowest bit it’s only something like 20 meters wide and 30 meters deep. Which, as soon as water levels on both ends of the street are not exactly the same, leads to pretty strong currents.

In the description of Norwegian shipping lanes, it says about Lokksund “in the narrow part of the straight, the tidal current can be strong, up to 3-4 knots during spring tides, shifting direction every two hours. It goes southward for two hours before high tide, stops at high tide, goes north for two hours after high tide, and so on. … If there is constant wind from the south, the current can go continuously northwards. For wind from north or west, the same situation can happen with southward currents” (Den norske los 3, Farvannsbeskrivelse, Jørem Rev-Stad, 2006).

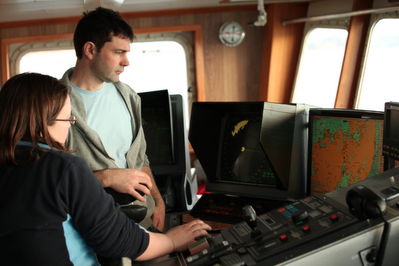
That the current is very strong in the straight was fairly obvious, and captain and crew were understandably not too happy that we wanted to spend a lot of time there (funnily enough, it’s Lokksund you see on the map on the screen in the picture below! Clearly, I really wanted to go there!).

Screen shot 2012-03-09 at 6.24.50 PM

On the bridge, discussing the scientific plan for the next day. Picture courtesy of Angus Munro.

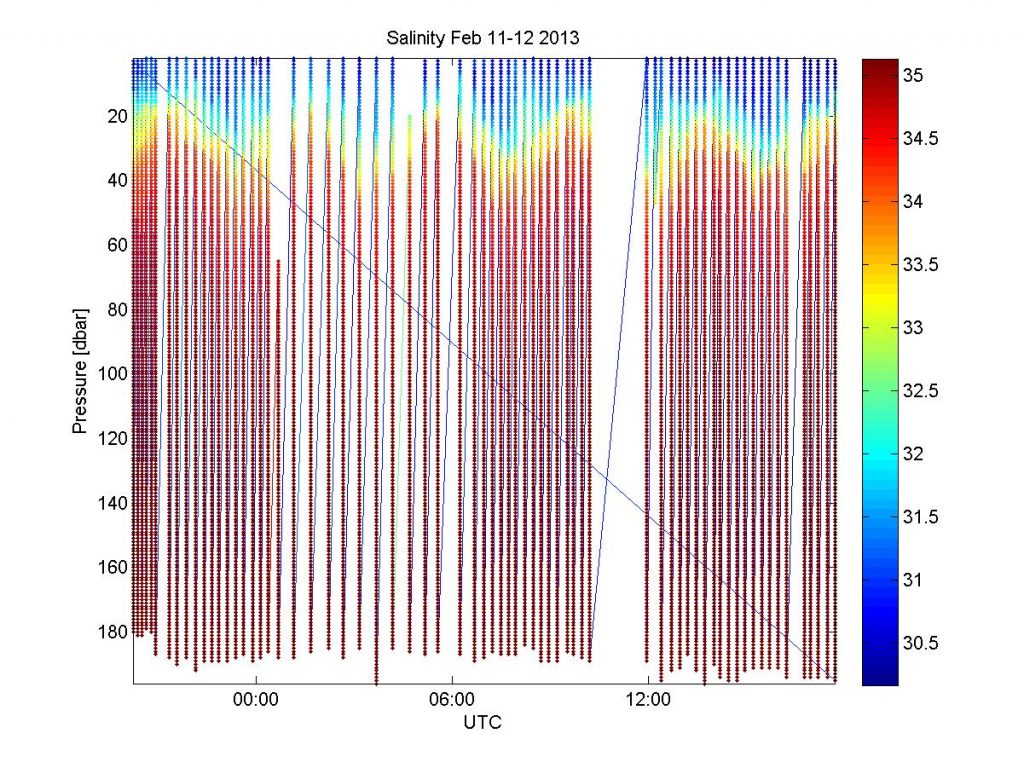
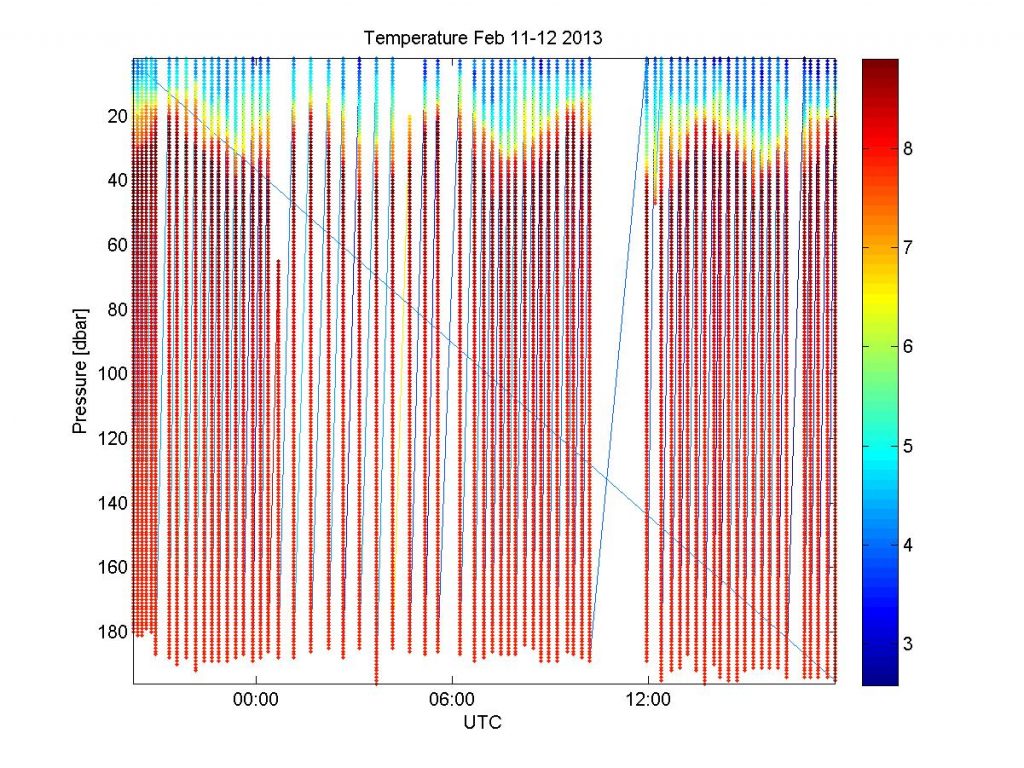
However, the current directions that we observed didn’t seem to agree with the farvannsbeskrivelse, but they also did not seem to agree with tides from mooring data we had from north and south of the mouths of Lokksund. So we ended up doing a repeat CTD station just north of Lokksund. The CTD data is very interesting:

Above, you see a plot for salinity, and below for temperature. And there is a strong interface in both S and T — approximately at sill depth! — that is oscillating with the same frequency as described in the farvannsbeskrivelse, although from what I remember the timing was somehow different from what we expected based on the tides from the mooring data we had available.

Also, looking at how narrow the straight is, even with peak speeds of 3-4 knots, the volume of water that can actually go through Lokksund is actually very small. So even though the mixing in the narrow spots with high speeds is probably very high, the volume of displaced water is still very very low, and it’s not even clear how big its influence on mixing between the two fjords is.

But that’s not what makes me so intrigued: It should be such an easy system to understand: A narrow straight and water levels on either end driving the flow through the straight. Right? Except there is clearly more to it, and I wish I could go back there and figure out what that is!

I know for a fact that to this day, some of the crew vividly remember the time we spent in Lokksund during that cruise, and that they don’t have the fondest memories of being in a narrow straight in a strong current in the dark. But I still think it was good we spent all that time there, and luckily Elin is taking on this riddle now, hope you will keep us posted on what you find! :-)

“Laboratory layered latte” – combining latte and double diffusion. Easily my favourite paper ever!

My friends know me well. Especially A&I, which was proven again when they sent me the link to an article about two things that I am mildly obsessed with: Latte and double-diffusive mixing.

My obsession with latte is a fairly recent thing, but I have been known to blog about interesting convection pattern in it (for example here). The obsession with double-diffusive mixing, however, is well documented for more than the last 12 years (for example when I am writing experimental instructionspoems or scientific articles about it).

The double-diffusive process that I have been most concerned with is salt fingering, because it is oh-so-pretty, and also fool-proof to create for teaching purposes (when you know how to do it).

Diffusive layering I seem have to be a little frustrated with, at least in teaching (but reading back this post now, it turns out that that was entirely my own fault and not my students’. Oh well, you live and learn! Isn’t this exactly the kind of stuff that makes for great teaching portfolios? ;-)).

And it also turns out that I did the experiments themselves all wrong. According to the article “laboratory layered latte” by Xue et al. (2017). I should not have been trying to carefully stratify a tank in order to see diffusive layering. Instead, I should just have quickly poured the lower density fluid into the higher density one, and layers would have formed by themselves!

So there is one thing that you won’t see any time soon:

Yep. Me drinking latte from any kind of vessel that doesn’t let me look at the stratification! I don’t know how I could ever have fallen into the trap of missing out on observing fluid dynamics while having my early morning coffee in the office. Now I urgently need a nice glass mug!

And you should go check out the article, it’s a really nice read. My new ambition in life: Write a fluid dynamics research article that applies the FD to some really cool, yet mundane, every day thing. Are you in, Elin? :-)

Xue, Nan and Khodaparast, Sepideh and Zhu, Lailai and Nunes, Janine K. and Kim, Hyoungsoo and Stone, Howard A., Laboratory layered latte. Nature Communications 8(1), 2017

Let’s guess tides!

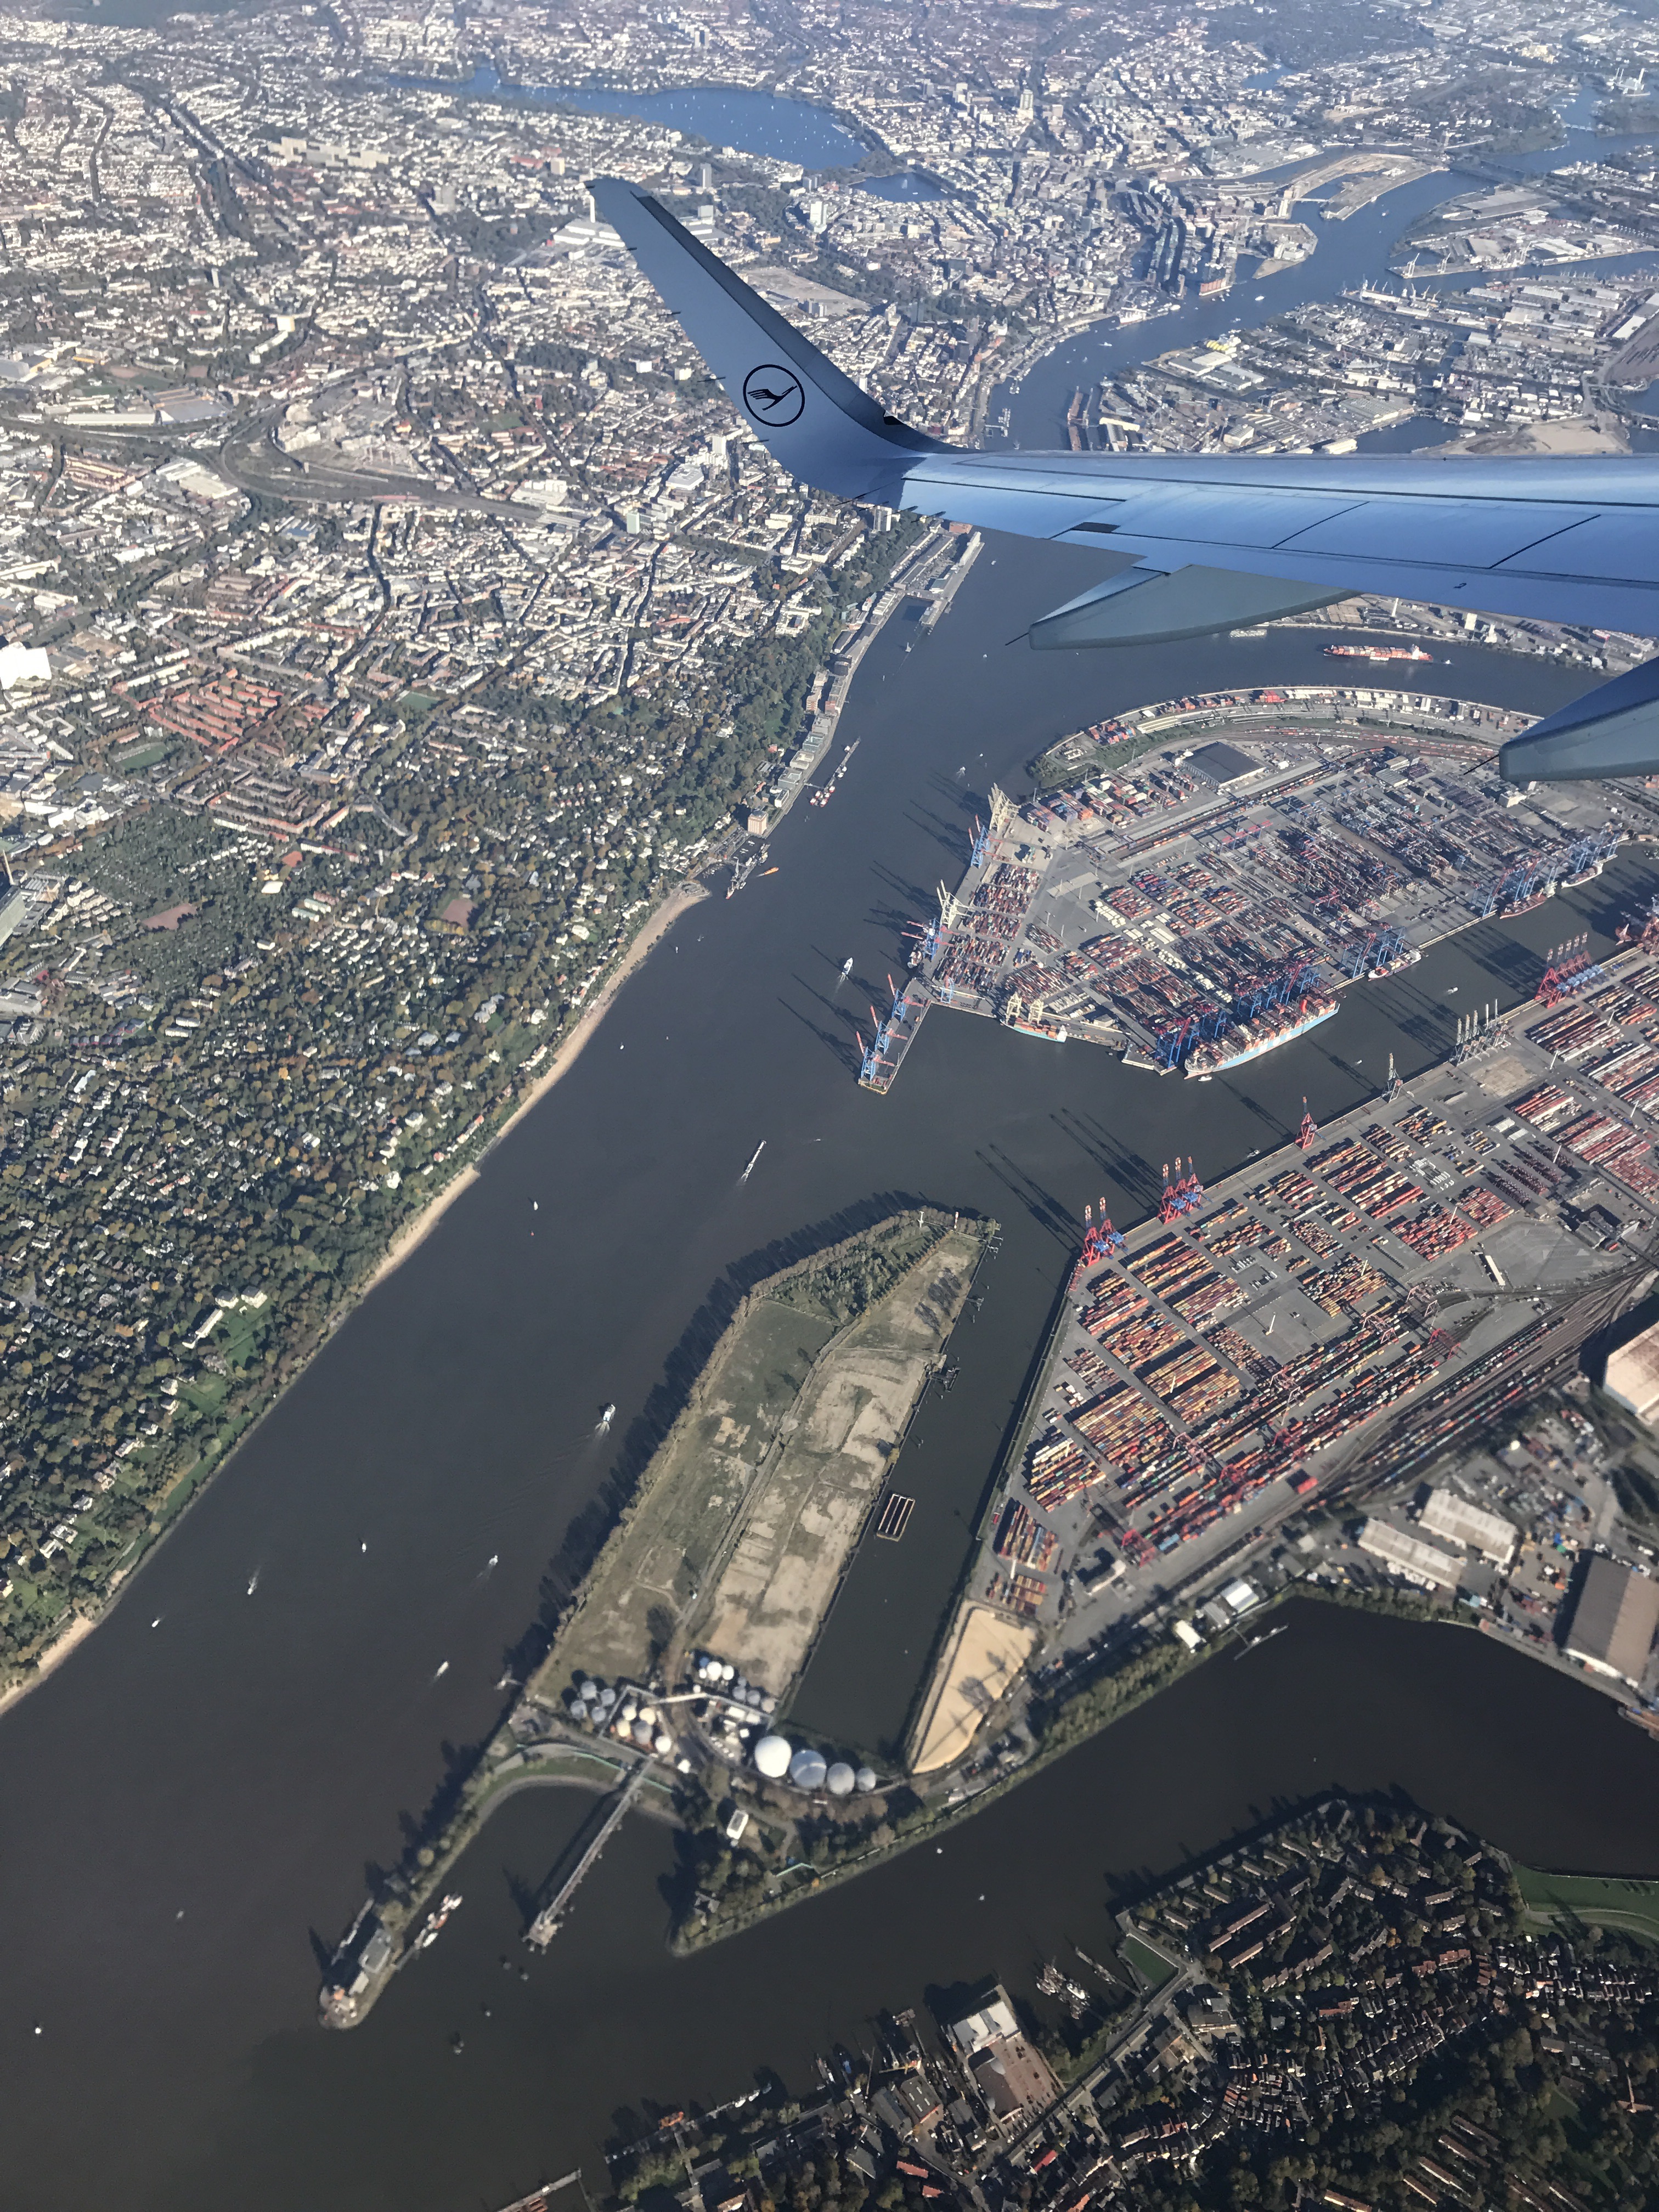
Actually, there is no need to guess. If you tilt your head 45 degrees to the left, you are looking at Hamburg the way it would be shown on a map, North up. The Elbe river, which you see in the foreground, flows east-to-west into the North Sea. And now there are at least two spots in the image below where you can see fronts in the water, more turbid water in the main river bed, clearer water in side arms and bays. Those fronts always start at upstream headlands and go downstream from there, therefore it must be ebb tide, with the water going out into the North Sea. Easy peasy :-)


Funny how “upstream” and “downstream” make so little sense in a tidal river, yet everybody knows what I mean…

Would be interesting to see if you can see fronts when the tide is coming in, too, when the muddy river water is pushed into the more stagnant side arms and bays. I expect so but don’t actually know. Maybe I will be able to observe it on some future flight?

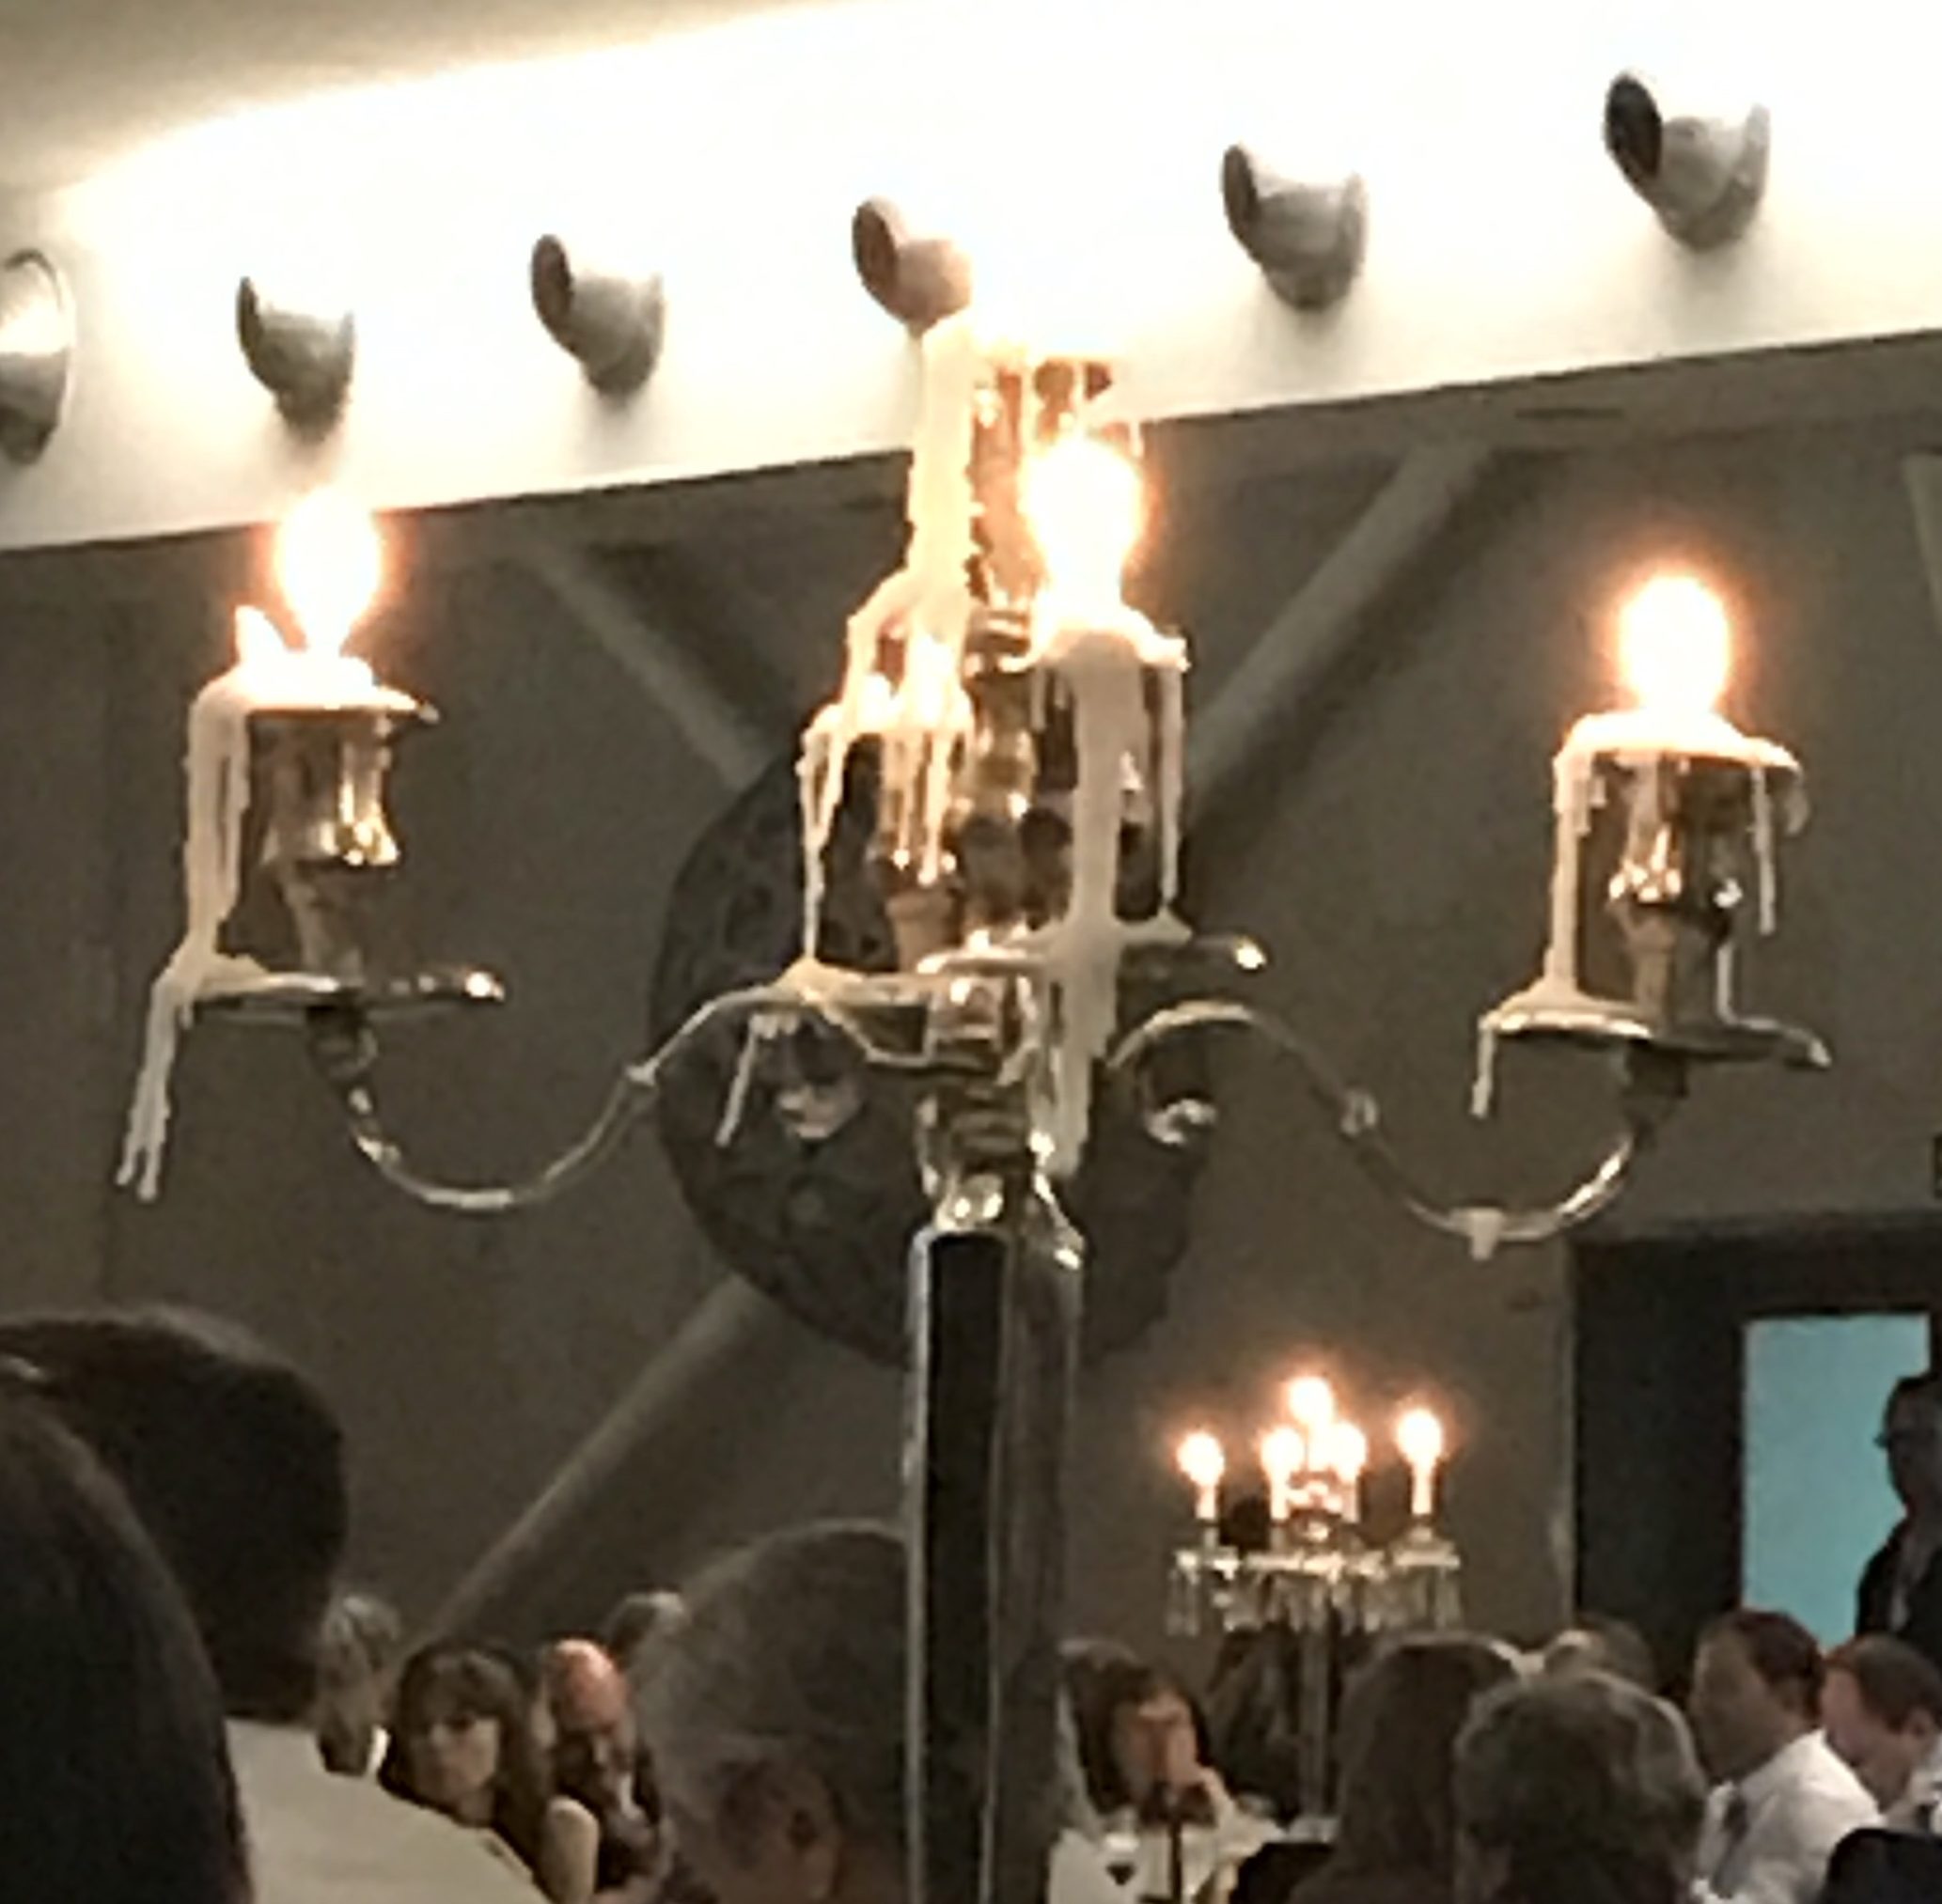
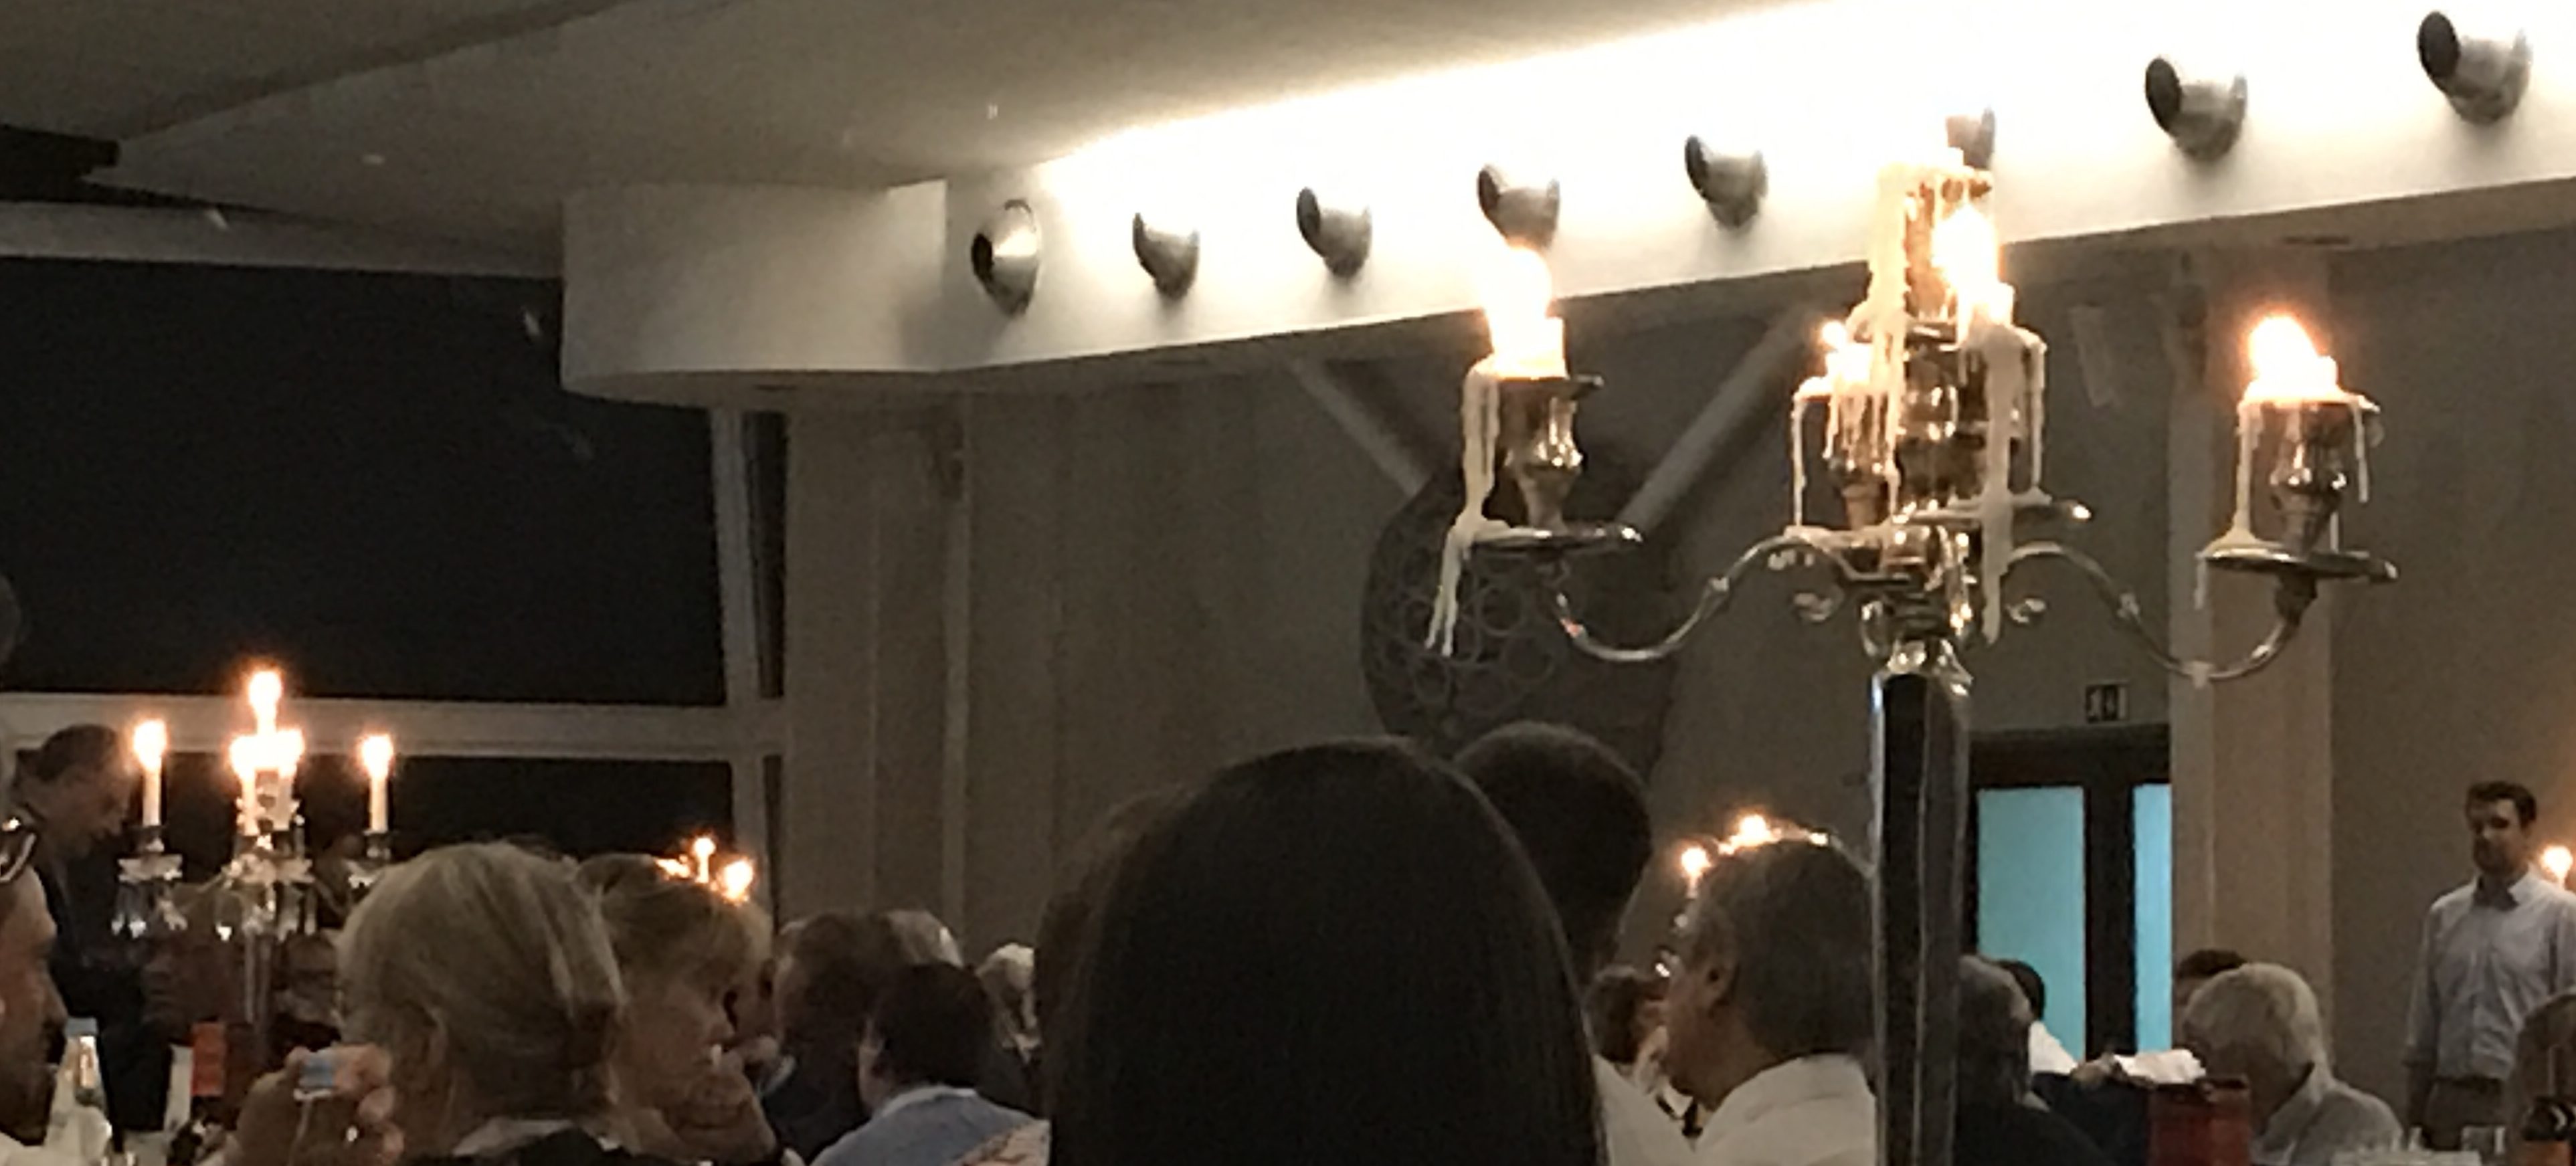
Candles in the wind. Or: The things that keep a nerd entertained during speeches at a conference dinner.

What keeps you entertained at conference dinners is probably different for different people, but we quite enjoyed watching how the candles placed closer to the door to the balcony burned a lot faster (and a lot more messy) than those on other tables…