Please discuss: Experimental setup for Nansen’s “dead water”
During my last visit to Bergen in August, we set up a nice “dead water” experiment. However, there are nice experiments, and then there are awesome experiments, and since Elin wants to use this experiment in her teaching of the ocean and atmosphere dynamics class, we are going for the latter!
So I’ve done some reading and this is what I have come up with (and I am posting this before we’ve actually run the experiment as basis for discussion with Elin and anyone else who might be interested in discussing this. If you have any comments to share, please do! This is by no means final and I am really happy about any kind of input I am getting!)
Why we want to do an experiment
The ocean & atmosphere dynamics course is really theoretical. It would be nice to add something practical! At least for me it really helps to raise motivation to buckle down and think about the theory if I have observed something and I learn theory in order to understand or manipulate what I observed rather than just for the sake of learning theory.
What I want students to get out of the activity
Yay, learning outcomes! I know, people hate it when I start talking about those, but I really think they are the best starting point. So here we go:
- Read (authentic) scientific literature, extract relevant information, apply it to an experiment and modify parameters accordingly
- Get an intuitive understanding of the behaviour of internal waves
- Explain qualitatively (and quantitatively?) how the speed of the boat and the phase velocity of internal waves relate to the drag on the boat
Why this experiment
- Internal wave experiments get complex very very quickly. This is a two-layer system that should be comparatively easy to both control (Ha! I wish…) and interpret (Ha!! Yes. I know…).
- This is a very nice historical example, too, going back to Nansen’s Fram expeditions. Nansen is a national hero in Norway, the Bjerknes Centre for Climate research which I am currently visiting is named after Bjerknes, who was involved in figuring this out. So lots of local references!
Setup of the experiment
Stratification
John Grue’s (2018) article “Calculating Fram’s Dead Water” uses the historical observations described by Nansen in “Farthest North” (1897) to quantify the conditions that led to Nansen’s observations: Nansen found a reduction of speed down to 1/5th of the expected speed, and Grue relates this to a density stratification, specifically a pycnocline depth. I’m using the Grue (2018) article as basis for our stratification in the tank, which we set up to best resemble the one the Fram experienced.
Layer depths
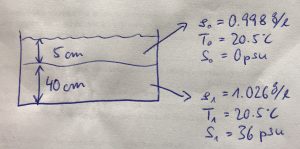
Grue describes a strong wave wake and force for a ratio of the ship’s draught (b0) to upper layer depth (h0) close to 1. For our model “Fram”, b0 is 5cm, which leads to an h0 of 5cm, too.
Grue used a ratio of h0/h1 of 1/18, which would lead to h1 of 90 cm. This is unfortunately not possible since our tank is only 50cm deep (of which the upper two cm cannot be used because of braces needed to stabilise the tank, and the water level needs to be another 3 or so cm lower because the ship will need to be able to pass below the braces. Hence our max h1 is approximately 40cm, leading to a ratio of h0/h1 of 1/8. No idea if this makes a difference? Something for students to discuss…
We could obviously also use a smaller model ship with half the drought and we’d be fine. Maybe we should do that just to figure out if it makes a difference.
Density stratification
To set up the density, we can manipulate both temperature and salinity of the water we are using.
For practical reasons, the temperature the water in our tank should be room temperature (so the tank can sit all set up, waiting for class, without equilibration with the room messing things up). Temperature in the teaching lab was T0=20.5°C when I checked this morning.
To minimize the amount of salt we need to use, we’ll use the freshest possible setup, with the upper layer having a salinity of S0=0g/l.
Grue describes a density difference between the layers of ρ0/ρ1 = 1/1.028. Using the density ρ0=0.998 g/l (calculated from T0 and S0 as above), this ratio leads to a density of ρ1=1.026g/l. For T1=T0=20.5°C, S0 thus needs to be 36g/l. (Phew! And seeing that I typically use 0 for “fresh” and 35 for “salty” anyway, this was a lot of thinking to come to pretty much the same result ;-))
How to move the boat
After just pulling it by hand in previous experiments (which was surprisingly difficult, because you need to pull veeery slowly, without jerking on the string), we’ve been thinking about different ways to move the boat.
First we thought we should program an Arduino to really slowly pull the ship through the tank, and use a dynamometer (you know, one of those spiral feathers that shows you how much force is applied by how far it stretches. Or the easy version, a rubber band) to figure out the drag of the ship.
But as I looked a little more into the experiment, and I found a really neat website by Mercier, Vasseur and Dauxois (2009) describing the experiment and the weight drop setup they used. They make the point that the dead water phenomenon is actually not about a constant speed evolution, it’s about applying a constant force and seeing how the boat reacts to that. Which I find convincing. That way we see the boat being slowed down and accelerating again, depending on its interactions with the internal waves it is creating which is a lot more interesting than seeing a feather or rubber band stretch and contract.
Mercier et al. have the boat strapped to a belt with constant tension on it, which they then force via a pulley system with a drop weight of a few milligrams (I think our friction might be higher then theirs was, so we might need a little more weight!).
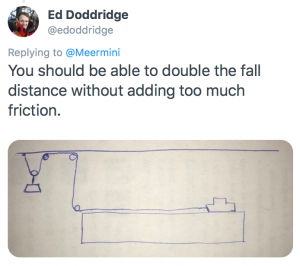
Only problem here (and I am not quite sure how big a problem this really is): We can only pull the boat for a distance as long as the ceiling in the basement is high, and that’s definitely nowhere near the length of our 6m tank. That seems a waste, but maybe a shorter distance is still enough to see all we want to see (and at least we won’t have reflections from the ends of the tank interfering if we pick the stretch in the middle of the tank)? Or is there an easy way to use pulleys or something to have the weight seem to fall deeper? Any ideas, anyone?
10.10.2018 — Edited to include this idea I got on Twitter. This is so obvious yet I didn’t think of it. Thanks a lot, Ed, I will definitely try that! Also, is anyone still doubting the usefulness of social media?
11.10.2018 — Edited: Wow, as a sailor it’s really embarrassing that people have to point me to all kinds of different pulley systems to get this problem done! Only two issues I have now: 1) What I’ve been ignoring so far but can’t ignore any longer: The weight of the rope will increase with the length of the rope, hence the force won’t be constant but increasing, too. Since we are expecting to be working with weights of the order of a couple of paper clips, even a thin yarn might contribute substantially to the total force. Will definitely have to weigh the yarn to figure out how large that effect is! 2) Since we are expecting such tiny weights to be enough, all the blocks needed in a pulley system are already way too heavy, so we’ll have to figure out some light weight fix for that!
Mercier et al. also used a magnet at the back of the ship and one outside the tank to release the boat, which is a neat idea. But, as they point out, one could also just release the ship by hand, which is what I think we’ll opt for.
What we could ask students to do
Figure out the experimental setup
We could ask them to do basically what I did above — figure out, based on the Grue (2018) article, how to run a tank experiment that is as similar as possible to the situation Nansen described having experienced on the Fram.
Discuss layer depths
In the setup I described above, our ration of layer depths is 1/8 instead of the 1/18 assumed in the Grue (2018) article. Does that actually make a difference? Why would it? Do we think the differences are large enough to warrant running the experiment with the 1/18 ratio, even though that means changing the stratification and getting a new boat?
Check on how close we are to theory
For the density stratification as described above, the relationship
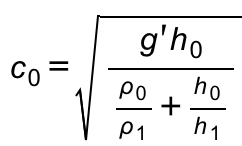
gives a phase velocity of the internal wave of c0=0.1m/s, meaning that it would take a wave crest 1min to cross our 6m long tank. We’ll see how that holds up when we do the experiment! And we could ask the students to do those calculations and compare them to the observations, too.
Compare dead water, deep water and shallow water cases
In their 2011 article, Mercier, Vasseur and Dauxois show the drag-speed relationships for dead water, deep water and shallow water (in Figure 1). The resistance will obviously be different for our setup since we’ll likely have a lot more friction, but qualitatively the curves should be similar. Might be fun to test! And also fun to interpret.
Even if we concentrate on the dead water case only (so we don’t have to empty and refill the tank), there is a lot to think about: Why is there a maximum in the resistance in the dead water case with both lower and higher speeds having a lower resistance? Probably related to how the ship interacts with the internal waves, but can we observe, for example, which Froude number that happens at, i.e. how fast the ship is moving relative to the phase velocity of the internal wave (which we both calculate and observe beforehand)?
Now it’s your turn!
What do you think? What’s your feedback on this? My plan is to go down to the lab tomorrow to figure out how to pull the boat with a drop weight. If you think that’s a really bad idea, now would be the time to tell me, and tell me what to do instead! :-)
Really, I welcome any feedback anyone might have for me! :-)
Fun notes that didn’t fit anywhere else
11.10.2018 — Edited: My former colleague Robinson pointed me to a research project he is involved in related to dredging the Elbe river (to make it possible for large container ships to reach the port of Hamburg) where they actually also look at how much ships are being slowed down, not by internal waves necessarily, but by the turbulence and turbidity they cause in the muddy river bed! That’s really cool! But the scaling is completely off from our experiment so their setup is unfortunately not transferable (they drag big objects with constant speed through the actual Elbe and measure the force that is needed).
Explaining Nansen’s “dead water” observation with an experiment – Elin Darelius & Team says:
[…] considerations for using this specific experiment in teaching are described here, including the learning outcomes we hope to achieve with the experiment. Students read original […]
Explaining Nansen’s “dead water” observation with an experiment – Elin Darelius & team's scientific adventures says:
[…] considerations for using this specific experiment in teaching are described here, including the learning outcomes we hope to achieve with the experiment. Students read original […]
Demonstration: Nansen’s “dead water” in a tank! | Mirjam S. Glessmer says:
[…] setup for this experiment is discussed here and is based on the super helpful website by Mercier, Vasseur and Dauxois (2009). In the end, we […]
Anton Korosov says:
Cool stuff!
Why don’t you use a small boat with a controlled propeller (or paddle wheels)? That would be even closer to reality ;)
How large is the tank and how large can be a boat? Would a boat with three AA batteries, micro-controller (pyboard) and two servos be small enough?
Mirjam says:
We are a little scared what a propeller would do to the stratification since we want to use it a lot more often than just once ;-) But you are right, that would be the closest to reality.
The tank is 6m long and 15cm wide and we have about 40cm of water on it.
We’ve run the experiment several times now and I am only sitting on the movies until we’ve shown it to a couple of people in real life. But it’s really fascinating, I’ll post movies as soon as I am allowed to! :-)
Joe Buchanan says:
I can think of two method for getting more horixontal distance from a limited drop distance. One is a z-drag set up. Hard to explain without a diagram but look at the wikipedia entry. Usually this is used to get a stronger force when pulling an object but reversed it means you can double the length of pull from a given height. The other way is to use a geared system – an old bike wheel would do if you have some bits and pieces lying around. Apply the force through a rope wrapped around the shaft of the wheel, but pull the boat from a rope around the perimeter of the wheel (take the tyre off). The distance around the perimeter will be much greater than the distance around the shaft. Actually you could probably just use an upside down bike, then you could change the speed with the gearing system.
Sounds like a great experiment – I wish I could be there.
Mirjam says:
Thanks, those are both really good ideas! I’ll try and report back :-) And you are of course welcome to visit any time ;-)