Tag Archives: ice

Dangers of blogging, or ice cubes melting in fresh water and salt water

When students have read blog posts of mine before doing experiments in class, it takes away a lot of the exploration.

Since I was planning to blog about the CMM31 course, I had told students that I often blogged about my teaching and asked for their consent to share their images and details from our course. So when I was recently trying to do my usual melting of ice cubes in fresh water and salt water experiment (that I dedicated a whole series on, details below this post), the unavoidable happened. I asked students what they thought – which one would melt faster, the ice cube in fresh water or in salt water. And not one, but two out of four student groups said that the ice cube in fresh water would melt faster.

Student groups conducting the experiment.

Since I couldn’t really ignore their answers, I asked what made them think that. And one of the students came out with the complete explanation, while another one said “because I read your blog”! Luckily the first student with the complete answer talked so quickly that none of the other – unprepared – students had a chance to understand what was going on, so we could run the experiment without her having given everything away. But I guess what I should learn from this is that I have taken enough pictures of students doing this particular experiment so that I can stop alerting them to the fact that they can oftentimes prepare for my lectures by reading up on what my favorite experiments are. But on the upside – how awesome is it that some of the students are motivated enough to dig through all my blog posts and to even read them carefully?

For posts on this experiment have a look a post 1 and 2 showing different variation of the experiment, post 3 discussing different didactical approaches and post 4 giving different contexts to use the experiment in.

Early stages of ice formation

Some photos to illustrate the early stages of ice formation.

When I was showing my ice formation pictures the other day (also in this post), I realized that even though I talk about ice forming needles first, I had never actually taken pictures of that. So when I went down to the fjord this morning to look at the ice that formed over night, I took a couple of pictures.

Firstly, this is what the fjord looks like right now:

IMG_5118

Isafjördur, one Saturday morning in September. You can see that there is ice in the foreground and open water starting somewhere behind the sailing boat moored in the fjord.

When you look more closely at the ice, you can see needle-like structures.

IMG_5129

The blue-and-yellow boat is aptly called “Frosty”.

IMG_5119

Closer look at the ice on the fjord – needle-like structures are visible.

Since there is not only ice on the fjord, but also on the ground, I decided that I did not feel like trying to get down to the ice/water to take better pictures of ice on the fjord. I am planning to go swimming later, but in a hot spring rather than in a cold fjord!

IMG_5154

Ice on a puddle outside the teacher’s apartment in Isafjördur – look at the needles!

On a puddle outside the teacher’s apartment in Isafjördur, I could take pictures of what I wanted to show with much less of a risk for my health. See the needle-like structures?

IMG_5149

Needle-like structures on a puddle in Isafjördur.

On another puddle I found ice that shows the needles even more clearly.

So why is it easier to show needles on puddles than on the fjord? Well, for one it is much easier to get close up and personal. And then it is also easier for larger needles to form on puddles – on the fjord there will always be some movement due to waves, so forming needles get broken apart and it is much more difficult for needles to form in the first place. However I see a blog post coming up where I demonstrate that in the freezer. But that will have to wait until I’m back home and can use my own freezer and equipment. Stay tuned!

Ice in the ocean – my historical photos

Ice formation in the ocean – using my own photos to tell the story.

Recently I talked about using my own photo to explain the generation of wind-generated waves to students. And then I realized that there is another set of photos that I have been using for teaching purposes for years that I could share here, too. Those are photos that I took on my very first “real” (as in “not a student, but participating in real research”) cruise back in 2003. In a time when pictures were still analog and you could take 36 pictures and then you had to change to a new film if you had planned ahead and brought one. I think I brought 6 films on the one-month cruise. It seemed excessive at the time, and today I easily take that amount of pictures in a day, especially when at sea and in the ice.

Anyway, let’s talk about the ice.

Newly forming  ice in the front, older ice in the back.

In the picture above you see several different kinds of ice: Older ice that looks like what you would imagine ice to look like in the back towards the horizon, and newly forming ice between the old ice and the ship. The ice has only just started freezing and forms a slush at the ocean’s surface that dampens out wave movement. In places, pancake ice is starting to form.

Pancake ice.

Pancake ice are almost round pieces of ice that are formed when slush freezes together. Since there is still some wave action in the water, the little ice plates bump into each other, forming a little puffy rim. Pancakes typically have a sizes ranging from the palm of your hand to maybe half a meter.

Several of the pancakes frozen together to form larger ice floes.

If the sea state isn’t too rough and the cooling continues, several of the pancakes freeze together to form larger ice floes.

Pancakes frozen together to form a closed surface.

Eventually, pancakes freeze together to form a closed surface.

Sea ice cover, additionally covered in snow.

If cooling persists, the sea ice cover thickens gradually, and snow falls on the surface.

I was so lucky to see all of these different stages of ice on my very first research cruise! And I was even luckier – in this year’s GEOF332 “field course in oceanography”, I got to show pancake ice to my students, in Hardanger fjord in February! Granted, the pancakes were really thin and we never got to see a closed sea ice cover, but what an awesome first day for a student cruise!

The Hardanger fjord covered in pancake ice on February 1st, 2013.

A fetching title for a fetching photo post

Using a photo from one of my research cruises to explain the formation of wind waves.

Wind waves are (surprise coming up!) waves generated by wind that blows over the ocean’s surface. The size of those waves depends on several factors: The strength of the wind, the length of time the wind has been blowing over the ocean, and  the fetch (hence the “fetching” title of this post).

The bow of the RRS James Clark Ross and wind-generated waves in front of it. Note how the wind direction is indicated by the wind vane, and how parts of the ocean are sheltered by the ice floes.

The image above is really useful to talk about this concept. We see the wind direction indicated by the wind vane at the bow of the RRS James Clark Ross. In the lee of the ice floes, the water surface is smooth because it is sheltered from the wind. As the distance from the ice flow, and hence the fetch, increases, waves start forming again. In addition to the formation of waves, you can see how waves are refracted around the ice floe.

I like teaching using photos that I took myself. Not only do they show exactly what I want to talk about, but they also give me the opportunity to share stories, like in this case of how I took that photo when we were first approaching the ice edge in the Greenland Sea and then the next day there was ice everywhere and we saw polar bears. Not only are students entertained and fascinated hearing personal stories of experiences at sea, I think that those stories are also important for helping students form their self-image as an oceanographer, and for motivating them to stick it out through the tougher spots of their studies. Stories also help students remember content, and story telling is a very useful method in the classroom (but more about that in another post).

On the structure of fresh water and salt water ice

More details on the structure of fresh water and salt water ice.

Fresh water and salt water ice have very different structures as I already discussed in this post.

Fresh water ice (on the left) and salt water ice (on the right).

In the image above you see that the structures are very different. Whereas fresh water ice is clear and transparent, salt water ice has a porous structure and is milky.

Investigating fresh water and salt water ice cubes in class. Already in this photo the difference is clearly visible, and it is even more obvious when you pick up the cups and look at the ice cubes from the side.

The pores can be made visible by dropping dye on the ice cubes, as we did in class on Tuesday. For salt water ice, dye penetrates into the ice cube along the brine channels; the ice cube seems to be soaking up the dye like a sponge and becomes colored through and through. In case of the fresh water ice, dye cannot penetrate because the crystal structure is so regular and tight, and the dye just comes off the ice.

Melting ice cubes – one experiment, many ways (post 3/4)

Different didactical settings in which the “ice cubes melting in fresh and salt water” experiment can be used.

In part 1 and 2 of this series, I showed two different ways of using the “ice cubes melting in fresh water and salt water” experiment in lectures. Today I want to back up a little bit and discuss reasons for choosing one over the other version in different contexts.

Depending on the purpose, there are several ways of framing this experiment. This is very nicely discussed in materials from the Lawrence Hall of Science (link here), too, even though my discussion is a little different from theirs.

1) A demonstration.

If you want to show this experiment rather than having students conduct it themselves, using colored ice cubes is the way to go (see experiment here). The dye focuses the observer’s attention on the melt water and makes it much easier to observe the experiment from a distance, on a screen or via a projector. Dying the ice cubes makes understanding much easier, but it also diminishes the feeling of exploration a lot – there is no mystery involved any more.

Demonstration of melting ice cubes. The melt water is clearly marked by the dye. This makes it a good demonstration, but diminishes the satisfying feeling of discovery by the observer, because the processes are clearly visible right away rather than having to be explored.

2) A structured activity.

Students are handed (non-colored) ice cubes, cups with salt water and fresh water and are asked to make a prediction about which of the ice cubes is going to melt faster. Students test their hypothesis, find the results of the experiment in support with it or not, and we discuss. This is how I usually use this experiment in class (see discussion here).

The advantage of using this approach is that students have clear instructions that they can easily follow. Depending on how observant the group is, instructions can be very detailed (“Start the stop watch when you put the ice cubes in the water. Write down the time when the first ice cube has melted completely, and which of the ice cubes it was. Write down the time when the second ice cube has melted completely. …”) or more open (“observe the ice cubes melting”).

3) A problem-solving exercise.

In this case, students are given the materials, but they are not told which of the cups contains fresh or salt water (and they are instructed not to taste). Now students are asked to design an experiment to figure out which cup contains what.

This is a very nice exercise and students learn a lot from designing the experiment themselves. However, this also takes a very long time, more than I can usually afford to spend on experiments in class. After all, I am doing at least one hands-on activity in each of the lectures, but am still covering the same content from the text book as previous lecturers who used their 180 minutes per week just lecturing. And I am considering completely flipping my class room, but I am not there yet.

4) An open-ended investigation.

In this case, students are handed the materials, knowing which cup contains fresh and salt water. But instead of being asked a specific question, they are told to use the materials to learn as much as they can about salt water, fresh water, temperature and density.

As with the problem-solving exercise, this is a very time-intensive undertaking that does not seem feasible in the framework we are operating in. Also it is hard to predict what kind of experiments the students will come up with, and if they will learn what you want them to learn. On the other hand, students typically learn much more because they are free to explore and not bound by a specific instruction from you.

Properties of sea ice and fresh water ice

Sea ice and fresh water ice have distinctly different properties that can easily be investigated even in big class rooms.

In “on how ice freezes from salt water” I talked a bit about how dye was rejected when I tried to produce colored ice cubes for another experiment. But even non-colored ice that were made out of fresh water or salt water shows distinctly different structures.

Ice formed from fresh water (on the left) and salt water (on the right). Note the small pores in the salt water ice cube – those are the channels that form when brine is rejected.

On the left, you see that the surface is very smooth apart from a couple of cracks. The red food dye that was dripped on the ice cube comes right off, like water off a duck’s back. On the right, the food coloring is not rolling off, instead it is creeping into all the little brine channels, hence nicely showing a web of pores all throughout the ice cube.

I first saw this experiment when Angelika Renner from the Norwegian Polar Institute in Tromsø visited my GEOF130 class last year. She says that she got the idea from the APECS book [link*], that, btw, provides many great ideas for outreach projects.

* I’m not affiliated, nor do I get money for recommending this book. It’s just a great resource that I think everybody should be aware of!

[edit 11.9.2013: new post on the same topic here: http://mirjamglessmer.com/2013/09/11/on-the-structure-of-fresh-water-and-salt-water-ice/]

Ice cubes melting in fresh water and salt water (post 2/4)

The “ice cubes melting in fresh water and salt water” experiment the way I usually use it in class.

— Edit — For an updated description of this experiment please go to this page! — Edit —

You might remember the “ice cubes melting in fresh water and salt water experiment” from a couple of days ago. Today we are going to talk about it again, but with a little twist on it. See, when I showed you the experiment the other day, I used dyed ice cubes, so the melt water was colored and it was easy to track. Doing that, I focussed you attention on the melt water. This is not how we do it in class.

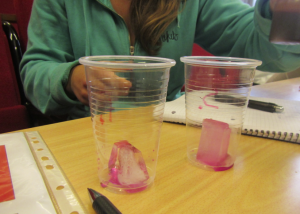
In class, students get clear ice cubes, and before they put them in the cups, I ask them to make a prediction. Which of the ice cubes will melt faster, the one in fresh water or the one in salt water? Everybody has to make a prediction. And having run this experiment with 100+ people by now, I can tell you: Approximately 5% predict the right outcome. And that is not 5% of the general population [edit: this used to say “5% of the general circulation”!], that is 5% of people who were either attending my class or a workshop on oceanography with me, who were attending a workshop on teaching oceanography, or my nerdy friends. So don’t be sad if you get it wrong – you are in good company.

So now that everybody has made a prediction, the ice cubes go into the cups with fresh water and salt water. In the beginning, the excitement is usually moderate. After all, you are staring at a plastic cup with an ice cube floating in it. But then, after the first minute or so, there is no denying any more: The ice cubes have started melting. And one of them is melting a lot faster than the other one. The one in fresh water is melting a lot faster than the one in salt water! How can this be? At this point, students typically start secretly (because remember – no tasting in the lab!) tasting the water in the cups to make sure that they didn’t actually swap the cups. After all, it should be the ice cube in the salt water melting faster, shouldn’t it?

But no, it is true: The ice cube in fresh water is melting faster than the one in salt water. But how??? Enter food coloring.

MVI_9248

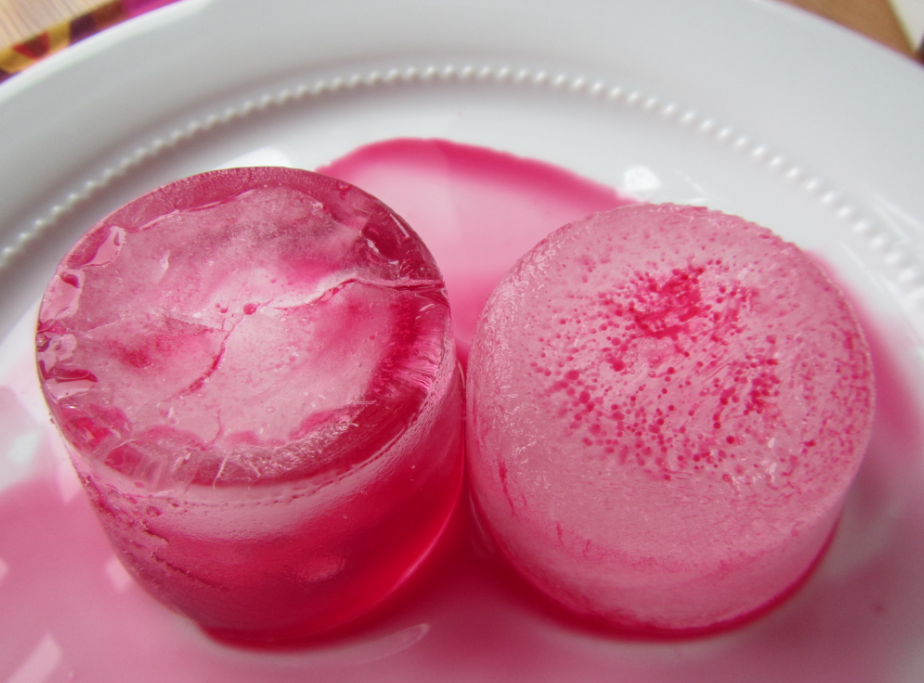
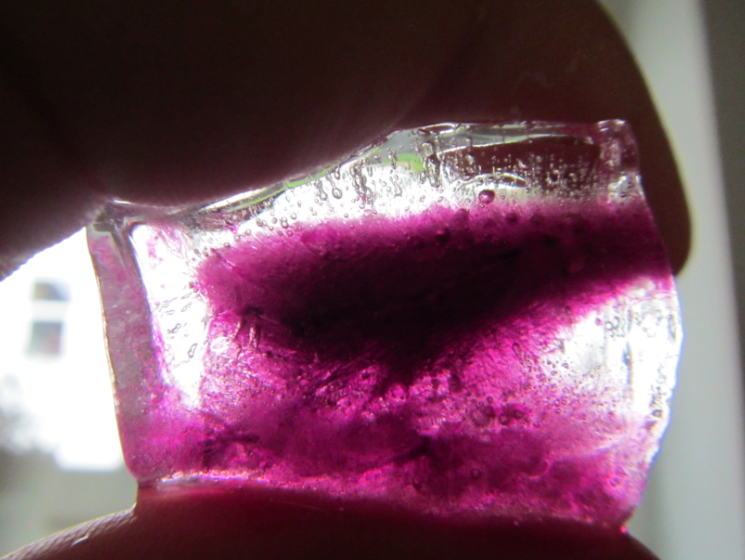
Dyed ice cubes melting in fresh water (left) and salt water (right). Edited on Sept. 14th, 2014. Since this seems to be the most popular post on this blog I thought people might appreciate a better picture… And if you are really curious go check out the newer posts on the topic, a lot has happened over the last year!

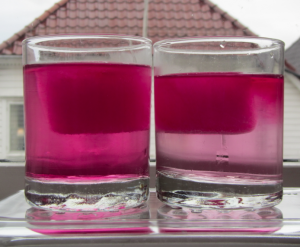
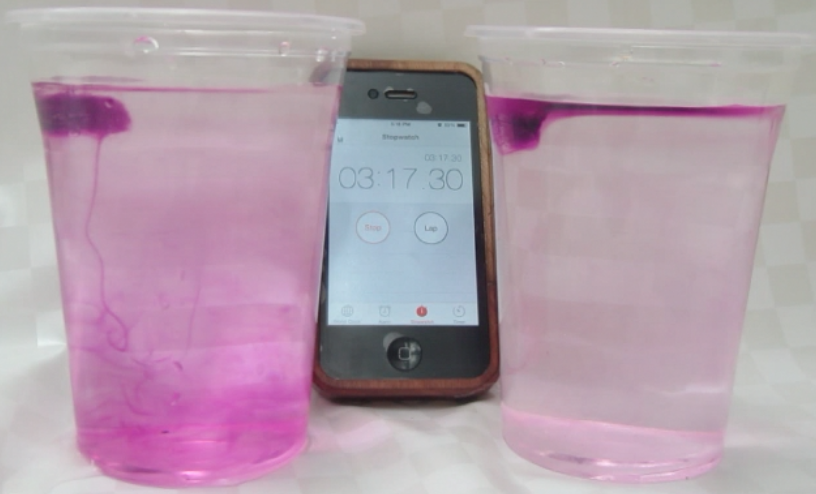
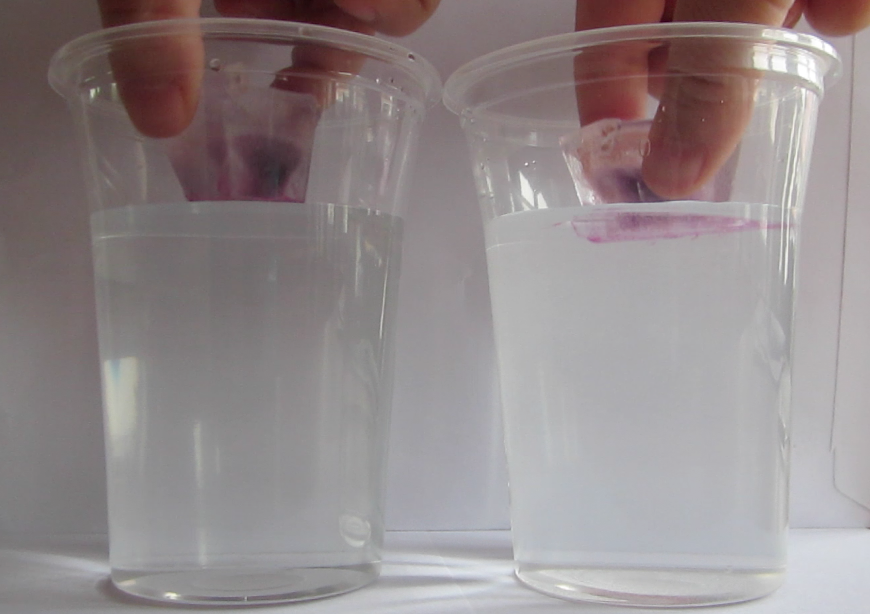
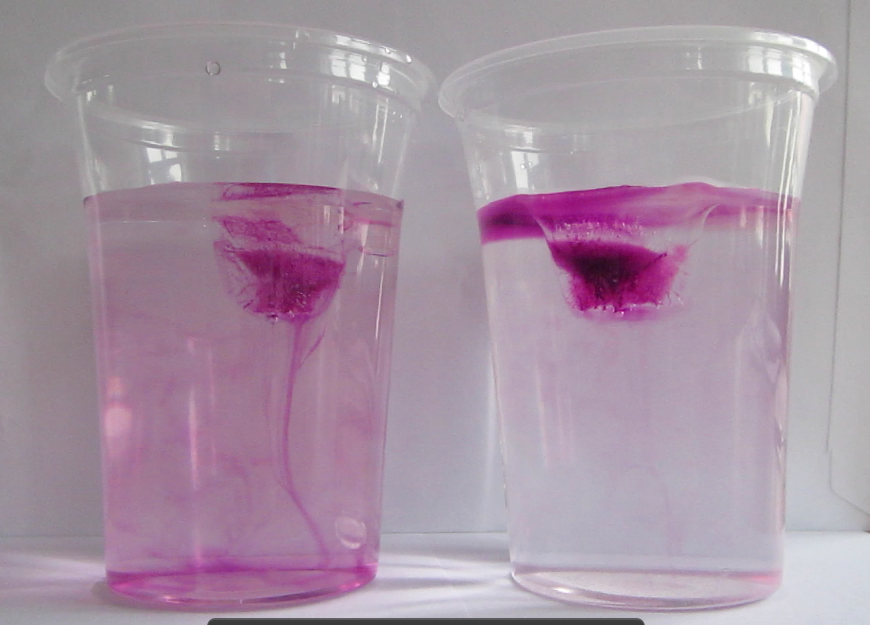
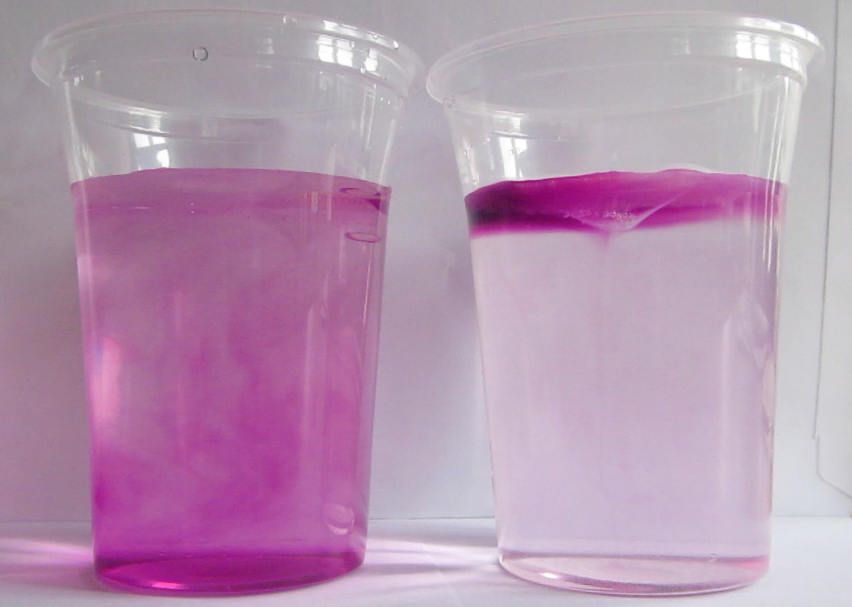
Glasses filled with fresh water and salt water, and one ice cube in each. Drops of food dye have been added on the ice cubes to visualize the circulation. The left glass is homogeneously pink, whereas the right glass has a pink layer on top and only little pink below that layer.

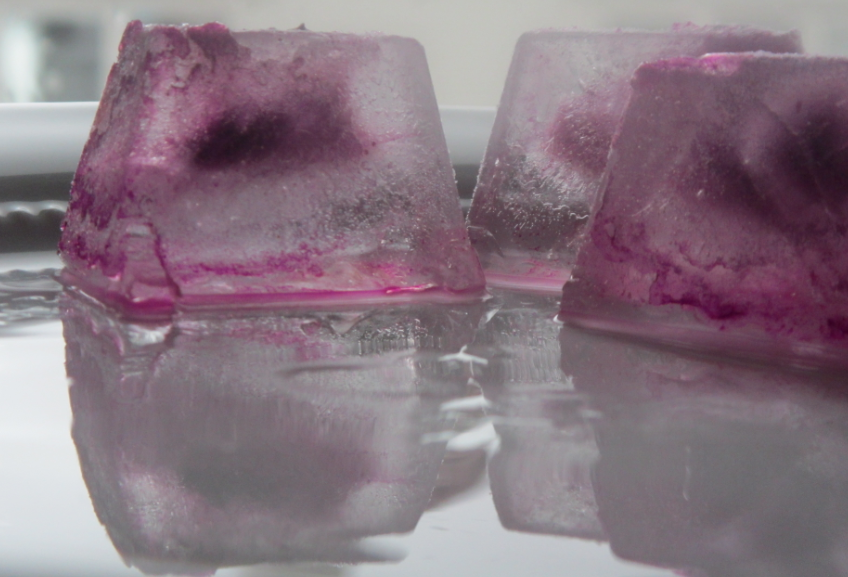
If at this stage one or two drops of food coloring are dripped on the ice cubes, this dye helps visualize the circulation similarly to the dyed melt water I showed you the other day [which, incidentally, one of the student groups yesterday observed without food dye or me prompting. Great job!].

And now the whole thing makes much more sense: In the fresh water case, melt water is denser than the water in the cup and sinks to the bottom of the cup. As it is sinking away from the ice cube, it is being replaced with warmer water from the cup. Hence the ice cube is always floating in relatively warm water which helps it melt.

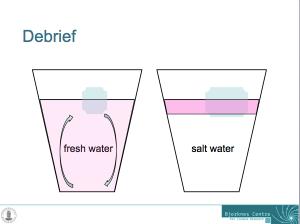
Sketch showing the explanation for why the ice cubes melt faster in fresh water than in salt water.

In salt water, on the other hand, the melt water forms a layer on top of the water in the cup. Even though it is very cold, it is still less dense than the salty water in the cup. The ice cube is more and more surrounded by its own melt water and not by the warmer water in the cup as was the ice cube in the fresh water. Therefore, the ice cube in the fresh water is melting faster than the one in salt water!

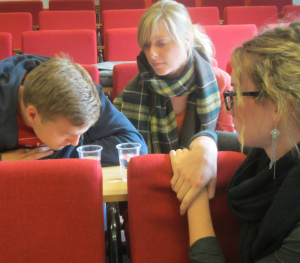
The experiment run in the lecture theater.

This experiment is easy to run in all kinds of settings. However it helps if the student groups are spaced out enough so that the instructor can reach all of the groups and listen in on the conversations to get a feel of how close to a solution the students are, or chat to the students to help them figure it out.

There will be two follow-up posts to this one: One about different didactical settings, and one different contexts this experiment can be used in.

On how ice freezes from salt water

I’ve been wondering how to best show how sea ice freezes for quite a while. Not just that it freezes, but how brine is rejected. By comparing the structure of fresh water and salt water ice, one can get an idea of how that is happening (and I’ll write a post on that after we have done this experiment in class). But I accidentally stumbled upon a great visualization when preparing dyed ice cubes for the melting ice cube experiment (see this post) when all my ice cubes came out like this:

Ice cubes made from colored water.

Instead of being nicely homogeneously colored, the color had concentrated in the middle of the ice cubes! And since the dye acts in similar ways to salt in the ocean (after all, it IS a salt dissolved in water, even though not the same as in sea water), this is a great analogy. It is even more visible when the ice cubes have started to melt and the surface has become smooth:

The dye has frozen out of most of the ice and been concentrated in the middle of the ice cube.

Clearly, when forming, the ice crystals have been rejecting the dye! In the ocean, due to cooling happening from above, ice would freeze downward from the surface, under the influence of gravity the brine channels would be vertical, and brine would be released in the water underneath. In my freezer, however, cooling is happening from all sides at once. There is a tendency for the dye to be rejected towards the bottom of the ice cube tray under gravity, but as ice starts forming from all sides, the dye becomes trapped and concentrated in the middle of the forming ice cube. Can you see the little brine channel leading to the blob of color in the middle?

I must say, when I first took the ice cubes out of the freezer I was pretty annoyed because they weren’t homogeneously colored. But now I appreciate the beauty of the structure in the ice, and you can bet I’ll try this again with bigger ice cubes!

Ice cubes melting in salt water and freshwater (post 1/4)

Experiment to visualize the effects of density differences on ocean circulation.

This is the first post in a series on one of my favorite in-class experiments; I have so much to say about it that we’ll have to break it up into several posts.

Post 1 (this post) will present one setup of the experiment, but no explanations yet.

Post 2 will present how I use this experiment in GEOF130, including explanations.

Post 3 will discuss how this experiment can be used in many different setups  and

Post 4 will discuss different purposes this experiment can be used in (seriously – you can use it for anything! almost…).

So, let’s get to the experiment. First, ice cubes are inserted into two cups, one filled with fresh water at room temperature, the other one filled with salt water at room temperature. In this case, the ice cubes are dyed with food coloring and you will quickly see why:

Ice cubes are added to cups filled with water at room temperature: fresh water on the left, salt water on the right.

As the ice cubes start to melt, we can see the dyed melt water behaving very differently in fresh water and salt water. In fresh water, it quickly sinks to the bottom of the cup, whereas in salt water it forms a layer at the surface.

Melt water from the ice cube is sinking towards the bottom in the cup containing fresh water (on the left), but it is staying near the surface in the cup containing salt water (on the right).

After approximately 10 minutes, the ice cube in freshwater has melted completely, whereas in salt water there are still remains of the ice cube.

After 10 minutes, the ice cube in the fresh water cup has melted completely (left), whereas the one in the salt water cup is not gone completely yet (right).

Why should one of the ice cubes melt so much faster than the other one, even though both cups contained water at the same (room) temperature? Many of you will know the answer to this, and others will be able to deduce it from the different colors of the water in the cups, but the rest of you will have to wait for an explanation until the next post on this topic – we will be doing this experiment in class on Tuesday and I can’t spoil the fun for the students by posting the answer today already! But if you want to watch a movie of the whole experiment: Here it is!

(Yes, this really is how I spend my rainy Sunday mornings, and I love it!)

– I first saw this experiment at the 2012 Ocean Sciences meeting when Bob Chen of COSEE introduced it in a workshop “understanding how people learn”. COSEE has several instructions for this experiment online, for example here and here. My take on it in the “on the Cutting Edge – Professional Development for Geoscience Faculty” collection here.