Tag Archives: GEOF130

Ice in the ocean – my historical photos

Ice formation in the ocean – using my own photos to tell the story.

Recently I talked about using my own photo to explain the generation of wind-generated waves to students. And then I realized that there is another set of photos that I have been using for teaching purposes for years that I could share here, too. Those are photos that I took on my very first “real” (as in “not a student, but participating in real research”) cruise back in 2003. In a time when pictures were still analog and you could take 36 pictures and then you had to change to a new film if you had planned ahead and brought one. I think I brought 6 films on the one-month cruise. It seemed excessive at the time, and today I easily take that amount of pictures in a day, especially when at sea and in the ice.

Anyway, let’s talk about the ice.

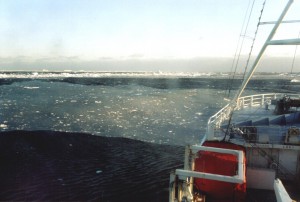
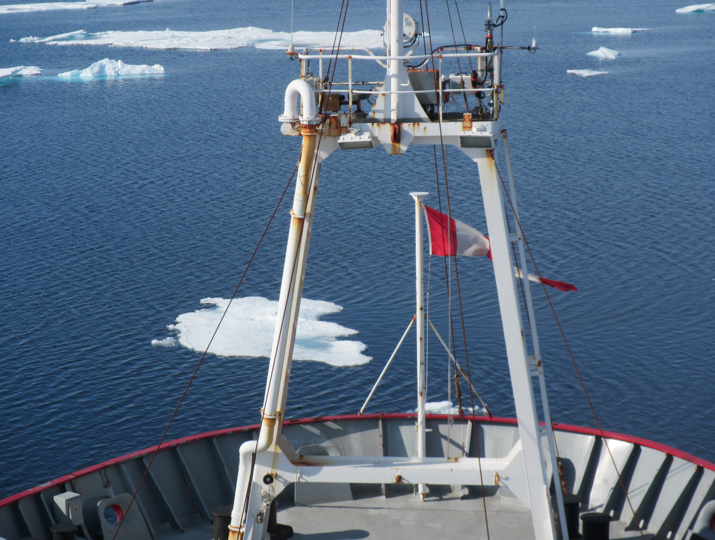
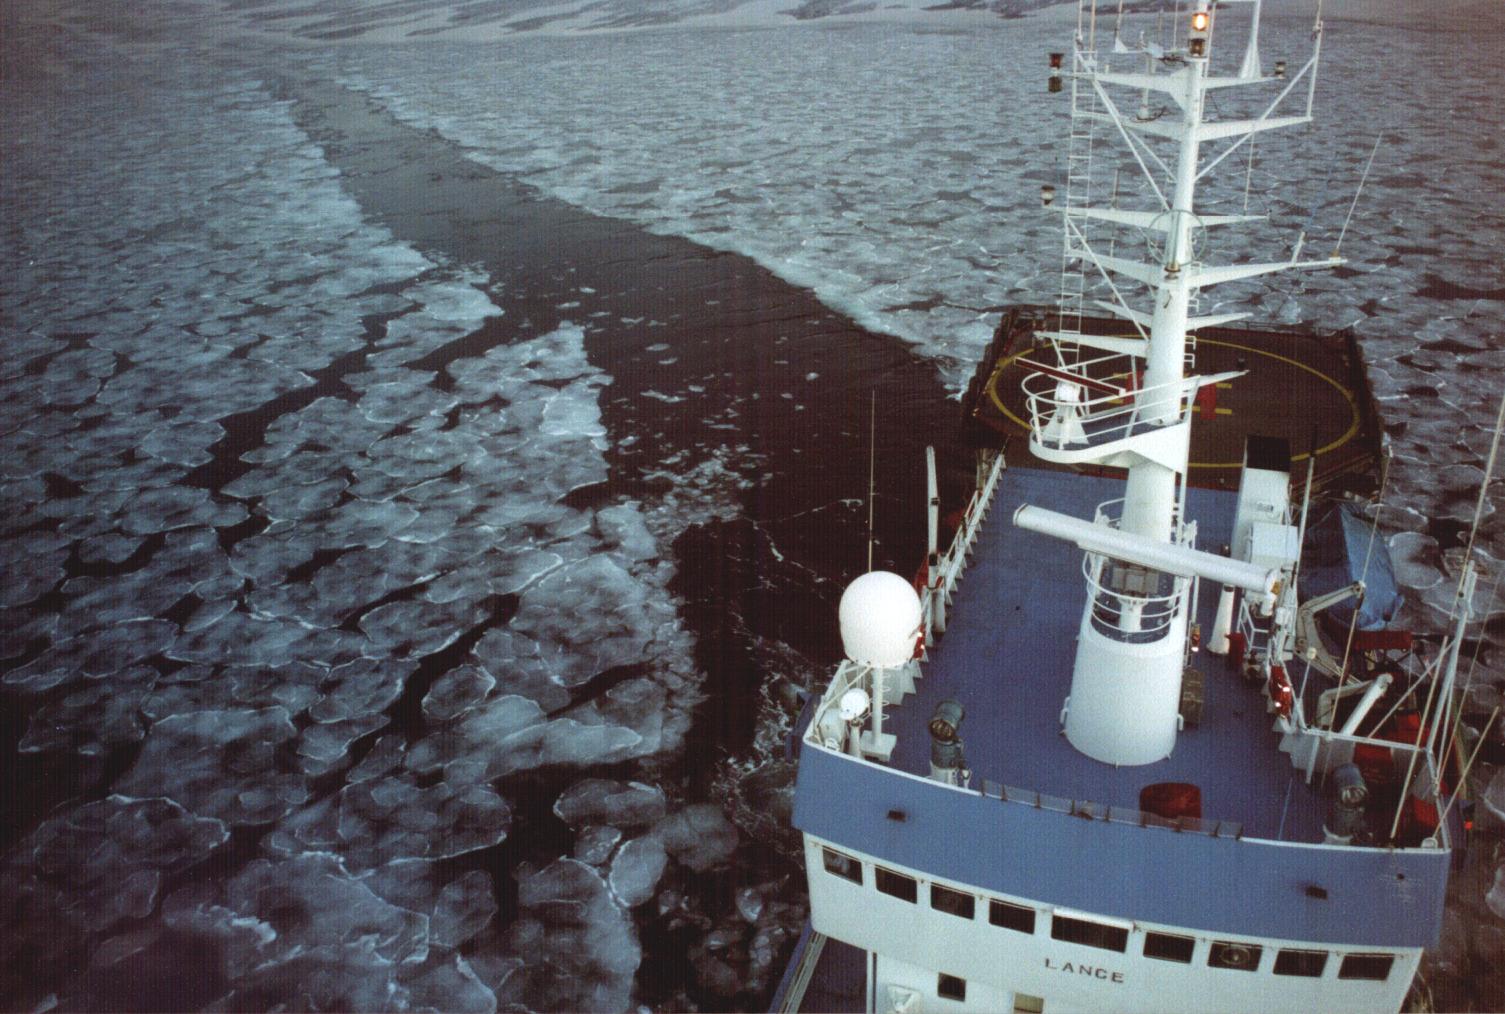
Newly forming  ice in the front, older ice in the back.

In the picture above you see several different kinds of ice: Older ice that looks like what you would imagine ice to look like in the back towards the horizon, and newly forming ice between the old ice and the ship. The ice has only just started freezing and forms a slush at the ocean’s surface that dampens out wave movement. In places, pancake ice is starting to form.
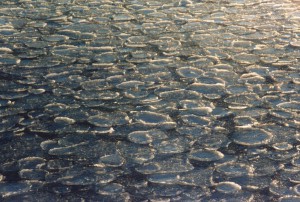
Pancake ice.

Pancake ice are almost round pieces of ice that are formed when slush freezes together. Since there is still some wave action in the water, the little ice plates bump into each other, forming a little puffy rim. Pancakes typically have a sizes ranging from the palm of your hand to maybe half a meter.

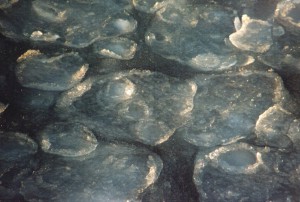
Several of the pancakes frozen together to form larger ice floes.

If the sea state isn’t too rough and the cooling continues, several of the pancakes freeze together to form larger ice floes.

Pancakes frozen together to form a closed surface.

Eventually, pancakes freeze together to form a closed surface.

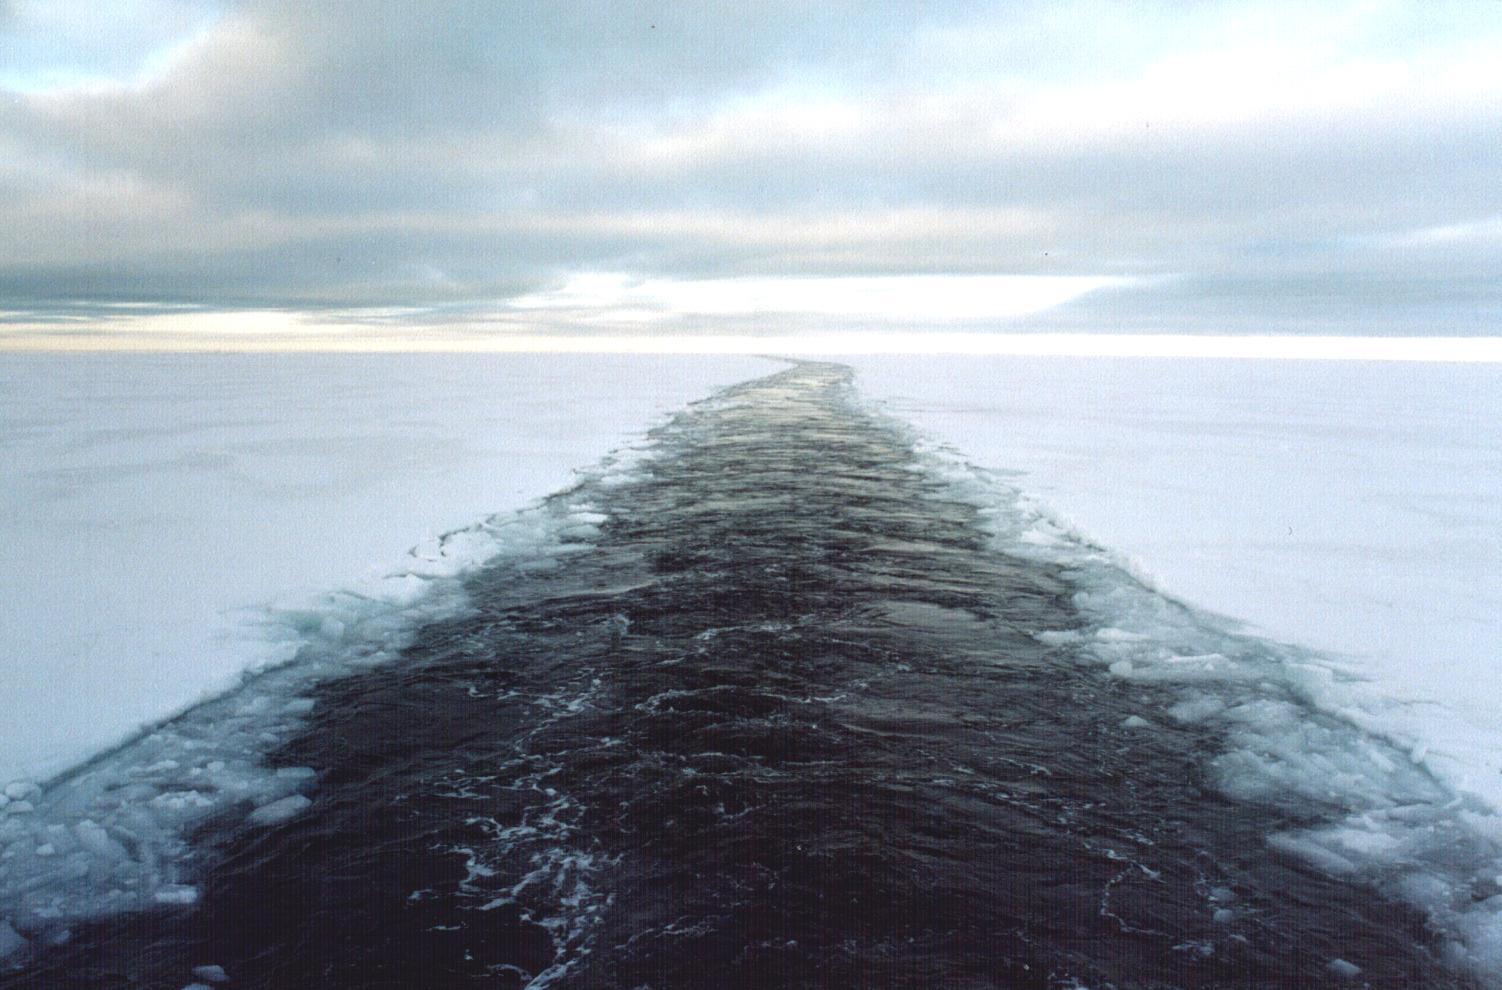
Sea ice cover, additionally covered in snow.

If cooling persists, the sea ice cover thickens gradually, and snow falls on the surface.

I was so lucky to see all of these different stages of ice on my very first research cruise! And I was even luckier – in this year’s GEOF332 “field course in oceanography”, I got to show pancake ice to my students, in Hardanger fjord in February! Granted, the pancakes were really thin and we never got to see a closed sea ice cover, but what an awesome first day for a student cruise!

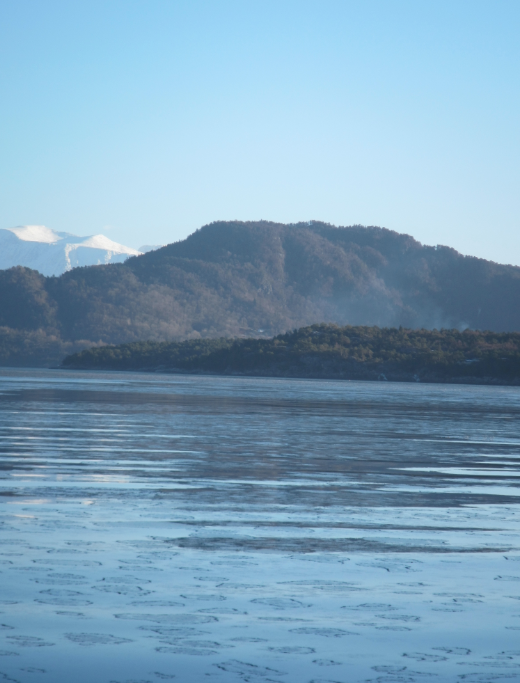
The Hardanger fjord covered in pancake ice on February 1st, 2013.

A fetching title for a fetching photo post

Using a photo from one of my research cruises to explain the formation of wind waves.

Wind waves are (surprise coming up!) waves generated by wind that blows over the ocean’s surface. The size of those waves depends on several factors: The strength of the wind, the length of time the wind has been blowing over the ocean, and  the fetch (hence the “fetching” title of this post).

The bow of the RRS James Clark Ross and wind-generated waves in front of it. Note how the wind direction is indicated by the wind vane, and how parts of the ocean are sheltered by the ice floes.

The image above is really useful to talk about this concept. We see the wind direction indicated by the wind vane at the bow of the RRS James Clark Ross. In the lee of the ice floes, the water surface is smooth because it is sheltered from the wind. As the distance from the ice flow, and hence the fetch, increases, waves start forming again. In addition to the formation of waves, you can see how waves are refracted around the ice floe.

I like teaching using photos that I took myself. Not only do they show exactly what I want to talk about, but they also give me the opportunity to share stories, like in this case of how I took that photo when we were first approaching the ice edge in the Greenland Sea and then the next day there was ice everywhere and we saw polar bears. Not only are students entertained and fascinated hearing personal stories of experiences at sea, I think that those stories are also important for helping students form their self-image as an oceanographer, and for motivating them to stick it out through the tougher spots of their studies. Stories also help students remember content, and story telling is a very useful method in the classroom (but more about that in another post).

A simple DIY tidal model

Instruction for a very simple DIY tidal model.

Today, we built a very simple DIY tidal model in class. It consists of two sets of tidal bulges: One locked in place relative to the sun on the piece of cardboard that we use as the base, the other one with its very own little moon on a transparency mounted on top. Both sets of tidal bulges are held in place by a split pin and a model earth. Now the sun and moon can be arranged all in one line, or at a 90 degree angle towards each other, or anything in between, and the tidal bulges can be mentally added up. If all goes well, this helps students understand the reasons for the existence of spring and neap tides (and from the feedback I’m getting, everything did go well).

The tidal model. Upper plots: Different constellations of the earth-moon-sun system. Lower plot: the model “in action”.

It is also a great way of introducing the difficulties of tidal prediction on earth. In the model, the whole earth is covered with water, so tidal bulges are always directly “underneath” the sun and the moon, respectively. On Earth, this is hindered by the existence of continents and by friction, among others. Since the little earth in the DIY model has continents on it, this really helps with the discussion of delay in tides, tides being restricted to ocean basins, amphidromic points, declination of the earth etc.. And last not least – these are only two tidal components out of the 56 or so that tidal models use these days. As I said – a _very_ _simple_ DIY tidal model!

Find a printable pdf here (and now the solar tidal bulge is a lot smaller than the one in the picture above for a more realistic model)

On the structure of fresh water and salt water ice

More details on the structure of fresh water and salt water ice.

Fresh water and salt water ice have very different structures as I already discussed in this post.

Fresh water ice (on the left) and salt water ice (on the right).

In the image above you see that the structures are very different. Whereas fresh water ice is clear and transparent, salt water ice has a porous structure and is milky.

Investigating fresh water and salt water ice cubes in class. Already in this photo the difference is clearly visible, and it is even more obvious when you pick up the cups and look at the ice cubes from the side.

The pores can be made visible by dropping dye on the ice cubes, as we did in class on Tuesday. For salt water ice, dye penetrates into the ice cube along the brine channels; the ice cube seems to be soaking up the dye like a sponge and becomes colored through and through. In case of the fresh water ice, dye cannot penetrate because the crystal structure is so regular and tight, and the dye just comes off the ice.

Introducing voting cards (post 3/3)

How do you introduce voting cards as a new method in a way that minimizes student resistance?

As all new methods, voting cards (see post on the method here, and on what kind of questions to ask here) first seem scary. After all, students don’t know what will happen if they happen to chose the wrong answer. Will they be called out on it by the instructor? Will everybody point at them and laugh? And even if they chose the correct answer, will the instructor make them explain why they chose that answer?

Some of my students in a staged photo. They are showing their favorite color to demonstrate the method for you. Thanks for posing for me!

When I introduce voting cards to a new group of students, I make sure to talk through all issues before actually using the cards. It is important to reassure the students that wrong answers will not be pointed out publicly, for example. It helps to use a very simple question that does not have right or wrong answers (“Which of these four colors is your favorite? Show me the one you like best!”) for the very first vote, so students get to experience the process without there being anything at stake. While showing their favorite color, they see that they cannot actually see their neighbors’ choices without making it very obvious (at least not in the classical lecture theatre setting that we are in, but even in other settings it is difficult). Hence their peers cannot actually see their own choice, either, without again making it very obvious.

In the picture above, students are very happy to show their votes to everybody – after all, there is no wrong answer and I asked them to pose. But this is what it typically looks like after students have gotten used to the method. During the first classes, voting usually looks more like this: Very close to the chest, held with both hands, shielding it from the neighbors.

During the first classes, voting usually looks like pictured above: Very close to the chest, held with both hands, shielding it from the neighbors.

Still there is probably going to be some resistance about committing to one answer because, after all, the instructor will still see it. But in my experience this can be overcome when the reasons for choosing the method are made sufficiently clear – that it benefits them to commit to one answer, because making thought processes explicit helps their learning. That it helps me, because I get a better feel of whether everybody understood a concept or only just the two vocal students, and whether I need to go into more detail with a concept or not. That it is a great basis for discussions.

Photo of an actual vote. In fact of the first vote after I asked them to pose for a staged photo (the one shown above). This question was clearly too easy!

After a couple of classes, voting cards are not even needed any more (although it can’t hurt to hand them out – it feels like less pressure if you could fall back on holding something up rather than speaking in public); discussion starts without having to be initiated through a voting process and subsequent questions for clarification. Also if they chose to still vote, students get much more daring in the way they hold up the cards – they stop caring about whether their peers can see what they voted for. So all in all a great technique to engage students.

Melting ice cubes – one experiment, many ways (post 3/4)

Different didactical settings in which the “ice cubes melting in fresh and salt water” experiment can be used.

In part 1 and 2 of this series, I showed two different ways of using the “ice cubes melting in fresh water and salt water” experiment in lectures. Today I want to back up a little bit and discuss reasons for choosing one over the other version in different contexts.

Depending on the purpose, there are several ways of framing this experiment. This is very nicely discussed in materials from the Lawrence Hall of Science (link here), too, even though my discussion is a little different from theirs.

1) A demonstration.

If you want to show this experiment rather than having students conduct it themselves, using colored ice cubes is the way to go (see experiment here). The dye focuses the observer’s attention on the melt water and makes it much easier to observe the experiment from a distance, on a screen or via a projector. Dying the ice cubes makes understanding much easier, but it also diminishes the feeling of exploration a lot – there is no mystery involved any more.

Demonstration of melting ice cubes. The melt water is clearly marked by the dye. This makes it a good demonstration, but diminishes the satisfying feeling of discovery by the observer, because the processes are clearly visible right away rather than having to be explored.

2) A structured activity.

Students are handed (non-colored) ice cubes, cups with salt water and fresh water and are asked to make a prediction about which of the ice cubes is going to melt faster. Students test their hypothesis, find the results of the experiment in support with it or not, and we discuss. This is how I usually use this experiment in class (see discussion here).

The advantage of using this approach is that students have clear instructions that they can easily follow. Depending on how observant the group is, instructions can be very detailed (“Start the stop watch when you put the ice cubes in the water. Write down the time when the first ice cube has melted completely, and which of the ice cubes it was. Write down the time when the second ice cube has melted completely. …”) or more open (“observe the ice cubes melting”).

3) A problem-solving exercise.

In this case, students are given the materials, but they are not told which of the cups contains fresh or salt water (and they are instructed not to taste). Now students are asked to design an experiment to figure out which cup contains what.

This is a very nice exercise and students learn a lot from designing the experiment themselves. However, this also takes a very long time, more than I can usually afford to spend on experiments in class. After all, I am doing at least one hands-on activity in each of the lectures, but am still covering the same content from the text book as previous lecturers who used their 180 minutes per week just lecturing. And I am considering completely flipping my class room, but I am not there yet.

4) An open-ended investigation.

In this case, students are handed the materials, knowing which cup contains fresh and salt water. But instead of being asked a specific question, they are told to use the materials to learn as much as they can about salt water, fresh water, temperature and density.

As with the problem-solving exercise, this is a very time-intensive undertaking that does not seem feasible in the framework we are operating in. Also it is hard to predict what kind of experiments the students will come up with, and if they will learn what you want them to learn. On the other hand, students typically learn much more because they are free to explore and not bound by a specific instruction from you.

How much salt is there in sea water?

Visualization of how much salt is actually contained in sea water.

When preparing “sea water samples” for class, it is always astonishing to me how much salt I have to add for normal open-ocean salinities. Time and time again it looks like it should be way too much, but then when tasting it, it tastes salty, but like the ocean and not like brine.

A teaspoon full of salt corresponds to approximately 5 grams. That means that for typical open-ocean salinities, you have to add 7 teaspoons full of salt to a liter of water.

Since it is still astonishing to us, Pierre and I thought, it would probably be a good thing to show to our students. 0.18 teaspoon full of salt corresponds to only 1 gram of salt (averaged over several non-scientific internet sources, but well within the measurement error of my kitchen scales [and yes, I know the trick of measuring the weight of several spoons and then dividing by the number, but thanks!]).

What I want to do in the lecture is have the students estimate how much salt they need for a 35 psu liter of water. And not estimate by weighing (because I want each of the students to be able to touch the salt, but at the same time don’t want salt all over the lecture theatre), but visually estimate.

10 grams of salt in a little plastic jar.

The little jar in the picture above contains 10 grams of salt. So in order to have students estimate how much salt they would need for a liter of 35psu water, we filled 12 of those little jars with 10 grams each and handed them to the students. Obviously we didn’t tell the students how much salt was contained in a jar!

12 x 10 grams of salt. It does look like a lot more, doesn’t it?

Knowing that there are 10 grams of salt in each of the jars, it is pretty obvious that we need three and a half of those little jars for 35 grams of salt. When we did this in the lecture on Tuesday – and again, the students were not told how much salt was in one jar! -, the first person who answered guessed “four”. And then someone actually said “three and a half”. Oh well, lucky guess or great skill? I was hoping for answers like “maybe one of those jars”, because that would be closer to my own intuition. I guess next time I’ll be framing it differently. Maybe use something with one liter volume and put 35 grams in it? Or ask them to tell me in teaspoons? Does anyone have a good idea that they would like to share with me?

Ice cubes melting in fresh water and salt water (post 2/4)

The “ice cubes melting in fresh water and salt water” experiment the way I usually use it in class.

— Edit — For an updated description of this experiment please go to this page! — Edit —

You might remember the “ice cubes melting in fresh water and salt water experiment” from a couple of days ago. Today we are going to talk about it again, but with a little twist on it. See, when I showed you the experiment the other day, I used dyed ice cubes, so the melt water was colored and it was easy to track. Doing that, I focussed you attention on the melt water. This is not how we do it in class.

In class, students get clear ice cubes, and before they put them in the cups, I ask them to make a prediction. Which of the ice cubes will melt faster, the one in fresh water or the one in salt water? Everybody has to make a prediction. And having run this experiment with 100+ people by now, I can tell you: Approximately 5% predict the right outcome. And that is not 5% of the general population [edit: this used to say “5% of the general circulation”!], that is 5% of people who were either attending my class or a workshop on oceanography with me, who were attending a workshop on teaching oceanography, or my nerdy friends. So don’t be sad if you get it wrong – you are in good company.

So now that everybody has made a prediction, the ice cubes go into the cups with fresh water and salt water. In the beginning, the excitement is usually moderate. After all, you are staring at a plastic cup with an ice cube floating in it. But then, after the first minute or so, there is no denying any more: The ice cubes have started melting. And one of them is melting a lot faster than the other one. The one in fresh water is melting a lot faster than the one in salt water! How can this be? At this point, students typically start secretly (because remember – no tasting in the lab!) tasting the water in the cups to make sure that they didn’t actually swap the cups. After all, it should be the ice cube in the salt water melting faster, shouldn’t it?

But no, it is true: The ice cube in fresh water is melting faster than the one in salt water. But how??? Enter food coloring.

MVI_9248

Dyed ice cubes melting in fresh water (left) and salt water (right). Edited on Sept. 14th, 2014. Since this seems to be the most popular post on this blog I thought people might appreciate a better picture… And if you are really curious go check out the newer posts on the topic, a lot has happened over the last year!

Glasses filled with fresh water and salt water, and one ice cube in each. Drops of food dye have been added on the ice cubes to visualize the circulation. The left glass is homogeneously pink, whereas the right glass has a pink layer on top and only little pink below that layer.

If at this stage one or two drops of food coloring are dripped on the ice cubes, this dye helps visualize the circulation similarly to the dyed melt water I showed you the other day [which, incidentally, one of the student groups yesterday observed without food dye or me prompting. Great job!].

And now the whole thing makes much more sense: In the fresh water case, melt water is denser than the water in the cup and sinks to the bottom of the cup. As it is sinking away from the ice cube, it is being replaced with warmer water from the cup. Hence the ice cube is always floating in relatively warm water which helps it melt.

Sketch showing the explanation for why the ice cubes melt faster in fresh water than in salt water.

In salt water, on the other hand, the melt water forms a layer on top of the water in the cup. Even though it is very cold, it is still less dense than the salty water in the cup. The ice cube is more and more surrounded by its own melt water and not by the warmer water in the cup as was the ice cube in the fresh water. Therefore, the ice cube in the fresh water is melting faster than the one in salt water!

The experiment run in the lecture theater.

This experiment is easy to run in all kinds of settings. However it helps if the student groups are spaced out enough so that the instructor can reach all of the groups and listen in on the conversations to get a feel of how close to a solution the students are, or chat to the students to help them figure it out.

There will be two follow-up posts to this one: One about different didactical settings, and one different contexts this experiment can be used in.

How to pose questions for voting card concept tests (post 2/3)

Different ways of posing questions for concept tests are being presented here

Concept tests using voting cards have been presented in this post. Here, I want to talk about different types of questions that one could imagine using for this method.

1) Classical multiple choice

In the classical multiple choice version, for each question four different answers are given, only one of which is correct. This is the tried and tested method that is often pretty boring.

An example slide for a question with one correct answer

However, even this kind of question can lead to good discussions, for example when it is introducing a new concept rather than just testing an old one. In this case, we had talked about different kinds of plate boundaries during the lecture, but not about the frame of reference in which the movement of plates is described. So what seemed to be a really confusing question at first was used to initiate a discussion that went into a lot more depth than either the textbook or the lecture, simply because students kept asking questions.

2) Several correct answers

A twist on the classical multiple choice is a question for which more than one correct answer are given without explicitly mentioning that fact in the question. In a way, this is tricking the students a bit, because they are used to there being only one correct answer. For that reason they are used to not even reading all the answers if they have come across one that they know is correct. Giving several correct answers is a good way of initiating a discussion in class if different people chose different answers and are sure that their answers are correct. Students who have already gained some experience with the method often have the confidence to speak up during the “voting” and say they think that more than one answer is correct.

3) No correct answer

This is a bit mean, I know. But again, the point of doing these concept tests is not that the students name one correct answer, but that they have thought about a concept enough to be able to answer questions about the topic correctly, and sometimes that includes having the confidence to say that all answers are wrong. And it seems to be very satisfying to students when they can argue that none of the answers that the instructor suggested were correct! Even better when they can propose a correct answer themselves.

4) Problems that aren’t well posed

This is my favorite type of question that usually leads to the best discussions. Not only do students have to figure out that the question isn’t well posed, but additionally we can now discuss which information is missing in order to answer the question. Then we can answer the questions for different sets of variables.

ABCD_lake

One example slide for a problem that isn’t well posed – each of the answers could be correct under certain conditions, but we do not have enough information to answer the question.

For example for the question in the figure above, each of the answers could be correct during certain times of the year. During summer, the temperature near the surface is likely to be higher than that near the bottom of the lake (A). During winter, the opposite is likely the case (B). During short times of the year it is even possible that the temperature of the lake is homogeneous (C). And, since the density maximum of fresh water occurs at 4degC, the bottom temperature of a lake is often, but not inevitably, 4degC (D). If students can discuss this, chances are pretty high that they have understood the density maximum in freshwater and its influence on the temperature stratification in lakes.

5) Answers that are correct but don’t match the question.

This is a tricky one. If the answers are correct in themselves but don’t match the question, it sometimes takes a lot of discussing until everybody agrees that it doesn’t matter how correct a statement is in itself; if it isn’t addressing the point in question, it is not a valid answer. This can now be used to find valid answers to the question, or valid questions to the provided answers, or both.

This is post no 2 in a series of 3. Post no 1 introduced the method to the readers of this blog, post no 3 is about how to introduce the methods to the students you are working with.

A, B, C or D?

Voting cards. A low-tech concept test tool, enhancing student engagement and participation. (Post 1/3)

Voting cards are a tool that I learned about from Al Trujillo at the workshop “teaching oceanography” in San Francisco in 2013. Basically, voting cards are a low-tech clicker version: A sheet of paper is divided into four quarters, each quarter in a different color and marked with big letters A, B, C and D (pdf here). The sheet is folded such that only one quarter is visible at a time.

A question is posed and four answers are suggested. The students are now asked to vote by holding up the folded sheet close to their chest so that the instructor sees which of the answers they chose, whereas their peers don’t.

Voting cards are sheets of paper with four different colors for the four quarters, each marked with a big A, B, C or D.

This method is great because it forces each individual student to decide on an answer instead of just trying to be as invisible as possible and hope that the instructor will not address them individually. Considering different possible answers and deciding on which one seems most plausible is important step in the learning process. Even if a student chose a wrong answer, remembering the correct answer will be easier if they learn it in the context of having made a commitment to one answer which then turns out wrong, rather than having not considered the different options in enough detail to decide on one. “I thought A made sense because of X. But then we discussed it and it turns out that because of Y and Z, C is the correct answer” is so much more memorable than “I didn’t care and it turned out it was D”. Since the answers are only visible to the instructor and not to the other students, the barrier of voting is a lot lower because potentially embarrassing situations are being avoided. It is, however, also much harder to just observe the peers’ votes and then follow the majority vote.

In addition to helping students learn, this method is also beneficial to the instructor. The instructor sees the distribution of answers with one glance and rather than guessing how many students actually understand what I was talking about, I can now make an informed choice of the next step. Should I have students discuss with their neighbor to find an agreement and then ask the class to vote again? Elaborate more on the concept before asking students to discuss among themselves? Ask individual students to explain why they chose the answer they chose? Knowing how much students understood is very helpful in choosing the right method moving forward with your teaching. And even without staring directly at specific students, it is easy to observe from the corner of the eye whether students have trouble deciding for an answer or whether they make a quick decision and stick to it.

I have been using this method in this year’s GEOF130 lecture, and in a recent Continue. Stop. Start. feedback that I asked my students to fill in, every single student (who handed back the form, but that’s a topic for a different post) mentioned how the “A, B, C, D questions” or “quizzes” (which I both interpret as meaning the voting cards) help them learn and that I should definitely continue using them.

This post is number 1 of 3 on the topic of voting cards. Post no 2 will give examples of different types questions/answers that work well with this methods (for example always having only one correct answer might not be the most efficient strategy to foster discussions), and how to use them to maximize benefit for your teaching. Post no 3 will focus on introducing voting cards as a new method with least resistance by focussing on benefits to student learning and reassuring them on how the instructor will handle the information gained from seeing everybody vote.