Category Archives: demonstration (easy)

Mediterranean outflow

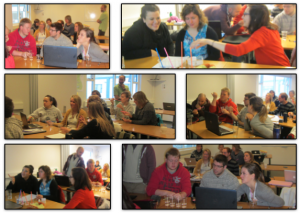
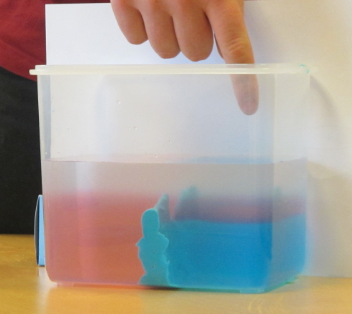
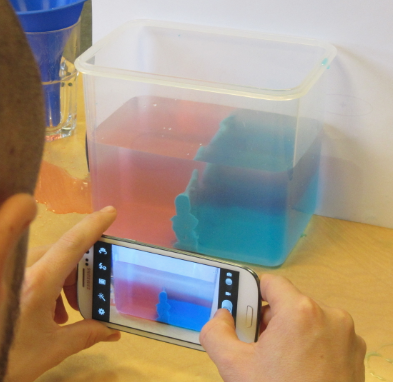
Students demonstrating the mediterranean outflow in a tank.

As reported earlier, students had to conduct experiments and present their results as part of CMM31. Niklas chose to demonstrate the mediterranean outflow – warm and salty water leaving the Mediterranean and sinking to a couple of kilometer’s depth in the Atlantic Ocean.

Since I happened to be around, they allowed me to document the experiments and blog about it, but there is a great description, including a movie, to be uploaded on the webpages of the University Centre of the Westfjords.

When the guys were done with the experiment, I couldn’t help but suggest to tip the tank so that the densest water would spill back into “the Mediterranean”. Check out the movie below if you fancy playing!

The broken spoon

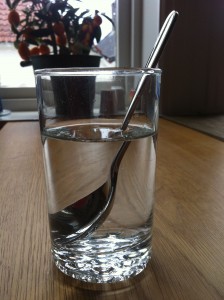
Refraction of light in water.

I just happened to notice this the other day, so I thought I’d take a picture and share it with you.

2013-10-24 12.13.01

“broken spoon”

It is amazing how much more aware of everyday things that can be used to illustrate concepts related to oceanography I have become since starting this blog! This is so much fun! :-)

Water seeks its level.

A solution for the siphon problem of the fjord circulation experiment.

After having run the fjord circulation experiments for several years in a row with several groups of students each year, Pierre and I finally figured out a good way to keep the water level in the tank constant. As you might remember from the sketch in the previous post or can see in the figure below, initially we used to have the tank separated in a main compartment and a reservoir.
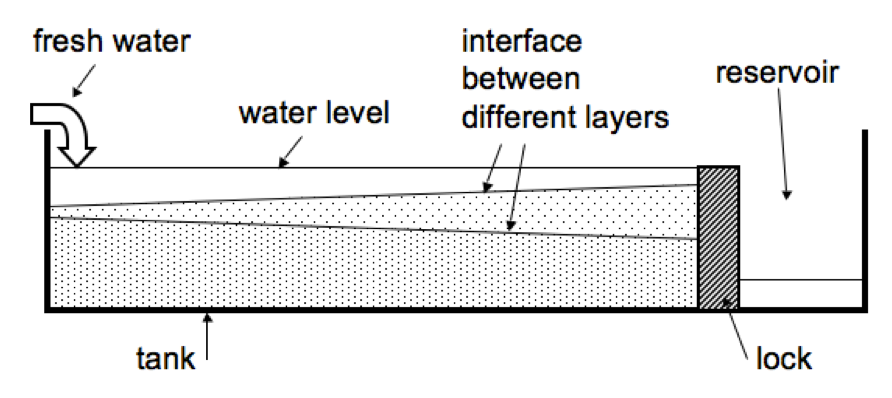
 But there were a couple of problems associated with this setup. Once, the lock separating the two parts of the tank fell over during the experiment. Then there are bound to be leaks. Sometimes we forget to empty the reservoir and the water level rises to critical levels. In short, it’s a hassle.

So the next year, we decided to run the experiment in a big sink and tip the tank slightly, so that water would just flow out at the lower end at the same rate that it was being added on the other side. Which kinda worked, but it was messy.

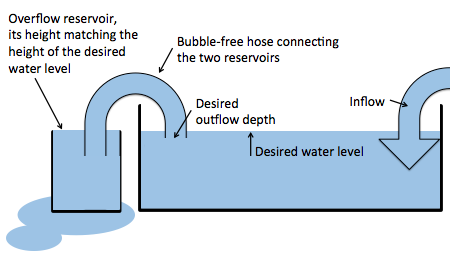
So this year, we came up with the perfect solution. The experiment is still being run in a sink, but now a hose, completely filled with water, connects the main tank with a beaker. The hight of the rim of the beaker is set to the desired water level of the big tank. Now when we add water to the big tank, there is an (almost – if the hose isn’t wide enough) instant outflow, so the water level in the tank stays the same.
Tankausfluss

New setup: A bubble-free hose connecting the tank and a reservoir to regulate the water level in the tank.

This way, we also get to regulate the depth from where the outflowing water is being removed. Neat, isn’t it?
Why do we get an Ekman spiral?

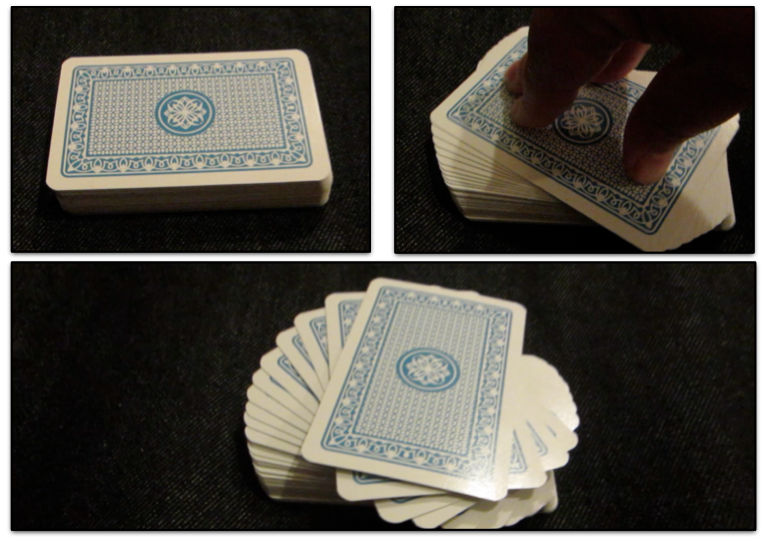
Visualizing an Ekman spiral using a deck of cards.

To state this right upfront: this post will not explain why the surface layer is moving at a 45 degree angle to the wind direction, and if anyone has a great idea for a simple demo for that please let me know! It will also not explain why the layers are turning further and further the deeper down you go. But what I am trying to do today is give an intuitive understanding for why all the theoretical layers in the water column turn in response to the surface layer and hence why an Ekman spiral develops if we accept that the surface layer is turning relative to the wind direction.

Demonstrating the formation of an Ekman spiral using a deck of cards.

You will need a deck of cards. Bonus points if they are “salmon fly” cards like mine (seriously – who could walk past a deck of cards with salmon flies on them? Plus I needed a deck of cards because I was already in Iceland when I realized I wanted to show this demo).

All you do now is put the stack in front of you. Put your hand on the top card, twist gently while applying a little bit of pressure. Voila – your Ekman spiral develops! It is turning the wrong way round, but the main point is that the twist is being transferred downwards from layer to layer and not only the top layer twisting while the other layers stay motionless.

And because people seem to always like movies:

Standing waves.

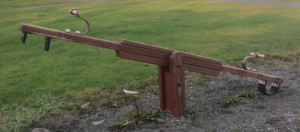
A seesaw to visualize how standing waves move in an enclosed basin.

In enclosed basins, standing waves can occur. In the simplest case, they have a node in the middle and the largest amplitudes at the edges of the basin. The movement of the water’s surface then closely resembles that of a seesaw.

IMG_5059

A seesaw. Largest amplitudes at the ends, node in the middle.

Extremely simple but extremely effective visualization!

Progressive waves on a rope

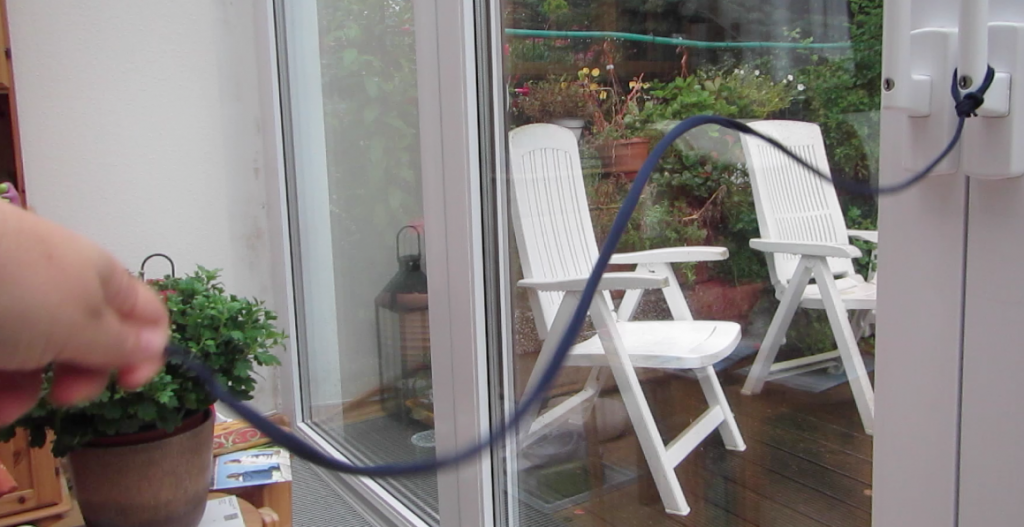
Visualization of progressive waves: wave form and energy move forward while the rope itself stays in place.

When I talked about waves in GEOF130 recently, in order to explain the concept of progressive waves, I showed a drawing from one of the textbooks, where someone was moving a rope such that waves traveled on the rope. The idea was to show that for progressive waves the wave form and energy travel, while the matter itself stays more or less in place, only moving up and down or in circular orbital motions.

The look I got from one of the students for showing that drawing confused me a bit and I am still not sure whether it was a “I have no idea what you are trying to tell me!” or a “Duh! Are we in kindergarden?”, but I think it was probably closer to the former. So from now on I will carry a piece of rope on me to show this in lectures and to have students try themselves.

A wave shape traveling forward on a rope, while the rope itself stays in place.

I filmed a quick video because it was difficult to watch the wave while exciting it myself, but it turns out it is even more difficult to hold a camera more or less steady while exciting waves at the same time, plus the movement is pretty quick even for a camera as awesome as mine. Anyway, if you want to procrastinate learn more about waves, watch this!

Why melting sea ice does not contribute to sea level rise.

Simple experiment on why the impact of glaciers and sea ice on sea level, respectively, are not the same.

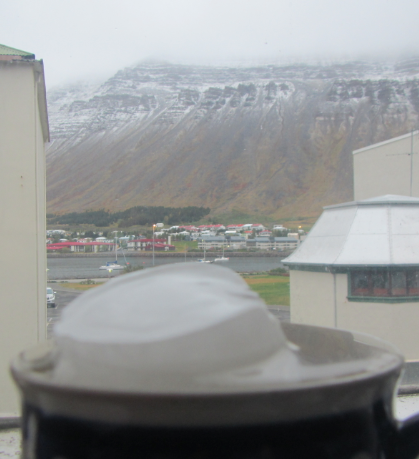
It could be so simple: An ice cube sinks into water until the mass it replaces is equal to its own mass.

The mug is as full with water as it gets. But even if I stared out of the window at the mountain and the snow until this swimming piece of ice had completely melted – the water level in the mug would not have changed.

Since the mass of said ice cube is not changing when it melts, under the assumption that the difference in volume due to the temperature difference of the melt water and the water in which the ice cube swims is negligible (reasonable assumption in most cases) that means that a swimming ice cube can’t change the water level in a cup and a swimming ice berg can’t change sea level. Things are different for glaciers or other ice that is sitting on land rather than freely swimming.

IMG_5100

I should have thought about how I would transport the plate on which the mug with the ice is sitting back to the kitchen once the ice has melted. In other words: Yes, the mug will spill over.

This is a very easy demonstration and while it is intuitive that in the second case a mug that was completely filled with water when the ice was first added will spill over once the ice melts, the first case seems to be very difficult. Most students are not quite sure what they are expecting to see, and even if they are, they don’t really know why.

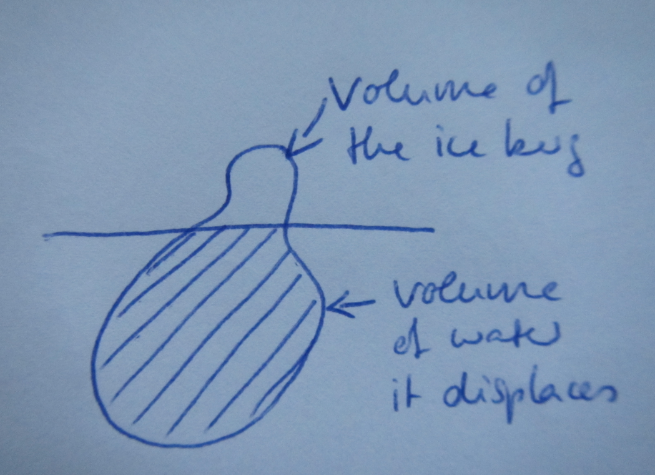
My typical drawing to explain this topic. The potato is supposed to be an ice berg floating in water.

I have always been teaching this by drawing the water level and the ice berg on the board, and then by marking the volume of the whole ice berg and the part of it that is under water, and trying to stress how the mass of the ice berg is the same as that of the water replaced by the part of the ice berg that is under water (because the molecules are more densely packed in liquid water and yada yada) — there must surely be a better way to explain this? Any ideas out there?

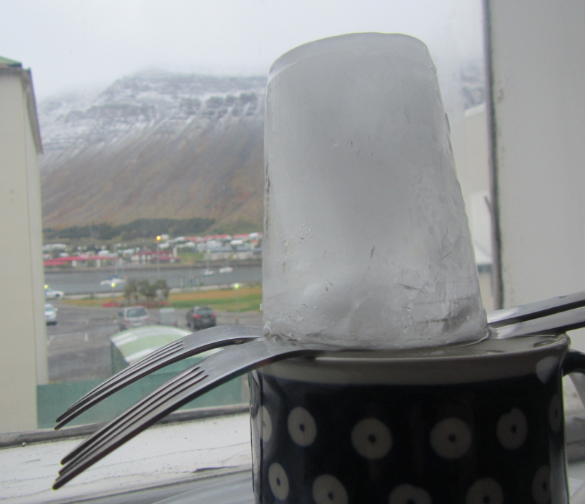
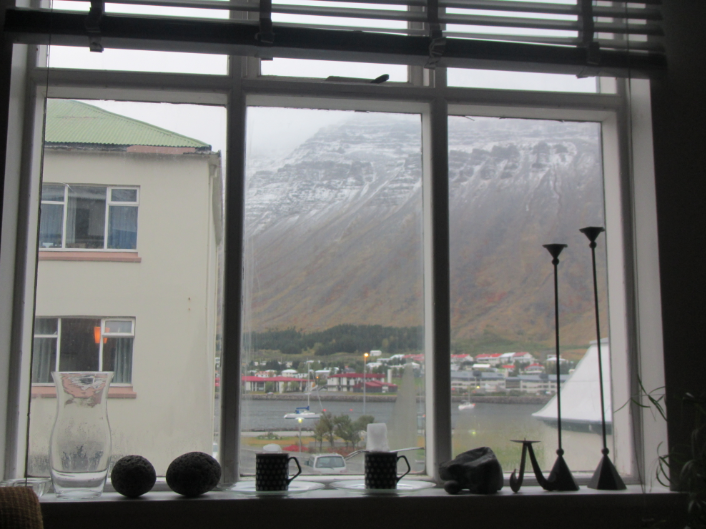
Experiments the Isafjördur way. Can you spot the two mugs and the ice in the middle of the window sill? Floating ice on the left, a “glacier” resting on forks above the water level on the right.

Tasting sea water reloaded

Doing the “tasting sea water” activity again with a different group of students.

A very good introduction to the concept of salinity is the “tasting sea water” activity. Last time I ran that activity, students were very quick to correctly connect the samples with the correct sampling locations without much discussion going on. This time round, though, there was a lot of discussion. Students quickly sorted samples in order of increasing salinity, but there was no agreement to be found on whether the Baltic or the Arctic should be fresher. Since I only pointed to a location and didn’t specify the depth at which the sample had been taken, some students argued that the Arctic was very fresh at the very top, whereas the Baltic was brackish. Others said that the Baltic was a lot fresher than any oceanic location.

salt-tasting

Students tasting four different samples of “sea water” with salinities corresponding to Arctic sea ice, the Baltic sea, the open ocean and the Mediterranean. Samples have to be associated with locations on a map.

In another group, there was a big discussion going on about how in marginal seas, evaporation or precipitation can dominate.

It is always great to see how much you can discuss and learn from an activity as simple as this one!

Internal waves in a bottle

Internal waves are shown in simple 0.5l bottles.

Waves travel on the interface between fluids of different densities and the phase speed of those waves depends on the density difference between the two fluids.

MVI_4505_02

MVI_4505_03

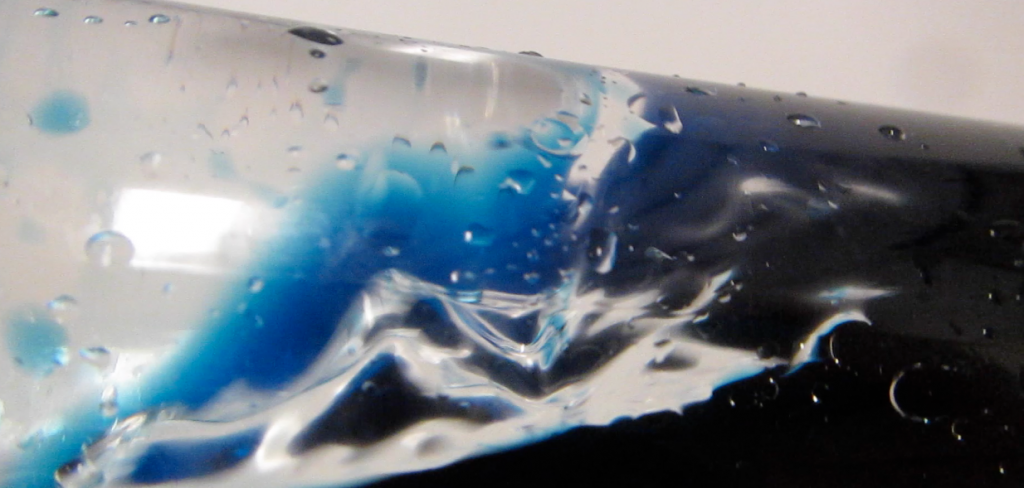
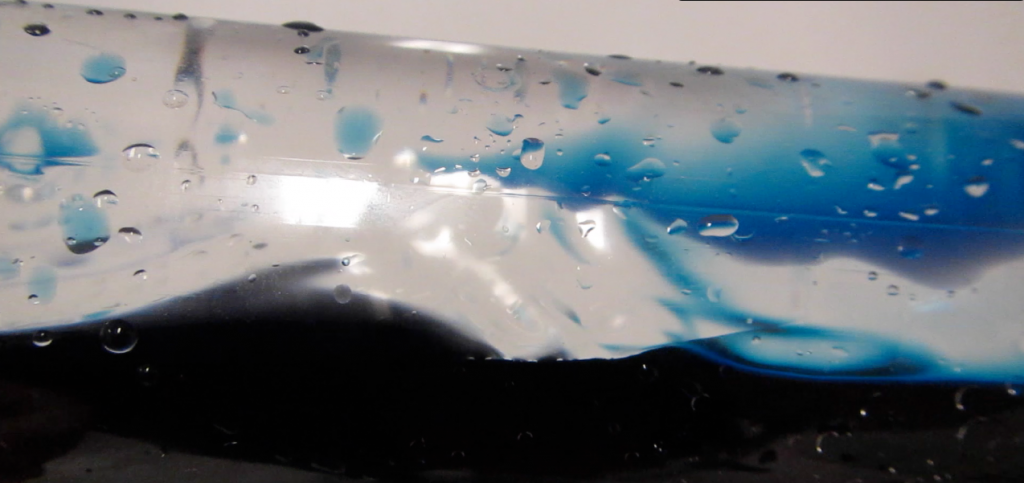
Internal waves on the interface between water (dyed blue) and white spirit.

The simplest way to demonstrate this in class can be seen below – two 0.5l plastic bottles are used, one half-filled with water, the other one filled with half water, half vegetable oil. Waves can very easily be excited by moving the bottles, and it is clearly visible that the waves at the interface between water and oil are a lot slower than the ones on the interface between water and air.

For showing this experiment to larger audiences when people can’t play with the bottles themselves, it really helps to color either the water or the oil layer for greater contrast. See here for different combinations that we tried in connection to forskningsdagene in Bergen.

Incidentally, those internal wave bottles are a great toy. If you don’t have one available but wish you had a paper weight as awesome as mine on your desk, here is a movie for you:

How mountains form

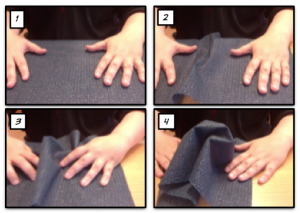
A very simple visualization of rock folding.

Stress is being applied to a piece of fabric from two sides. Over panels 1 to 4, “mountains” start forming.

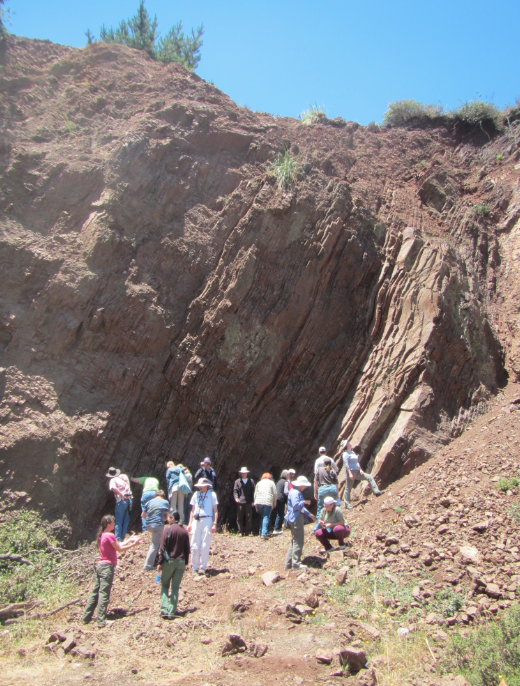
See? When I said “very simple” I meant “very simple”. But it does help explain why sometimes rock layers are not nice and horizontal.

Oceanography teachers investigating rock formations on one of the field trips of the “teaching oceanography” workshop in San Francisco in 2013.

This demo works really well with a piece of paper towel, too, especially if that is grabbed from a dispenser in the lecture theatre during the lecture and hence the impression is conveyed that it is a spontaneous visualization rather than one that was carefully planned…