Tag Archives: teaching

Measuring density

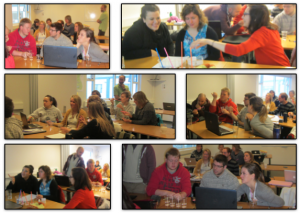
Students build a device to measure density.

As described in this post, I like to have students build “instruments” to measure the most oceanographic properties (temperature, salinity and density). I find that they appreciate oceanographic data much more once they have first-hand experience with how difficult it is to design instruments and make sense of the readings.

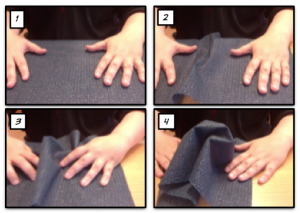
Students designing a hydrometer.

Measuring (relative) density is by no means easy. There are a lot of conceptual things to understand when developing hydrometers – one question that comes up every time is what to mark. The first idea tends be to mark displacement on the cup – either a zero-mark without the hydrometer in the cup and then the water level once the hydrometer is floating in the water, or the level of the bottom of the hydrometer. Which makes it fairly hard to measure other samples than the ones the instrument was initially calibrated with.

The student group working on the task was faced with – and overcame – many difficulties. The straw was top-heavy, so in order to float more or less vertically, it had to be cut down. They had four different test solutions, but they did not know the densities of those solutions, only their salinities, hence they developed their own density scale relative to which they measured the density of their solution. Pretty ingenious!

Tasting sea water reloaded

Doing the “tasting sea water” activity again with a different group of students.

A very good introduction to the concept of salinity is the “tasting sea water” activity. Last time I ran that activity, students were very quick to correctly connect the samples with the correct sampling locations without much discussion going on. This time round, though, there was a lot of discussion. Students quickly sorted samples in order of increasing salinity, but there was no agreement to be found on whether the Baltic or the Arctic should be fresher. Since I only pointed to a location and didn’t specify the depth at which the sample had been taken, some students argued that the Arctic was very fresh at the very top, whereas the Baltic was brackish. Others said that the Baltic was a lot fresher than any oceanic location.

salt-tasting

Students tasting four different samples of “sea water” with salinities corresponding to Arctic sea ice, the Baltic sea, the open ocean and the Mediterranean. Samples have to be associated with locations on a map.

In another group, there was a big discussion going on about how in marginal seas, evaporation or precipitation can dominate.

It is always great to see how much you can discuss and learn from an activity as simple as this one!

Internal waves in the atmosphere

A photo of internal waves in the atmosphere.

Internal waves exist on the interface between fluids of different densities. In the ocean they are mostly observed through their surface imprint. In the tank, we could also observe them by looking in from the side, but this is hardly feasible in the ocean. But luckily vision is easier in the atmosphere than in the ocean.

On our research cruise on the RRS James Clark Ross in August 2012, we were lucky enough to observe atmospheric internal waves, and even breaking ones (see image above). This is quite a rare sight, and a very spectacular one, especially since, due to the low density contrast between the two layers, the waves break extremely slowly.

It is really hard to imagine what it looked like for real. This movie shows the view of Jan Mayen – the volcano, the rest of the island and then the atmospheric waves. Please excuse the wobbly camera – we were after all on a ship and I was too excited to stabilize properly.

Details of lee waves in the tank.

A movie focusing on details of the lee waves in the tank.

In this post, we investigated lee waves in a tank in a general way. Here, I want to show a detail of those lee waves:

In this movie, the concept of hydraulic control becomes visible. On the upstream side of the mountain, the dense water layer forms a reservoir which is slightly higher than the mountain. On top of the mountain and towards its lee side, the layer of denser water is stretched thin and has a smooth surface until about half way down the mountain, where waves start to form. In this thin, smooth layer, flow speeds are higher than the wave speeds, hence disturbances of the interface are flushed downstream and cannot deform the interface. Only about halfway down the mountain, the phase speed becomes equal to the flow speed, hence waves can both form and stay locked in place relative to the mountain.

For more information on internal waves, check out these posts [which are scheduled to go online over the next couple of days]:

Surface imprints of internal waves

How internal waves in the ocean can be spotted on the surface.

Under certain conditions, internal waves in the ocean can be spotted at the ocean’s surface due to changes in surface roughness or to the movement of floating foam or debris. They can be spotted if half their wavelength is longer than the distance between the interface on which the internal wave is traveling and the water surface, so that the orbital movement caused by the internal waves reaches the water surface. In the tank, they can also be seen – for example by adding small floating particles to the water surface.

MVI_3064

Internal wave in a tank. Seen from the side due to different coloring of the two layers, and on the surface in the distribution of floating tracer.

In the movie below, you can see the interface between water layers of different densities and the water surface with particles on it. The particles make it easy to spot how the water surface is being stretched and squeezed as internal waves travel through underneath.

For more information on internal waves, check out these posts [which are scheduled to go online over the next couple of days]:

Internal (lee) waves in a tank.

Lee wave experiment in a large tank with a moving mountain.

In this previous post, we talked about internal waves in a very simple experiment. But Geophysical Institute has a great tank to do lee wave experiments with that I want to present here (although it doesn’t seem to be clear what will happen to the tank when the remodeling of the main building starts in November – I hope we’ll be able to save the tank!). I think it has originally been used for real research, but these days the GEOF130 lab is the only time this tank gets used.

MVI_2787_01

Tank for internal lee wave experiments – a “mountain” is moved through the tank and generates internal waves.

In this tank, a “mountain” can be moved all the length of the tank through more or less stagnant water, thereby simulating a current going over a non-moving mountain (which might be a slightly more realistic setup). At the lee of the mountain, lee waves form on the interface between two water layers of different density.

For more information on internal waves, check out these posts [which are scheduled to go online over the next couple of days]:

Internal waves in a bottle

Internal waves are shown in simple 0.5l bottles.

Waves travel on the interface between fluids of different densities and the phase speed of those waves depends on the density difference between the two fluids.

MVI_4505_02

MVI_4505_03

Internal waves on the interface between water (dyed blue) and white spirit.

The simplest way to demonstrate this in class can be seen below – two 0.5l plastic bottles are used, one half-filled with water, the other one filled with half water, half vegetable oil. Waves can very easily be excited by moving the bottles, and it is clearly visible that the waves at the interface between water and oil are a lot slower than the ones on the interface between water and air.

For showing this experiment to larger audiences when people can’t play with the bottles themselves, it really helps to color either the water or the oil layer for greater contrast. See here for different combinations that we tried in connection to forskningsdagene in Bergen.

Incidentally, those internal wave bottles are a great toy. If you don’t have one available but wish you had a paper weight as awesome as mine on your desk, here is a movie for you:

How mountains form

A very simple visualization of rock folding.

Stress is being applied to a piece of fabric from two sides. Over panels 1 to 4, “mountains” start forming.

See? When I said “very simple” I meant “very simple”. But it does help explain why sometimes rock layers are not nice and horizontal.

Oceanography teachers investigating rock formations on one of the field trips of the “teaching oceanography” workshop in San Francisco in 2013.

This demo works really well with a piece of paper towel, too, especially if that is grabbed from a dispenser in the lecture theatre during the lecture and hence the impression is conveyed that it is a spontaneous visualization rather than one that was carefully planned…

Ice in the ocean – my historical photos

Ice formation in the ocean – using my own photos to tell the story.

Recently I talked about using my own photo to explain the generation of wind-generated waves to students. And then I realized that there is another set of photos that I have been using for teaching purposes for years that I could share here, too. Those are photos that I took on my very first “real” (as in “not a student, but participating in real research”) cruise back in 2003. In a time when pictures were still analog and you could take 36 pictures and then you had to change to a new film if you had planned ahead and brought one. I think I brought 6 films on the one-month cruise. It seemed excessive at the time, and today I easily take that amount of pictures in a day, especially when at sea and in the ice.

Anyway, let’s talk about the ice.

Newly forming  ice in the front, older ice in the back.

In the picture above you see several different kinds of ice: Older ice that looks like what you would imagine ice to look like in the back towards the horizon, and newly forming ice between the old ice and the ship. The ice has only just started freezing and forms a slush at the ocean’s surface that dampens out wave movement. In places, pancake ice is starting to form.

Pancake ice.

Pancake ice are almost round pieces of ice that are formed when slush freezes together. Since there is still some wave action in the water, the little ice plates bump into each other, forming a little puffy rim. Pancakes typically have a sizes ranging from the palm of your hand to maybe half a meter.

Several of the pancakes frozen together to form larger ice floes.

If the sea state isn’t too rough and the cooling continues, several of the pancakes freeze together to form larger ice floes.

Pancakes frozen together to form a closed surface.

Eventually, pancakes freeze together to form a closed surface.

Sea ice cover, additionally covered in snow.

If cooling persists, the sea ice cover thickens gradually, and snow falls on the surface.

I was so lucky to see all of these different stages of ice on my very first research cruise! And I was even luckier – in this year’s GEOF332 “field course in oceanography”, I got to show pancake ice to my students, in Hardanger fjord in February! Granted, the pancakes were really thin and we never got to see a closed sea ice cover, but what an awesome first day for a student cruise!

The Hardanger fjord covered in pancake ice on February 1st, 2013.

A fetching title for a fetching photo post

Using a photo from one of my research cruises to explain the formation of wind waves.

Wind waves are (surprise coming up!) waves generated by wind that blows over the ocean’s surface. The size of those waves depends on several factors: The strength of the wind, the length of time the wind has been blowing over the ocean, and  the fetch (hence the “fetching” title of this post).

The bow of the RRS James Clark Ross and wind-generated waves in front of it. Note how the wind direction is indicated by the wind vane, and how parts of the ocean are sheltered by the ice floes.

The image above is really useful to talk about this concept. We see the wind direction indicated by the wind vane at the bow of the RRS James Clark Ross. In the lee of the ice floes, the water surface is smooth because it is sheltered from the wind. As the distance from the ice flow, and hence the fetch, increases, waves start forming again. In addition to the formation of waves, you can see how waves are refracted around the ice floe.

I like teaching using photos that I took myself. Not only do they show exactly what I want to talk about, but they also give me the opportunity to share stories, like in this case of how I took that photo when we were first approaching the ice edge in the Greenland Sea and then the next day there was ice everywhere and we saw polar bears. Not only are students entertained and fascinated hearing personal stories of experiences at sea, I think that those stories are also important for helping students form their self-image as an oceanographer, and for motivating them to stick it out through the tougher spots of their studies. Stories also help students remember content, and story telling is a very useful method in the classroom (but more about that in another post).