Tag Archives: guest post

A tool to understand students’ previous experience and adapt your practical courses accordingly — by Kirsty Dunnett

Last week, I wrote about increasing inquiry in lab-based courses and mentioned that it was Kirsty who had inspired me to think about this in a new-to-me way. For several years, Kirsty has been working on developing practical work, and a central part of that has been finding out the types and amount of experiences incoming students have with lab work. Knowing this is obviously crucial to adapt labs to what students do and don’t know and avoid frustrations on all sides. And she has developed a nifty tool that helps to ask the right questions and then interpret the answers. Excitingly enough, since this is something that will be so useful to so many people and, in light of the disruption to pre-univeristy education caused by Covid-19, the slow route of classical publication is not going to help the students who need help most, she has agreed to share it (for the first time ever!) on my blog!

Welcome, Kirsty! :)

A tool to understand students’ previous experience and adapt your practical courses accordingly

Kirsty Dunnett (2021)

Since March 2020, the Covid-19 pandemic has caused enormous disruption across the globe, including to education at all levels. University education in most places moved online, while the disruption to school students has been more variable, and school students may have missed entire weeks of educational provision without the opportunity to catch up.

From the point of view of practical work in the first year of university science programmes, this may mean that students starting in 2021 have a very different type of prior experience to students in previous years. Regardless of whether students will be in campus labs or performing activities at home, the change in their pre-university experience could lead to unforeseen problems if the tasks set are poorly aligned to what they are prepared for.

Over the past 6 years, I have been running a survey of new physics students at UCL, asking about their prior experience. It consists of 5 questions about the types of practical activities students did as part of their pre-universities studies. By knowing students better, it is possible to introduce appropriate – and appropriately advanced – practical work that is aligned to students when they arrive at university (Dunnett et al., 2020).

The question posed is: “What is your experience of laboratory work related to Physics?”, and the five types of experience are:
1) Designed, built and conducted own experiments
2) Conducted set practical activities with own method
3) Completed set practical activities with a set method
4) Took data while teacher demonstrated practical work
5) Analysed data provided
For each statement, students select one of three options: ‘Lots’, ‘Some’, ‘None’, which, for analysis, can be assigned numerical values of 2, 1, 0, respectively.

The data on its own can be sufficient for aligning practical provision to students (Dunnett et al., 2020).

More insight can be obtained when the five types of experience are grouped in two separate ways.

1) Whether the students would have been interacting with and manipulating the equipment directly. The first three statements are ‘Active practical work’, while the last two are ‘Passive work’ on the part of the student.

2) Whether the students have had decision making control over their work. The first two statements are where students have ‘Control’, while the last three statements are where students are given ‘Instructions’.

Using the values assigned to the levels of experience, four averages are calculated for each student: ‘Active practical work’, ‘Passive work’; ‘Control’, ‘Instructions’. The number of students with each pair of averages is counted. This leads to the splitting of the data set, into one that considers ‘Practical experience’ (the first two averages) and one that considers ‘Decision making experience’ (the second pair of averages). (Two students with the same ‘Practical experience’ averages can have different ‘Decision making experience’ averages; it is convenient to record the number of times each pair of averages occurs in two separate files.)

To understand the distribution of the experience types, one can use each average as a co-ordinate – so each pair gives a point on a set of 2D axes – with the radius of the circle determined by the fraction of students in the group who had that pair of averages. Examples are given in the figure.
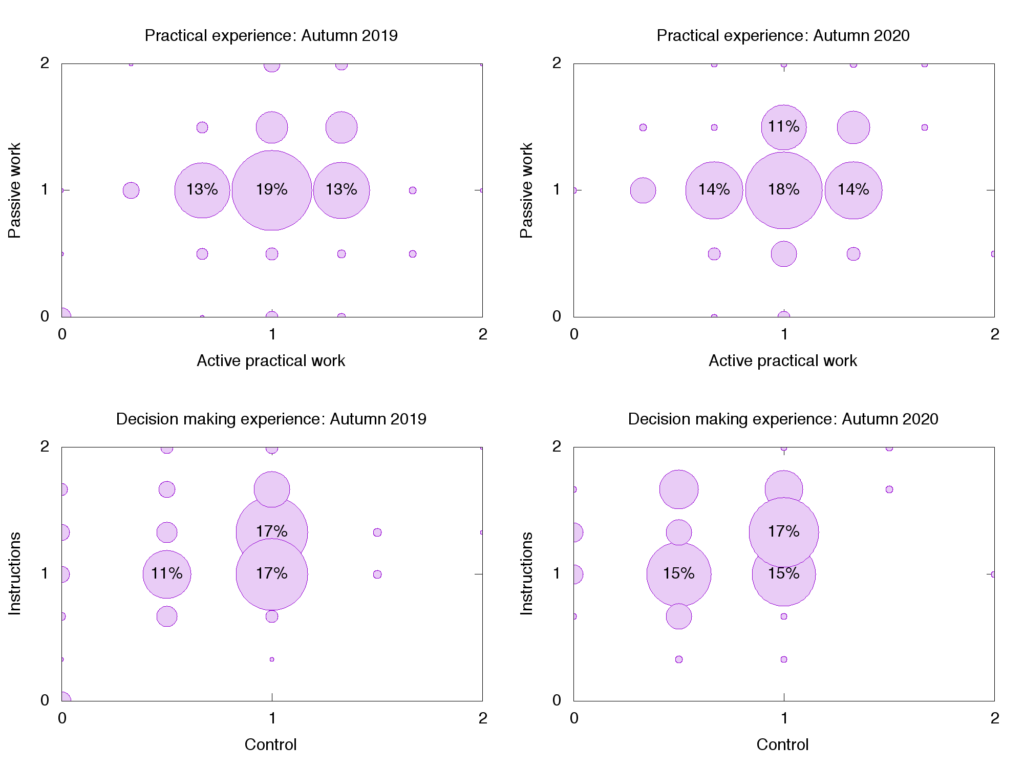
Prior experience of Physics practical work for students at UCL who had followed an A-level scheme of studies before coming to university. Circle radius corresponds to the fraction of responses with that pair of averages; most common pairs (largest circles, over 10% of students) are labelled with the percentages of students. The two years considered here are students who started in 2019 and in 2020. The Covid-19 pandemic did not cause disruption until March 2020, and students’ prior experience appears largely unaffected.

With over a year of significant disruption to education and limited catch up opportunities, the effects of the pandemic on students starting in 2021 may be significant. This is a quick tool that can be used to identify where students are, and, by rephrasing the statements of the survey to consider what students are being asked to to in their introductory undergraduate practical work – and adding additional statements if necessary, provide an immediate check of how students’ prior experience lines up with what they will be asked to do in their university studies.

With a small amount of adjustment to the question and statements as relevant, it should be easy to adapt the survey to different disciplines.

At best, it may be possible to actively adjust the activities to students’ needs. At worst, instructors will be aware of where students’ prior experience may mean they are ill-prepared for a particular type of activity, and be able to provide additional support in session. In either case, the student experience and their learning opportunities at university can be improved through acknowledging and investigating the effects of the disruption caused to education by the Covid-19 pandemic.


K. Dunnett, M.K. Kristiansson, G. Eklund, H. Öström, A. Rydh, F. Hellberg (2020). “Transforming physics laboratory work from ‘cookbook’ to genuine inquiry”. https://arxiv.org/abs/2004.12831
Guest post on “A little bit of lee wave math” by Jeannette Bedard

Today’s guest blogger Jeannette and I “met” on Twitter when she reposted one of my 24 Days of #KitchenOceanography posts, saying “A friend just forwarded me a #kitchenoceanography experiment that pretty much sums up my MSc work minus all the math.”. So I — obviously — asked her to write a guest post, and here we go! Thank you, Jeannette! :-)

“Lee waves are everywhere. They lurk in your sink, form over mountains and even beneath the ocean’s surface (no doubt they’ll be found out space too).

Mountains and under-sea ridges change how a fluid (air or water) passes over it. Glider pilots in the 1930s first noted the effects of lee waves—when a glider catches a lee wave, the unpowered aircraft can climb higher and stay in the air longer adding to the fun of their flight. But since I’m an oceanographer, I’m going to focus on water.

When water pushes up and over an obstacle, it gets squeezed and speeds up. At the bottom the water slows creating a wave on the surface. How this wave moves depends on the fluid velocity and water depth which can be combined in the Froude number.

The Froude number equals the fluid velocity over the square root of gravity times water depth (note—it’s water depth, not obstacle height so it still applies to the flat landscape of your sink). By using this number, flows in dramatically different settings can be compared. For example, atmospheric flow over a mountain range can be related to water moving over a weir.

So what does the Froude number tell us?

When F is smaller than one, flow over the bump is ‘subcritical’. The resulting surface wave can travel upstream, meaning that downstream conditions affect the flow upstream. This is kind of like tossing a pebble into a flowing stream and seeing the resulting ripples move both upstream and downstream.

When F is larger than 1, flow is ‘supercritical’ meaning no surface disturbance can travel upstream. Here, ripples created by a pebble tossed in cannot overcome the speed of the water and only move downstream.

Now, back to flow over a bump (although the bump is not actually required). As subcritical water pushes over it’s squeezed as the water is now shallower but the same amount of water has to move through. This forces the water to speed up and transition to supercritical.

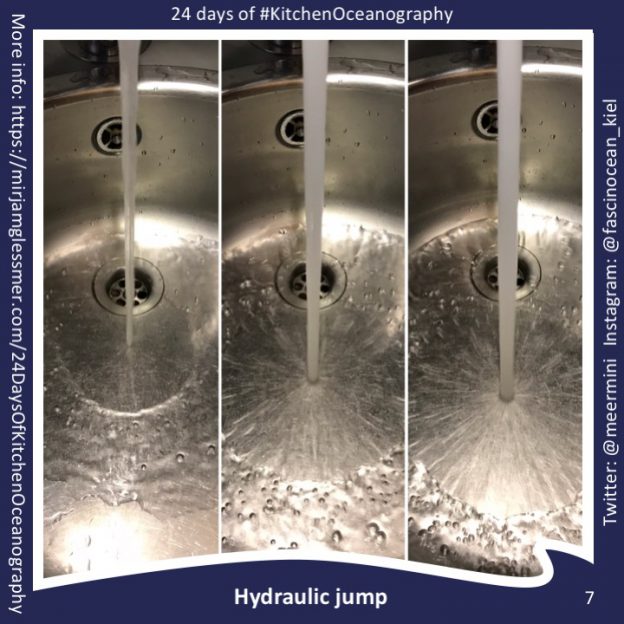
As faster water crosses over to the other side of the bump where it’s again deeper. It abruptly slows and waves form. Since the water is moving too fast to let the waves move upstream (because it is supercritical) these waves build up, forming a sudden water level increase that can stand still in the flowing water. This is called a hydraulic jump—a non-linear effect observable in a kitchen sink or in water passing over a weir.

The bigger the Froude number is, the more pronounced the jump will be. For flow speeds slightly above the critical speed, the jump forms as an undulating wave. When flow speed increases, the Froude number also increases, and the transition becomes abrupt in shape. Beneath the wave, water flow becomes chaotic in an effect called turbulence.

Because of the turbulence they create, the sea floor under a lee wave makes great habitat for critters—especially stationary filter feeders, as a buffet of tasty treats whooshes by.”

Guest post by Alice Langhans: Scientific reasons why the ocean boosts mental health

My friend Alice runs a really interesting Instagram account that I love following. She posts about being a PhD student in physics didactics, does #experimentalfriday (which you might remember from her recent guest post on my blog), gives helpful advice for mental health topics and takes beautiful pictures. Check it out — @scied_alice. A couple of days ago she posted about having found some research on how proximity to the ocean and a person’s state of mind are connected. So obviously I had to ask whether she would write about it for my blog, and I am super stoked she did! Here is what she writes:

Scientific reasons why the ocean boosts mental health

When was the last time you were at the sea and just took in everything it offered? The smell of salty water, the light breeze on your skin, the sound of rolling waves. Do you remember the feeling it gave you? That sense of calmness and relaxation, the inner peace and quiet, ultimately setting you in a state of easy meditation, giving you that break from everyday life you just needed? The impact of the ocean on physical, mental and emotional well-being seems so obvious and intuitive but there is actual scientific research on that topic. Who wouldn’t want to understand what exactly is going on in the humans’ mind and body when encountered with the ocean or any great body of water? So let me tell you about some of the findings I stumbled upon, researching a short post on why I myself like to live at the coast of the Baltic Sea.

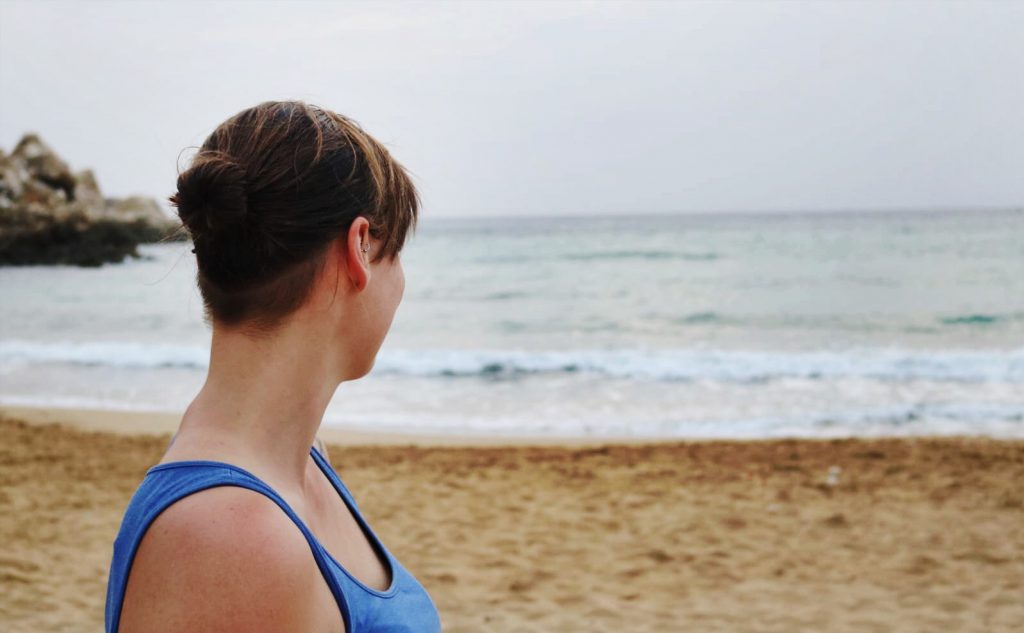
I Golden Bay Beach, Malta (Picture by Alice Langhans)

It seems like yesterday, that the professor giving a speech at my graduation ceremony talked about the happiness level in several states in Germany and how lucky we are if we get a job in Schleswig-Holstein, which scored the happiest state several years in a row now (Schlinkert & Raffelhüschen, 2018). I had to smile because at that moment I had already taken a job in Kiel, the state capitol of Schleswig-Holstein. Apparently, the proximity to the coast and the access to blue (water) space has shown to have a positive effect on well-being. This could be one factor explaining the happiness level in Schleswig-Holstein, because the state is enclosed between the North and the Baltic Sea on each side and everyone I know enjoys that advantage to its fullest by spending lots of time at the waterfront. According to a British study, citizens living at the coast report better physical and mental health (White, Alcock, Wheeler, & Depledge, 2013)and Japanese colleagues, Peng and Yamashita(2016), concluded that people with ocean view from their homes were calmer than their inland neighbors. And if you are thinking of choosing a retirement home at the coast, they have good news as well: positive psychological effects were highest for elderly people.

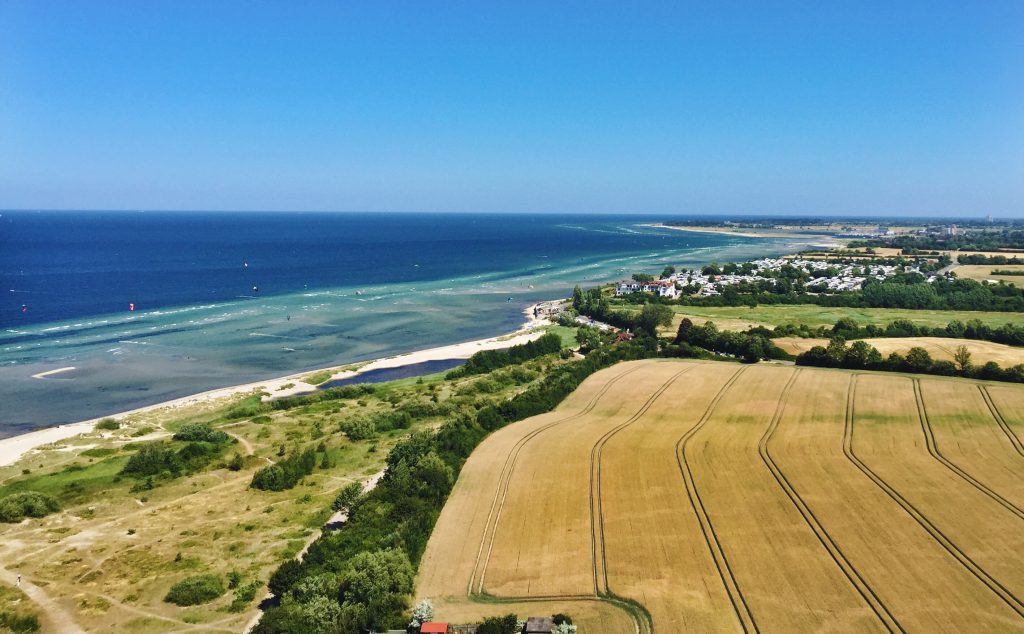
IIBay of Kiel, Laboe, Germany (picture by Alice Langhans)

There seems to be something happening to people when visiting the beach or waterfront and scientific research finds answers to that in our senses. The feeling of calmness, relaxation and peace is stimulated by the view of the blue space. A study conducted in Wellington, NZ showed lower psychological distress in people with visibility of what they called blue space, images of the Pacific Ocean and the Tasman Sea (Nutsford, Pearson, Kingham, & Reitsma, 2016). Neuroscientist Michael Merzenich claims that being in the clear and simple environment of the ocean, humans have a sense of security and safety because it’s a stable and predictable environment (Yeoman, 2013). Makes sense, doesn’t it? Because everything unusual is instantly outstanding against the calm and flat horizon.

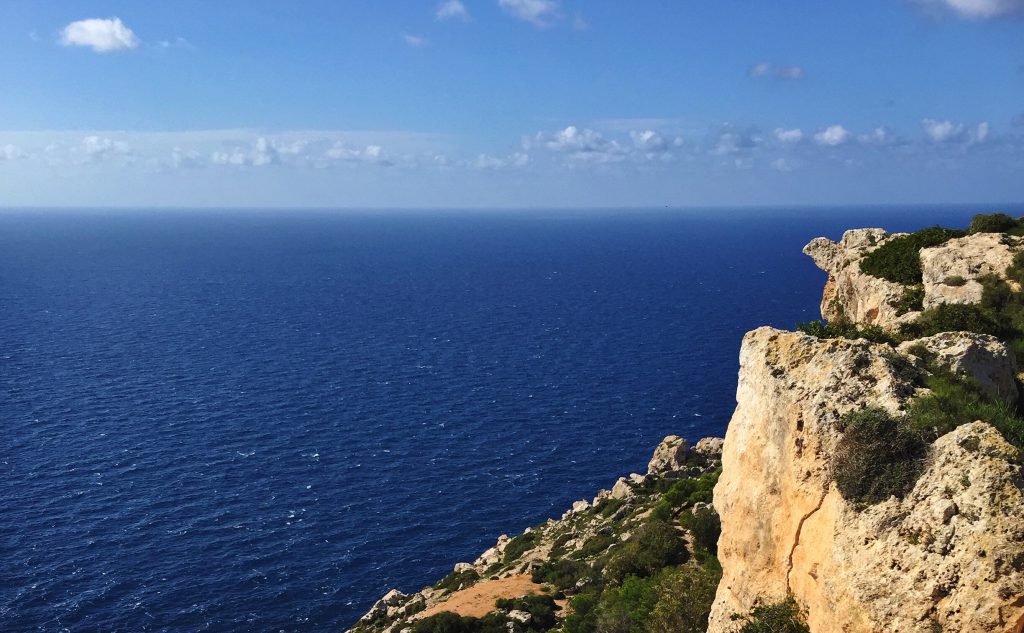
III Dingli Cliffs, Malta (Picture by Alice Langhans)

And there is even more to a visit to the beach than just the view of water. It’s the sheer sound of incoming waves that soothes the mind and relaxes the spirit. Sounds with wave patterns were found to be the most relaxing because they lower the cortisol level, a stress hormone and activate the parasympathetic nervous system, slowing us down and promoting relaxation (Heiser, 2017). This has the same effect as meditation.

IV Hargen an Zee, Netherlands (Picture by Alice Langhans)

So the next time you’re at the beach: Take everything in, take a deep breath, concentrate on your body and the calmness the ocean triggers in you and enhance those positive effects the ocean has on you! Enjoy!

References

Heiser, C. (2017). What the beach does to your brain. Retrieved from https://www.nbcnews.com/better/health/what-beach-does-your-brain-ncna787231

Nutsford, D., Pearson, A. L., Kingham, S., & Reitsma, F. (2016). Residential exposure to visible blue space (but not green space) associated with lower psychological distress in a capital city. Health & Place, 39, 70–78. https://doi.org/10.1016/j.healthplace.2016.03.002

Peng, C., & Yamashita, K. (2016). Effects of the Coastal Environment on Well-being. Journal of Coastal Zone Management, 19(2). https://doi.org/10.4172/2473-3350.1000421

Deutsche Post DHL. (2018). Deutsche Post Glücksatlas 2018: Weiter hohe Lebenszufriedenheit in Deutschland. Retrieved from https://www.dpdhl.com/content/dam/dpdhl/de/media-relations/press-releases/2018/pm-gluecksatlas-20181011.pdf

White, M. P., Alcock, I., Wheeler, B. W., & Depledge, M. H. (2013). Coastal proximity, health and well-being: Results from a longitudinal panel survey. Health & Place, 23, 97–103. https://doi.org/10.1016/j.healthplace.2013.05.006

Yeoman, B. (2013). Why the Beach Makes Us Happy. Retrieved from http://barryyeoman.com/2013/02/beach-happiness-neuroconservation/

Guest post: Alice shows magic tricks and explains refraction of light in water

My friend Alice Langhans runs a super cool science communication Instagram (@edu_al_ice), where she posts about her experiences as PhD student in physics education research. And there is a lot more going on on that Instagram than just pretty (but oh so pretty!) pictures. I make sure to read all her posts, because there are always interesting, motivating, inspiring thoughts hidden behind that “read more” button. And now she’s even started a new series of physics experiments on #experimentalfriday, and I am super excited that she wrote this guest post for me!

But now look at the picture below, and then read about some magic! :-)

Alice writes:

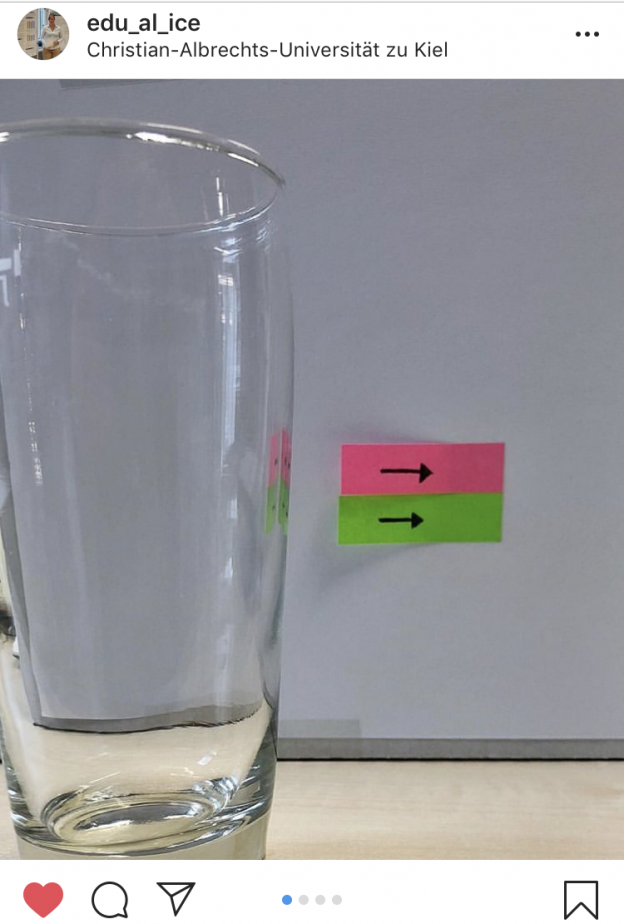
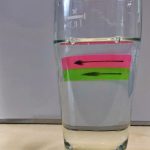
Magic! One of the arrows changes its direction and here is why:

Click for large picture. Picture by Alice Langhans.

First, the arrows are unchanged and visible through the glass.

Click for large picture. Picture by Alice Langhans.

Adding water to the glass, the image of the arrow gets bigger and appears mirrored!

Click for large picture. Picture by Alice Langhans.

With even more water even the second arrow appears bigger and mirrored.

Click for large picture. Picture by Alice Langhans.

The waterglass I used is round and the refraction of light in water is different than in air, which makes the water glass act like a positive (converging) lens. This is why the image of the arrow appears bigger and mirrored.

Think of the arrow as many points, each of which is the source of a divergent bundle of light. The light coming from the point that is the arrowhead on the right, is refracted through the waterglass and reaches our eye to the left. The light from the left end of the arrow refracts in such a way that it now enters our eye on the right side.

Notice, how you can also see how the upper arrow appears even bigger? The glass is more wide at that height, magnifying properties of the water glass lens are therefore increased.


Isn’t that a super nice demo? I love it! Thank you for writing this guest post, Alice! :-)

P.S.: Alice has just been interviewed for a podcast. Curious what she’s talking about on there? Me too, but that’s why I follow her Instagram (@edu_al_ice) — to never miss out on all the cool stuff she’s up to! :-)

Awesome interference pattern in a Norwegian fjord

“Hei Mirjam.

Bergen had it’s two days of allocated summer during the weekend of 22 – 23 July 2017 and Elsa and I decided to – in true Norwegian style – take advantage of the rare occasion and go for a hike. A colleague of mine has a “hytte” near Langhelle and had invited us over for the day. So we each packed our “matpakke”, hiking boots and got on the train from Bergen to Vaksdal, where my colleague had arranged to pick us up.

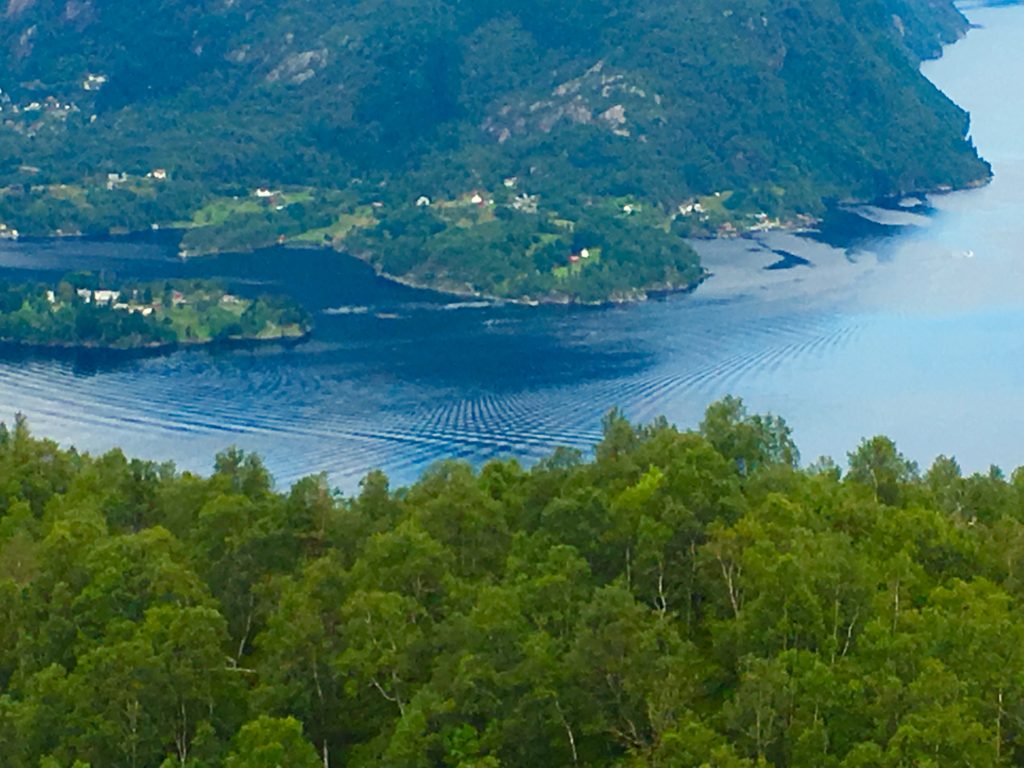
Anyway, long story short, apart from the spectacular view over Sørfjorden, I thought that the following would make you smile. Pointed it out to Elsa and, as if on cue, in unison we said your name out loud.

fullsizerender

I’m afraid the resolution is not that great though – had to zoom quite a bit to capture what was much more clearly visible with the naked eye.

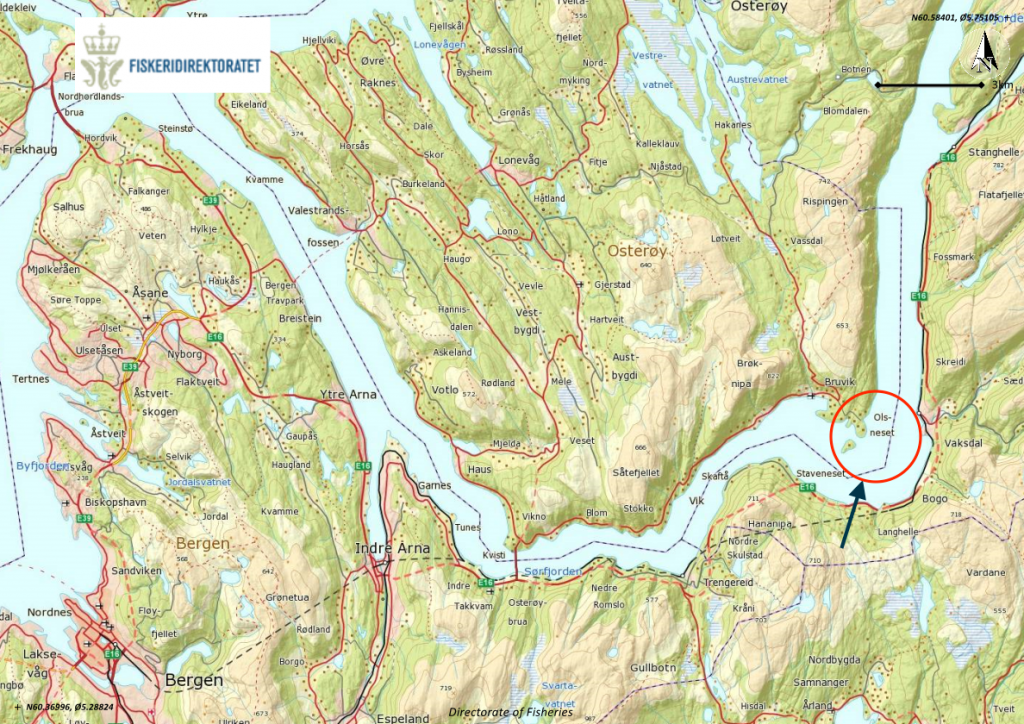
I’m including a map to show where it is. The arrow indicates more or less where we were standing when I took the picture; the circle around the area. Opposite Vaksdal, on the western bank (does a fjord have a “bank”? What’s the correct term? “Wall”?) of Sørfjorden is Olsneset and the little isle, Olsnesøyna, you see in the pic. There’s apparently an “open air” prison on the island. Not a bad place to be incarcerated!

kart_1-100k

One of the wave trains was made by the little ferry that runs to and fro between Vaksdal, Olsnesøyna and Osterøy.

I’m sure that the readers of your blog would also enjoy the pic, so please feel free to use it.”

Wow! Thanks, Pierre! :-)

I obviously love it when my friends think of me, but it makes me even more excited when they think of me in connection to cool stuff related to water and send me pictures. But clearly the first thing I had to do upon receiving this email was to try and interpret the picture.

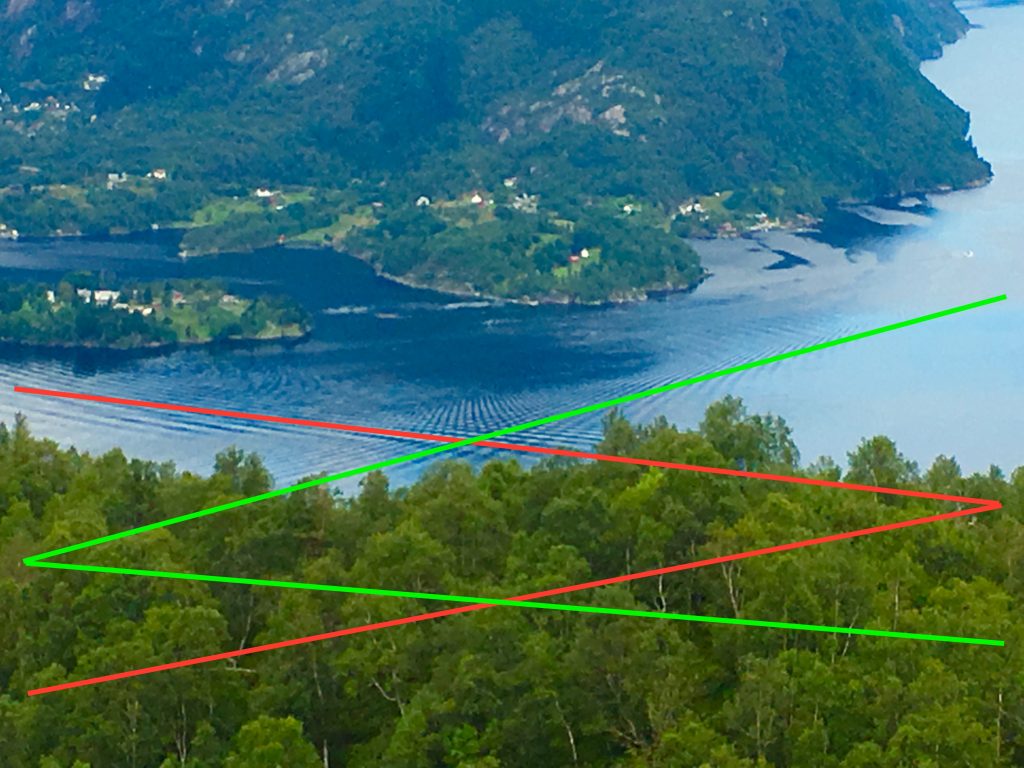
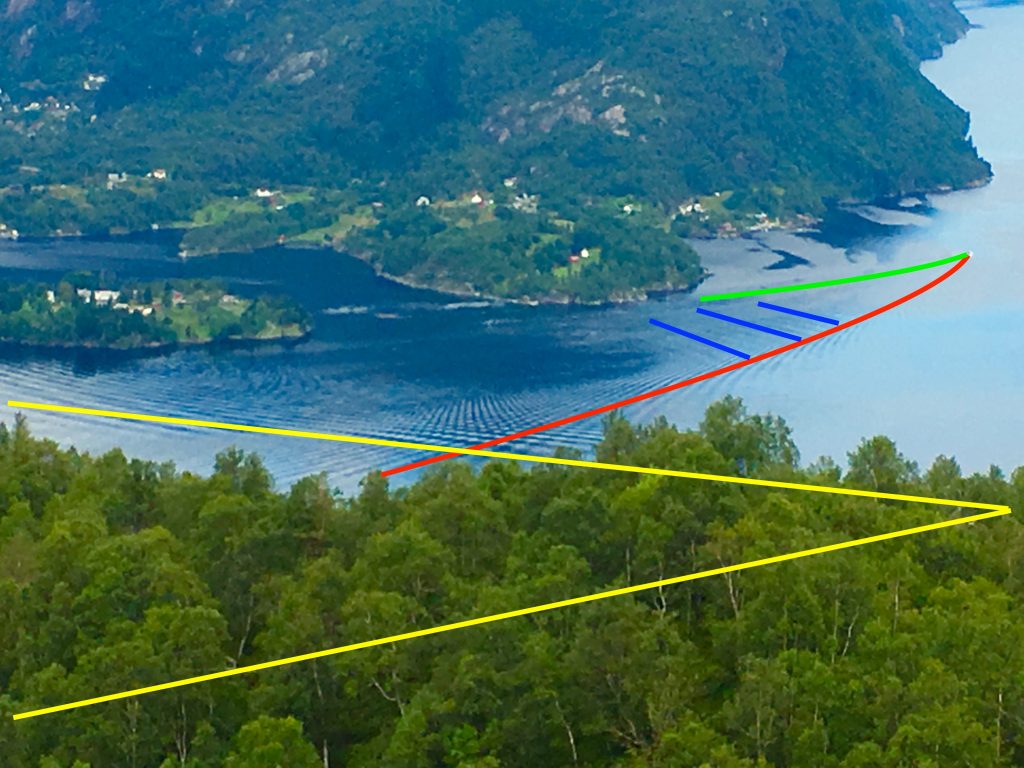
So I know there were two ships causing the waves. But which way were they going? So my first guess was two ships going in opposite directions. I’ve drawn the edges of their wakes into the picture below (ship 1 green, ship 2 red), the ships would now be more or less at the pointy end of each of the Vs.

fullsizerender-copy

But then I noticed the waves that I drew in blue in the picture below. Could they be part of the wake if a ship? And could that white spot in the picture actually be said ship? Then ship 1 would actually be going in the opposite direction of what I first thought. So one side of the wake would be what I have indicated in red below, and that side I can actually see in the picture (and I am fairly confident now that that’s the correct interpretation, judging from the shape of the feathery winglets). The green second part of the wake is just my guess of where it would have to be if my idea of where the ship is is correct.

Ship 2 (now shown in yellow) is still going the way I thought it was. Phew ;-)

fullsizerender-copy-3

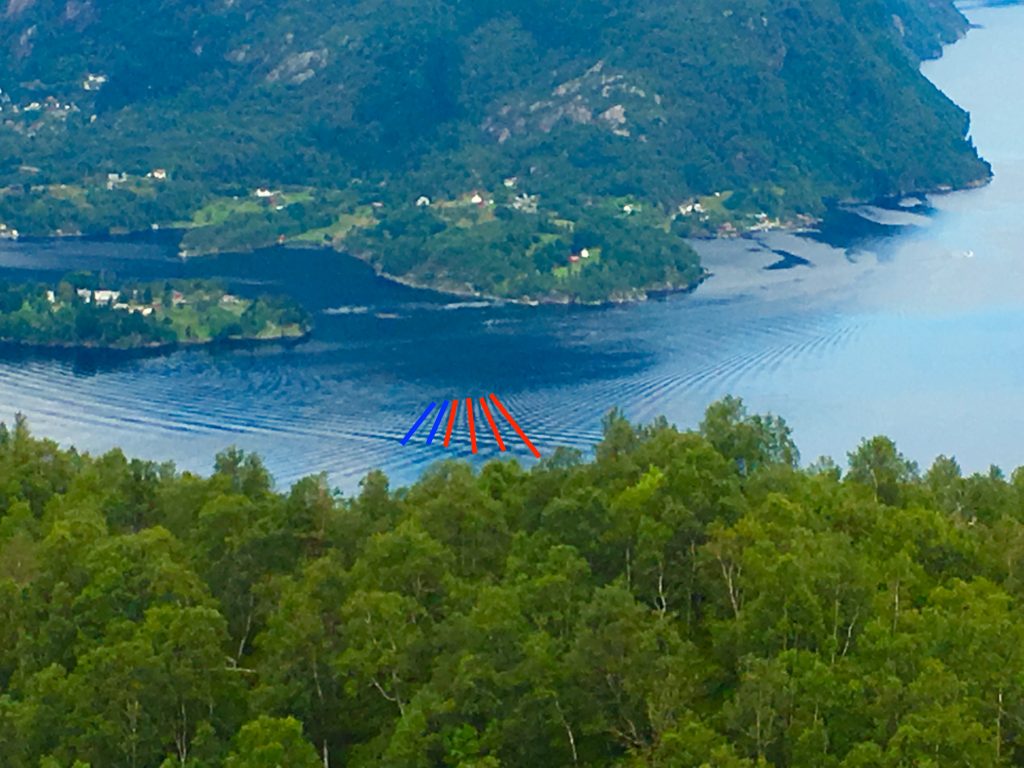
But there is one part of the picture that I think is especially cool: The actual interference part where parallel wave crests seem to appear out of nowhere (crests marked in red below, troughs in blue). This is a possible mechanism for the creation of those parallel wave crests marked in blue above, too, but I don’t think that that’s what had happened there. But I am confident that that is what happened for those waves marked below.

fullsizerender-copy-2

Now it’s your turn, Elsa and Pierre. Do you remember what was going on? How well am I doing interpreting waves? ;-)

This is SO MUCH HARDER than seeing stuff in pictures I took myself and remember the situation! You poor guys always seeing my pictures without good explanations of what is going on on them. I think I might have learned my lesson here…

Tagebuch – Tag 7

Von Carolin und Marie

Am heutigen Tage wurden auch das Salz, die Dichte und die Wellen endgültig überführt. Das, was jetzt noch alles abschließt, ist die morgige Gerichtsverhandlung.

Darauf haben sich alle Detektive genauestens vorbereitet und sie haben sich überlegt, wer welche Beweise im Gerichtssaal vorstellt. Genauere Details werden aber Morgen noch geklärt.

Die Salzüberführung erfolgte, indem die zugeteilte Lehrlingsgruppe herausfand, wo das Salz seine Finger mit im Spiel hatte. Dieses Experiment nannten sie Salzfinger.

Langsam wurden die drei mutigen Lehrlinge, die schon die ganze Zeit die geheimen Versuche der Meisterdetektive beobachtet hatten, ungeduldig. Als sie den Meisterdetektiven ein weiteres Mal zugeschaut hatten, durften sie sogar selbst Hand anlegen.

Bald müssen sie sich jedoch verabschieden und ihren eigenen Weg durch das gefährliche, aber spannende Leben gehen. Sie werden noch viele weitere hundert Male mit Schiffen zum Tatort reisen und auch noch viele weitere Täter schnappen.

Das war`s für Heute und bis Morgen,

Eure Berichterstatter.

Tagebuch – Tag 6

Von Carolin und Marie

Heute haben sich die Lehrlinge gegenseitig ihre beantworteten Fragen vorgestellt. Vollständig überführt wurden zurzeit das Klima und die Strömungen, die Gezeiten und das Eis. Beim Salz und der Dichte, sowie bei den Wellen, sind noch einige wenige Fragen zu klären. Die Übrigen Lehrlinge beantworten nun einige Fragen, denen kein Täter zuzuordnen war. Sie beschäftigen sich jetzt mit der Plattentektonik, der Corioliskraft und einigen anderen, kleinen Themen.

Doch am heutigen Tage haben die anderen Lehrlinge nichts von Meisterdetektiven Glessmers geheimen Versuch mitbekommen. Auch am heutigen Abend haben die Meisterdetektive wieder ein geheimes Experiment durchgeführt, wobei die drei neugierigen Lehrlinge sie gesehen haben, doch sie wissen dieses Mal nicht genau, worum es sich dabei handelt.

Tagebuch – Tag 5

Von Carolin (12) und Marie (13)

Am heutigen Tage wurden die gesammelten Hinweise genauestens dokumentiert. Dann begannen die Lehrlinge ihren Tätern weiter auf die Schliche zu kommen.

Es wurde getestet, ob der Täter Welle ein Problem mit Steinstränden hat. Der Täter Gezeiten wurde auf die Verteilung des Meeresgrundes geprüft. Den Strömungen wurde nachgewiesen, dass ihr Schwachpunkt Hindernisse sind. Weiterhin wurden mit dem neuen Wissen mehrere spannende Experimente geplant und vorbereitet.

Am frühen Abend kamen die Kollegen der Meisterdetektive mit ihren Lehrlingen und sie haben sich gegenseitig ihre bisherige Arbeit präsentiert.

Doch spät am Abend konnten einige Lehrlinge noch nicht schlafen, schlichen sich ins Labor und entdeckten Meisterdetektiven Glessmer, wie sie noch ein geheimes Experiment durchführte. Sie sind bis jetzt die einzigen, die das Ergebnis dieses Experiments kennen.

Tagebuch – Tag 4

Von Carolin (12) und Marie (13)

Heute war der Tag der Tage: Die Detektive sind mit dem Forschungsschiff Uthörn zum Tatort gereist.

Zuerst mussten die Lehrlinge sehr früh aufstehen und dann mit dem Bus zum Hafen fahren. Dort sind sie auf das Forschungsschiff gegangen und die Matrosen haben ihnen die Sicherheitsregeln noch einmal vor Ort erklärt.

Dann der große Moment:

Die Uthörn legt ab und fährt geradewegs durch die magische Schleuse, kaum war das Schiff in einem kleinen Teil eingeschlossen, sank der Wasserspiegel auf mysteriöse Art und Weise.

Nun waren sie am Tatort angelangt und die Arbeiten konnten beginnen:

Es wurden viele Hinweise gesammelt und dokumentiert. Zum Beispiel wurden dem Ozean mehrere Speichelproben ( Wasserproben J) entnommen und ins Identifizierungslabor mitgenommen. Außerdem wurde mit selbstgebauten Windmessgeräten der Atem des Ozeans geprüft. Außerdem wurden kleine Zeugen, die im Ozean leben, aufs Schiff berufen. Nach diesem Tag wurde der Wissensdurst der Detektivlehrlinge gestillt und sie werden diese Hinweise in den nächsten Tagen auswerten und somit den Täter überführen und festnehmen. Den Detektivlehrlingen wünschen wir bis dahin alles Gute!!!

Tagebuch – Tag 3


Von Carolin (12) und Marie (13)


Am heutigen Tage waren die Lehrlinge wieder besonders fleißig, denn sie mussten sich auf die spektakuläre Reise zum Tatort vorbereiten. Doch bevor dieses geschah, haben sie noch eifrig Indizien gesammelt.

Die Gruppe, die sich mit dem Täter Eis befasste, hat die Dauer der Tat festgestellt. Der Täter Strömungen wurde mit einem Farbenspiel überführt. Am Nachmittag waren dann die großen Vorbereitungen im Gange: Die Lehrlinge teilten sich in neue Gruppen auf und planten ihre Tatortuntersuchung. Genauere Details können leider noch nicht angegeben werden, da dies zurzeit noch streng geheim ist!!! Meisterdetektiv Vogt hat den Detektivlehrlingen aber schon erklärt, wie man sich an einem Tatort zu verhalten hat und wie man professionell Beweise sammelt.

Nun werden sie sich gemütlich zusammensetzen und einen Film gucken. J