Tag Archives: guest post

Tagebuch – Tag 1

Mission Ozeanographie

Von Carolin (12) und Marie (13)

Tag 1

Die Meisterdetektive Käse, Vogt und Glessmer wollen 17 neue Lehrlinge in 8 Tagen das Detektivleben im Hauptfall Ozean näherbringen. Kaum sind sie da, werden neue Fälle gemeldet:

Der Ozean hat schon wieder sein Unwesen getrieben und einige Fragen sind noch ungeklärt.

Die Detektive teilen sich in fünf Gruppen auf, die die unterschiedlichen Verdächtigen des Falls bearbeiten.

Nummer 1:

DER MYSTERIÖSE SALZGEHALT + DIE DICHTE

Nummer 2:

DIE STÜRMISCHEN GEZEITEN + STRÖMUNGEN

Nummer 3:

DIE MONSTRÖSEN WELLEN

Nummer 4:

DAS GEHEIMNISVOLLE EIS

Nummer 5:

DAS RÄTSELHAFTE KLIMA

Die Detektivlehrlinge planen schon eifrig die Überführung der Täter. Ihnen wird das Konzept der Fallbearbeitung vorgestellt und sie können es gar nicht erwarten endlich die notwendigen Experimente zur Identifizierung der Täter durchzuführen. Dem Täter wird vorgeworfen, dass er ohne Genehmigung die Kontinente und Landschaften verändert und mehreren Straftätern Unterschlupf gewährt.

Den Verdächtigen werden Hinweise in Form von Fragen zugeordnet und die Aufgabe der Lehrlingsgruppen ist es, diese Fragen zu beantworten und die Täter somit zu überführen.

Nach diesem aufregenden und anstrengenden Tag sind die Detektive erschöpft und gehen zu Bett. Doch bald werden sie wieder aufstehen und eifrig weiterermitteln.


Guest post: Arctic sea ice thinning.

Exciting guest post on a newly published paper by Angelika H. H. Renner.

I’ve met Angelika on a cruise in the Antarctic Circumpolar Current a long time ago where we worked on an instrument together and created an advent calendar to keep up everybody’s morale during the second month of the cruise before flying home on christmas eve, and we’ve since gone white(ish) water kayaking, hiking in the norwegian mountains, visited each other’s institutes, helped each other out in research and teaching crises (mainly Geli helping me out, to be honest ;-), and we are planning an exciting project together. Angelika and coauthors recently published the paperEvidence of Arctic sea ice thinning from direct observations“. In today’s post, Angelika writes about how the observations that went into the paper were obtained, and I am excited to share her story – and her amazing photos – with all of you.

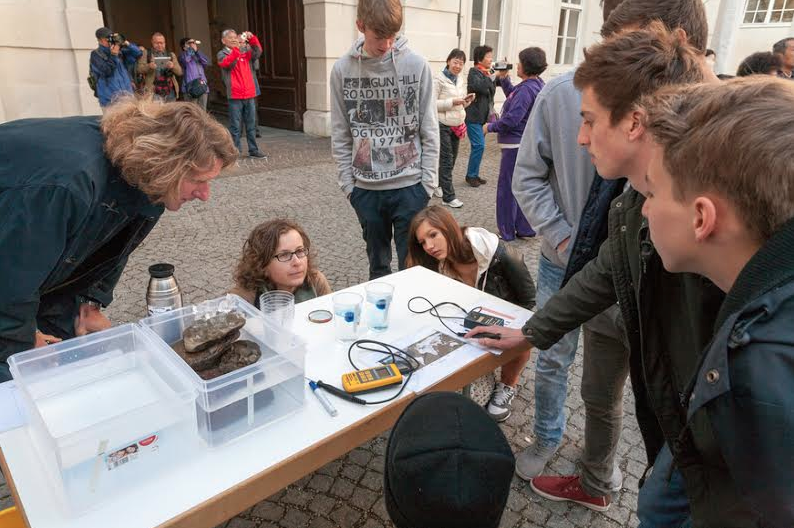
There’s been so much liquid water on Mirjam’s blog lately, I was happy to take her invitation for a guest blog to bring back some of the most amazing, interesting, and beautiful variation of sea water: sea ice!

Sea ice comes in various shapes, from very flat, smooth, and thin sheets of newly formed ice to huge ridges several tens of meters thick. Assessing the thickness of the sea ice cover in the Arctic remains one of the biggest challenges in sea ice research. Luckily, methods become more refined, and numbers derived from satellite measurements become more accurate and reliable, but they don’t cover a long enough period yet to say much about long-term changes.

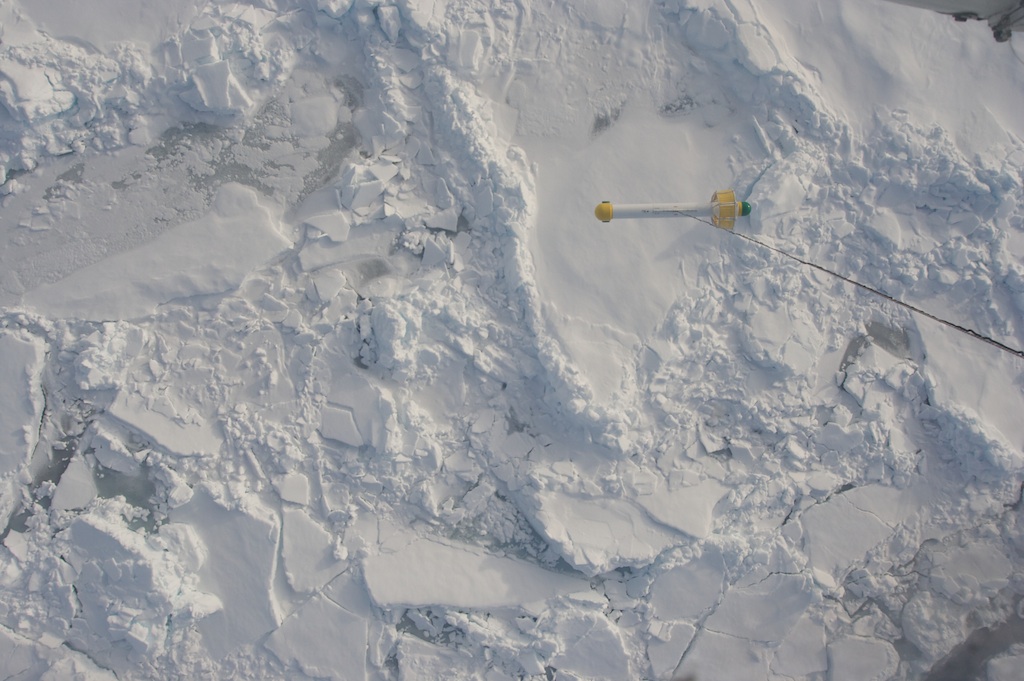
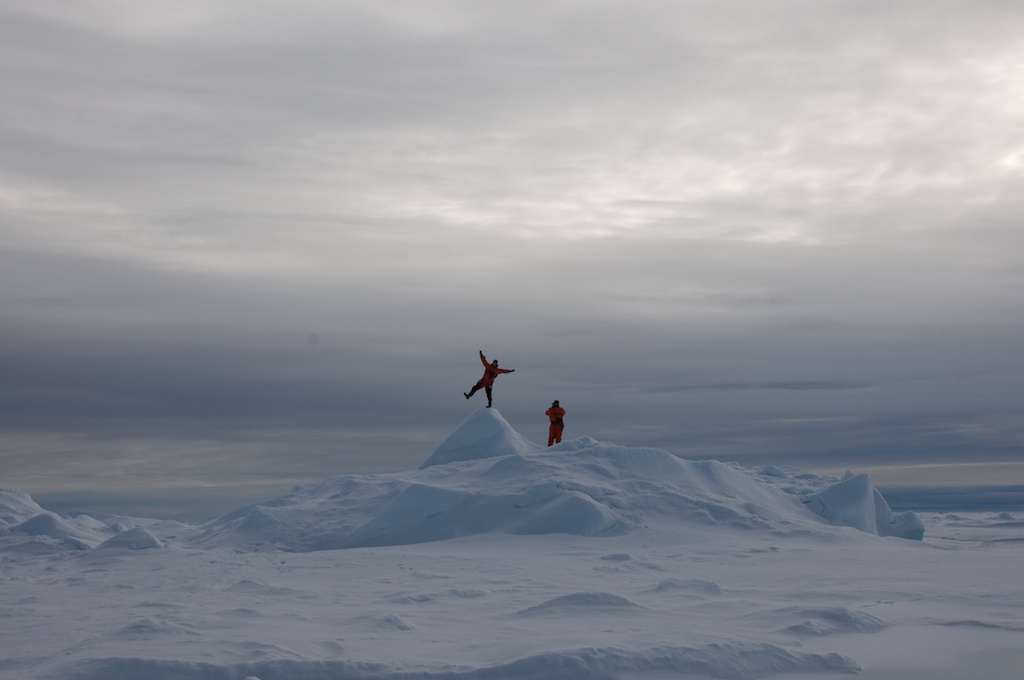
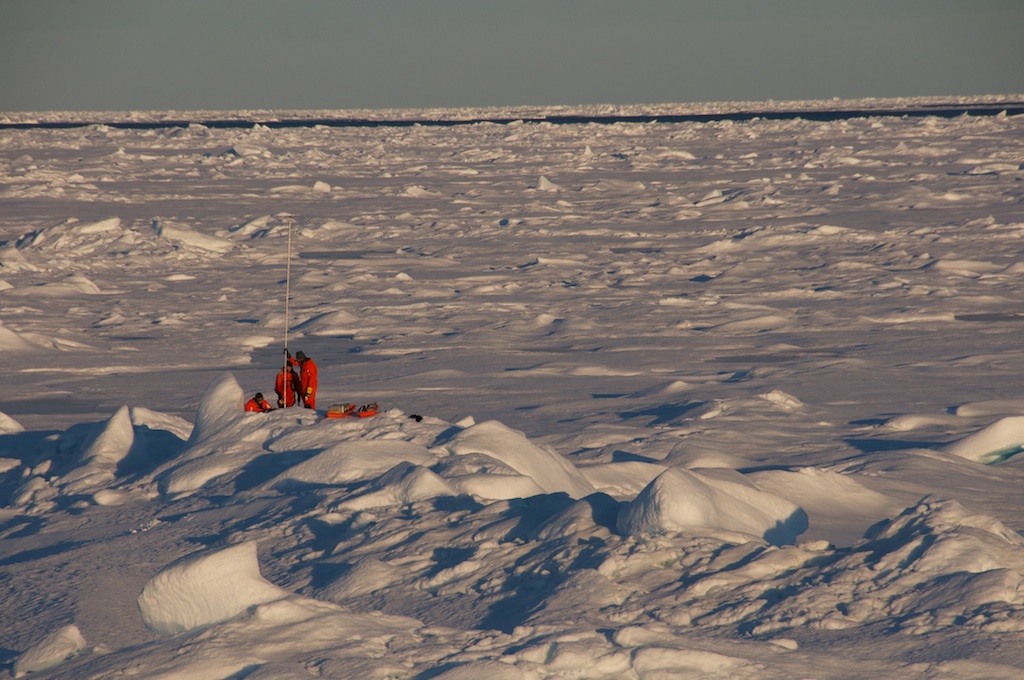
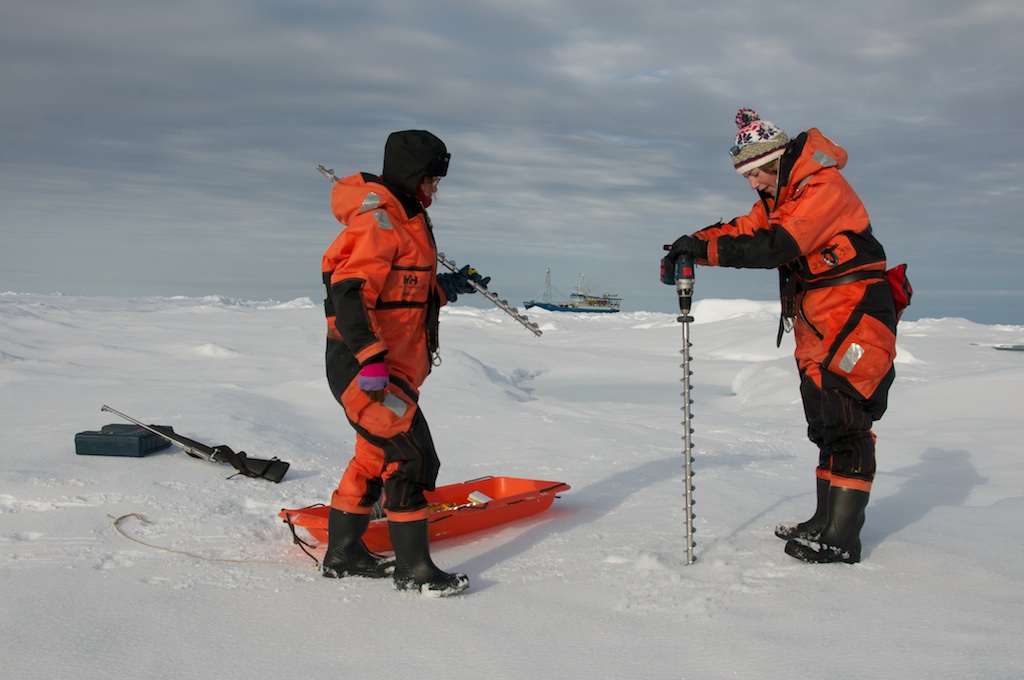
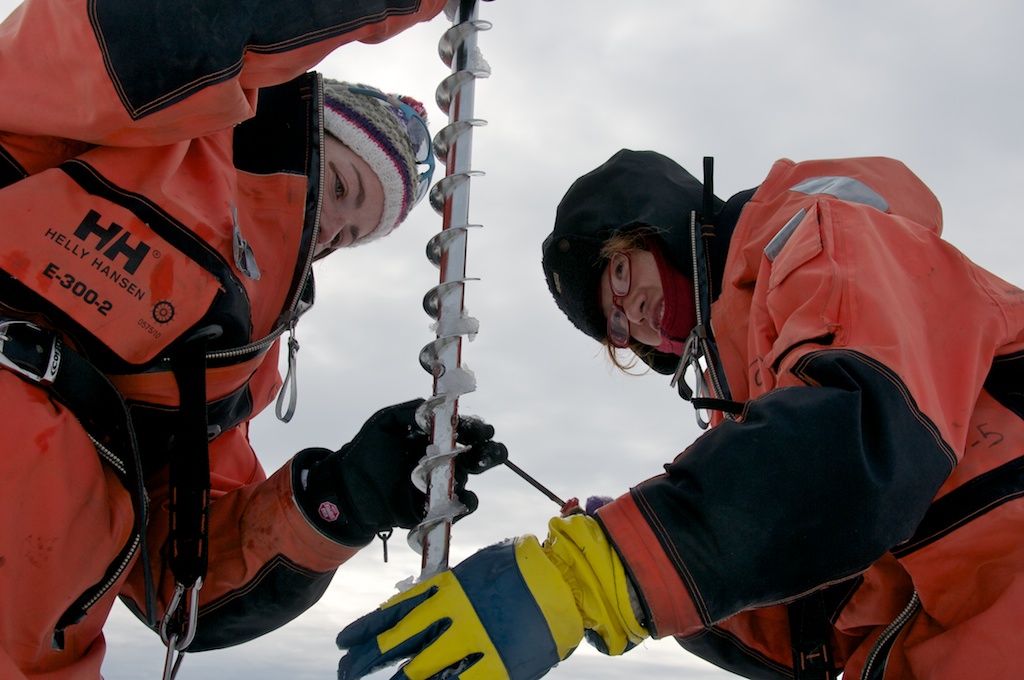
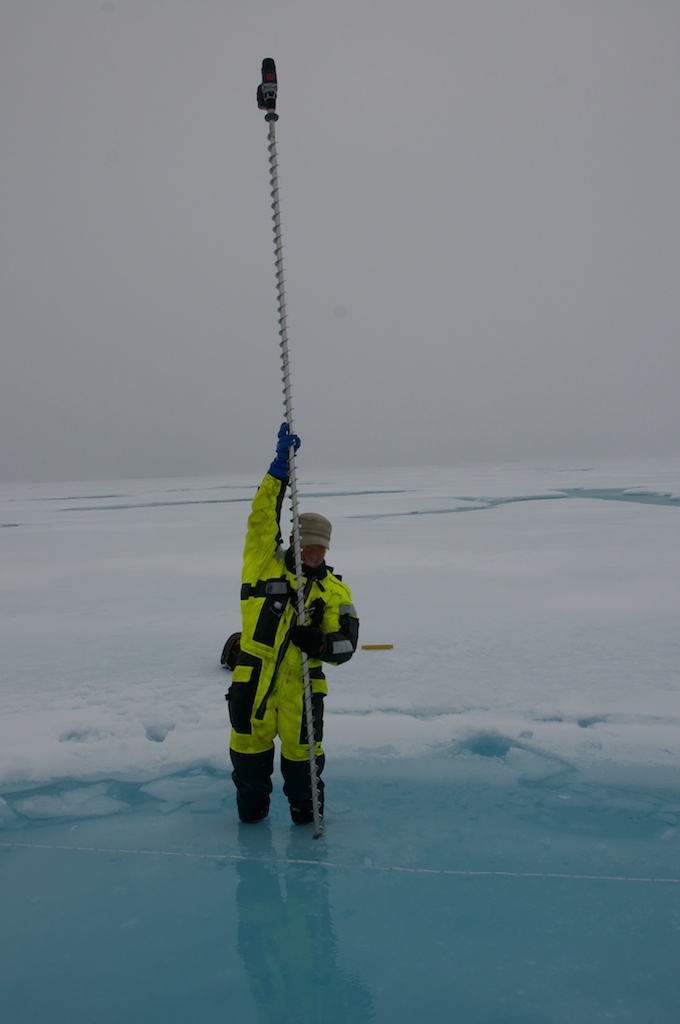
My first proper science cruise in 2005 went to Fram Strait, the region between Greenland and Svalbard. I learned how to measure sea ice thickness the hard way: drilling holes. And more holes. And even more holes. Or the slightly-less-hard way: carry an instrument around that uses electromagnetic induction to measure ice thickness (since sea ice is much less salty than sea water and therefore much less conductive). This instrument is called ”EM31” and we kept joking that the number comes from its weight in kilograms…. So, using drills and the EM31 we measured on as many ice floes as we could and given that the cruise went all the way across Fram Strait, that gave as quite a few datapoints covering quite a large area.

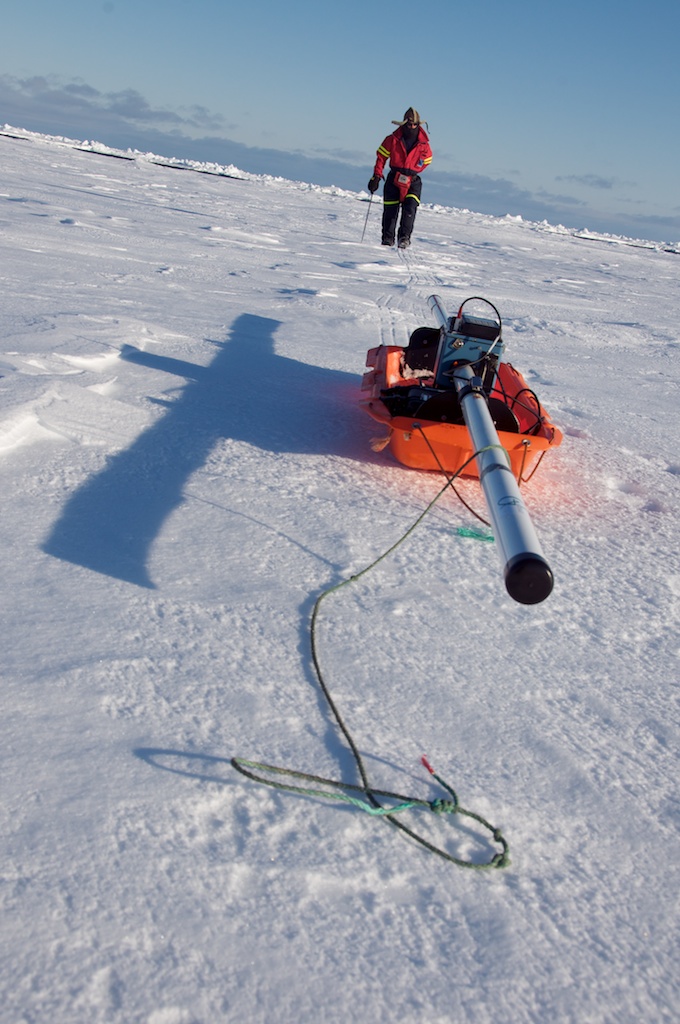
These measurements have been done by the sea ice group at the Norwegian Polar Institute every summer since 2003, and in some years also in spring. It takes dedication to build such a time series! When we could, we also used an airborne version of the EM31, the EM-bird, to do surveys over larger areas. Now, finally, the results of all these measurement have been processed, and analysed – and what do we see? The sea ice in Fram Strait is thinning a lot. Depending which measure you use (nothing about sea ice thickness is straight forward…), the ice has thinned by more than 50% over the 10 years from 2003 to 2012!

It’s one thing to know that it has thinned, but it’s a lot more interesting to find out why. Fram Strait is a special place: Most of the sea ice that is formed somewhere in the Arctic Ocean (and doesn’t melt there again) leaves the Arctic through Fram Strait. It is a very dynamic region with strong currents and winds, which results in a lot of deformed ice regardless of its age. The extent of the ice cover here is not necessarily linked to the development of the ice in the Arctic Basin – most prominent example was the heavy ice year in Fram Strait 2007 whereas this was up to then the year with the lowest Arctic-wide ice extent in the satellite era.

We looked in more detail at where the ice came from and found that this, too, does not correlate with our thickness time series. While the source region of the ice varied from year to year, it was continuously thinning – in our opinion a sign that the thinning occurs Arctic-wide.

A lot of effort went into this paper and the dataset behind it, and I was very very lucky that I got the opportunity to participate in several of the cruises, do the data analysis and write the paper. It’s even more satisfying to see your work published when you know how much work drilling all those holes was……

Guest post: The 5-minute warning of a summer’s day sudden end.

More bad weather in Hamburg.

Today I have the pleasure to announce a guest post by Torge Martin. Torge, together with J&J, came to visit Hamburg recently, and we got stuck in some pretty bad weather. Which, being the oceanographers and meteorologists we are, meant that we got very excited, took about 100 pictures each, and me talking Torge into writing about what actually happened there. Which he did! So without further ado – enter Torge!

The 5-minute warning of a summer’s day sudden end.

Guest post by Torge Martin

A week ago we spent a wonderful day with Mirjam in Hamburg touring the harbor and downtown – very touristy. It was sunny and pretty hot for the average northern German. In the early afternoon the thermometer hit 28˚C. Perfect conditions for eating a big cup of ice cream at the Binnenalster, jumping on a Barkasse (little boats that ship tourists around the harbor) to catch at least a slight breeze, and for … a gorgeous thunderstorm.

When we climbed the 429 steps of the Michel (St. Michael’s tower) later in the afternoon we didn’t know that this was perfect timing to witness an impressive natural spectacle: The sky darkened quickly in the West and Southwest and within minutes a dramatic cloud formation took over the scene.

fig1b_IMG_6006_s

Photo by Torge Martin.

fig1a_IMG_6001_s

Photo by Torge Martin.

The horizontal “roll” across the picture (below the bright stripes) is a so-called shelf cloud that marks the leading edge of the approaching thunderstorm. In German such a cloud is often called Böenkragen (“gust collar”) or Böenwalze (“gust roll”), which hints at its shape and the strong winds that it is accompanied by.

How does such a shelf cloud form? I won’t go into all details of thunderstorm formation. The high cumulonimbus clouds of typical summertime thunderstorms are formed by strong, thermally driven updraft. Updrafts can reach vertical velocities of 50 km/h. When the moist air is cooled at higher levels, say at 6-9 km, condensation starts, and water droplets or ice crystals form. The droplets begin to fall within the cumulus cloud simply due to their weight and pull the ambient air with them along their way. This forms a downdraft, which is typically found in the rear part of the cloud while updraft still dominates the front side of the cloud. The downdraft flow spreads out horizontally near the ground and often comes with strong gusts at surface level. Since downdraft air is much cooler than the surrounding warm summer air, its spreading is associated with a cold front. The latter rapidly pushes upward the warm, moist surrounding air. As the warm air is lifted condensation may occur, which we then observe as a shelf cloud marking the leading edge of the gust front. On the ground we typically feel the downdraft from a thunderstorm as a drop in temperature and strong winds—in our case the 10-minute averaged wind speed peaked at 44 km/h and temperature dropped by 5˚C—while a change in wind direction and increase in air pressure can also be observed.

The shelf cloud, however, is not only beautiful and fascinating to observe, it also is nature’s “5-minute” warning to stop playing and go home (or find another safe place) before strong gusts and downpour hit.

In our case rainfall was heavy enough to reduce visibility from about 15 km to a mere 2 km. The rain was pushed horizontally through the tower top hurting on the skin. The crowd remaining at the top huddled together on the lee side of the hut, which shields the staircase from the elements. The gusts picked up dust from a nearby construction site in the harbor

fig2_IMG_6023_s

Photo by Torge Martin.

which probably helped the dramatic coloring of the lee side scenery. But that’s a different story …

fig3_IMG_6029_s

Photo by Torge Martin.

Data kindly provided by http://www.wetter22459.de

figsupplementary_IMG_6018_s

Photo by Torge Martin.


Guest post: The mystery of the cold room

Guest post by Kristin Richter!
Today I’m excited to bring to you a guest post from Innsbruck, Austria, written by my friend Kristin Richter. Kristin ran the oceanography lab in Bergen before I took over, and she is a total enabler when it comes to deciding between playing with water, ice and food dye, or doing “real” work. Plus she always has awesome ideas of what else one could try for fun experiences. We just submitted an abstract for a conference together, so keep your fingers crossed for us – you might be able to come see us give a workshop on experiments in oceanography teaching pretty soon! But now, over to Kristin.
A little while ago, I made an interesting experience while presenting some science to students and the general public on the “Day of Alpine Science”  in Innsbruck using hands-on experiments. Actually, my task was to talk about glaciers but being a physical oceanographer I felt like I was on thin ice. Well, glaciers, I thought, hmmm … ice, melting ice, going into the sea, … sea, … sea ice! And I remembered how Mirjam once showed a nice experiment to me and some friends about melting ice in fresh and salt water. And suddenly I was all excited about the idea.
To at least mention the glaciers, I planned to fill two big food boxes with water, have ice float (and melt) in one of the tanks and put ice on top of a big stone (Greenland) in another tank filled with water to show the different impact of melting land ice and sea ice on sea level. Since melting the ice would take a while (especially on a chilly morning outside in early April) I would have enough time to present the “actual” experiment – coloured ice cubes melting in two cups of water – one with freshwater, and the other one with salt water.
Screen Shot 2014-04-24 at 12.17.01

Melting ice. A comparison of sea ice and glaciers melting’s impact on sea level, ice cubes melting in fresh and salt water on the right. Photo by “Forschungsschwerpunkt Alpiner Raum”, University of Innsbruck.

As we expected many groups with many students, I needed a lot of ice. I told the organizers so (“I need a lot of ice, you know, frozen water”) and they said no problem, they will turn on their cooling chamber. The day before, I went there and put tons of water into little cups and ice cube bags into the chamber to freeze over night.The next morning – some hundreds of students had already  arrived and were welcomed in the courtyard – I went to get some ice for the first group. I opened the cooling chamber,… and froze instantly. Not so very much because of the cold temperature but because I was met by lots of ice cube bags and little cups with… water. Like in LIQUID WATER! Cold liquid water, yeah, but still LIQUID! Arrrghhhh, my class was about to begin in a few minutes and I had NO ICE. “Ah, yes”, volunteered the friendly caretaker, “come to think of it, it is just a cooling chamber!”I started panicking, until a colleague pointed out the Sacher Cafe (this is Austria after all) and their ice machine across the road. I never really appreciated ice machines, but that one along with the friendly staff saved the day. Luckily, I brought some colored ice cubes from at home – so I was all set to start.

Screen Shot 2014-04-24 at 12.16.50

Ice melting in fresh water (left) and salt water (right). Photo by “Forschungsschwerpunkt Alpiner Raum”, University of Innsbruck.

And the station was a big success, the students were all interested, asked many questions and were excited about the colored melt water sinking and not sinking. :-)  I even managed to “steal” some students from the neighboring station of my dear meteorology colleagues. That was something I was particularly proud of as they could offer a weather station, lots of fun instruments to play with and a projector to show all of their fancy data on a big screen. (Actually, I also abandoned my station for a while to check out their weather balloon.)

Anyway, I had a lot of fun that day and could definitely relate to Mirjams enthusiasm for this kind of teaching. I can’t wait for the next opportunity to share some of those simple yet cool experiments with interested students. I will bring my own ice though!