Tag Archives: CMM31

Q&A pairs

Have students group in pairs, develop and answer questions.

It is really hard to come up with exam questions (or even just practice questions) that have the right level of difficulty so that students feel challenged, but confident that they will be able to solve the questions.

One way to develop those questions is to not actually develop them yourself, but have students develop them. So what I did in CMM31 was to ask students to group in pairs of two and develop questions that they thought would be fair exam questions. So they should be difficult enough that students have to think and employ a lot of what they learned during the course, but they should not be so difficult that they are impossible to answer.

You would think now that students would come up with really easy questions in order to trick you into giving an easy exam, wouldn’t you? There is a way to avoid this: After students have developed the questions in pairs (and made sure they know the correct answer), you can go around the room and have everybody share their question with the rest of the group (see? now having a difficult question makes you look smart!). The rest of the group answers the question, the person who asked the question has to say whether they are happy with the answers, or add to the answers if they feel like important aspects were not mentioned. Plus since there is an instructor in the room, he or she can always comment on the answers.

I usually say I give the students 10 minutes to come up with the questions (so 5 minutes each) and it then ends up being something like 6 or 7 minutes each. Since I’m sitting in the same room and listening in on the conversation, I can adapt the timing so it works best. Then it usually takes about 3 minutes to answer each of the questions so that everybody, including the instructor, is happy. So depending on the size of your group you might want to split the group into smaller groups so that exercise doesn’t take up too much time.

I find that using this Q&A pair method gives me a pretty good insight into what concepts students perceive as difficult, and how well the group as a whole can answer the questions. Since it is not the instructor asking the question, it seems to be much easier for students to throw in ideas (and I make sure that as the instructor I am not standing in front of the class, and when students start talking to me rather than the group, I point out who asked the question and that they should be talking to that person).

It does take up a lot of class time, but it is using class time for concepts that students feel are important and worth talking about.
Traveling circus

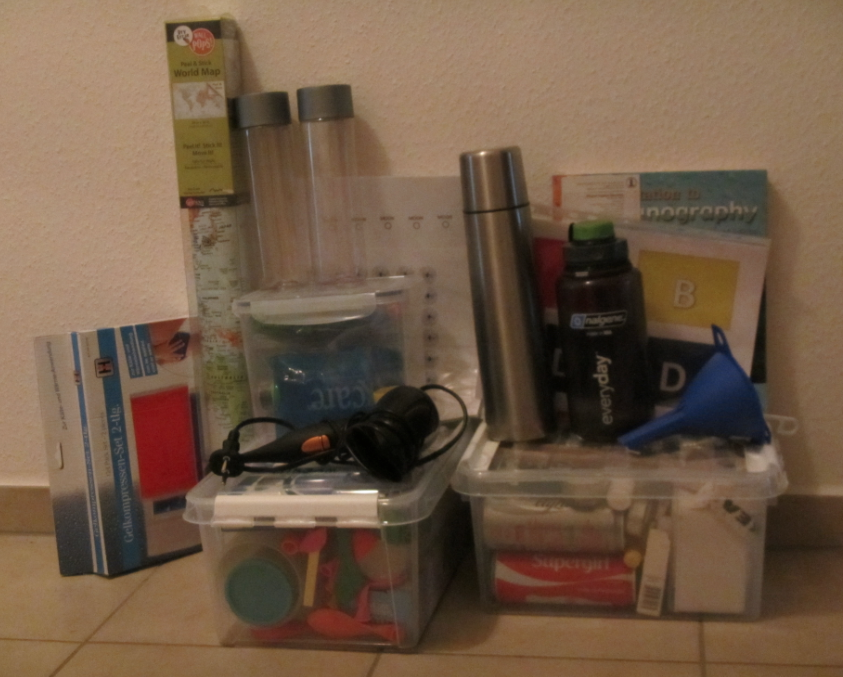
Stuff that I  brought to Isafjördur to teach the intro to oceanography.

I’ve been a fan of minimalistic travel for a while. And apparently I was ready for a new challenge: Minimalistic travel but with the full equipment for experiments in oceanography! Sadly I didn’t manage to carry on even though I tried…

Stuff that I’m bringing with me to teach “intro to oceanography”.

It might not look like too much, but you’ll be pleased to know that with this equipment, I can show every experiment I’ve shared on this blog so far (with the exception of the ones in the long internal lee wave tank) plus at least a dozen or so that are still in the pipeline to be published on here (I have lost track of what I have shared and I’m too lazy to look it up now, sorry).

IMG_4617

Granted, I did send a list of stuff that I’ll need to Isafjördur, too, and asked them to organize those things for me. But on that list there are only things like paper towels, empty 1.5l bottles or matches – hence things that are very easy to obtain anywhere, but a pain to travel with. I’m bringing all the fancy stuff like high-intensity non-toxic dyes, modeling clay, clear straws (surprisingly difficult to find!), split pins, wooden tongs, heating&cooling pads, an inflatable globe and many more.

So who wants to invite me to come teach at their place? I also “train the trainers” if you want to learn how to do all of this awesome stuff and then teach your students yourself!

Interference of waves.

Movie on wave interference – two wave fields arriving perpendicular to each other, interacting and leaving.

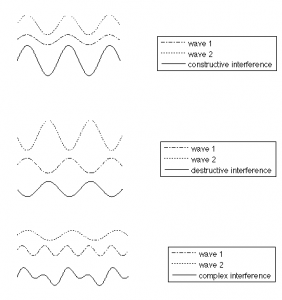
When talking about waves, it is often difficult to explain that wave heights of different components of a wave field can be added to each other to give a resulting wave field, but that each of those components continues to travel with its own direction and speed and comes out of the wave field basically unaltered. Students learn about constructive, destructive and complex interference (see image below), but it is hard to realize that those interactions are only momentary.

Constructive, destructive and complex interference of waves.

When I was on my way up to Isafjördur to teach CMM31, my friend Astrid and I happened to find the perfect example for the phenomenon described above. We were in Gardur in southwest Iceland and took a sunset walk to the lighthouse.

Old lighthouse in Gardur, southwest Iceland.

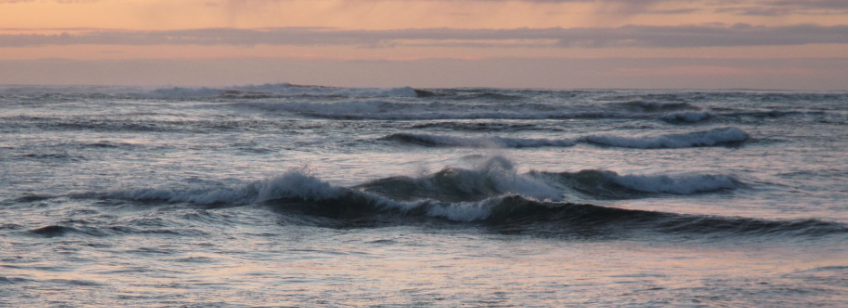
The lighthouse is located at the end of a pier and we observed a spectacular wave field. Two distinct fields were meeting each other at an almost 90 degree angle, interacted and left on the other side still clearly recognizable.

Two wave crests meeting at approximately 90 degree angle.

The waves met, interacted, and left the area of interaction. Watch the movie below to get an impression!

Standing waves.

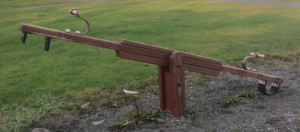
A seesaw to visualize how standing waves move in an enclosed basin.

In enclosed basins, standing waves can occur. In the simplest case, they have a node in the middle and the largest amplitudes at the edges of the basin. The movement of the water’s surface then closely resembles that of a seesaw.

IMG_5059

A seesaw. Largest amplitudes at the ends, node in the middle.

Extremely simple but extremely effective visualization!

Long-distance teaching.

My experiences with giving a lecture via Skype.

As I mentioned in yesterday’s post, I taught two lectures at the University Centre of the Westfjords, Iceland, in 2012 while physically being in Norway. How did that work out?

Teaching via Skype is a great option for when travel is not in the cards, be it for environmental, economic or other reasons. But I can tell you – it is a lot more stressful than teaching in person because you miss out on all of the non-verbal clues that tell you whether or not students are following. But I would do it again any time!

Why did it work out well? I think there were several important factors. In no particular order:

1) I over-prepared. I tend to be over-prepared, but in this case I put a lot of time into preparations, and I even talked through both lectures with a friend to make sure they were structured in a way that was easy to understand.

2) I had all the important key words on the slides. I always try to make sure to have key words on my slides so students can write down any weird technical terms that I might use and forget to explain, but in this case I defined everything on the slides.

3) I had an ally physically present in the class room. I think this was probably the most important reason for why things worked out really well and why my stress levels didn’t go through the roof when we realized that the internet connection was too weak for a two-way video. When departing for a research cruise from Reykjavik and visiting someone at their marine research institute, I happened to walk into the lab of the person who was responsible for the course, Hrönn. Hrönn and I clicked immediately and so while I was on Skype talking to the class, I knew I could rely on her to make sure things went well on the other end and to give me all the crucial information that would otherwise not have been communicated – if students got bored, if students looked like they did not understand, if everybody had left the room and left me sitting there, talking, if the connection was so bad people couldn’t understand me, etc.. Even though in the end she did not have to do anything, it helped enormously to know that she was there and would let me know if things went wrong.

4) I introduced myself to the students. I put up a picture of myself, talked about my background, where I was living, why I was interested in oceanography, why I was skyping in to give the lecture. During the lecture, I mentioned examples of how the topic was relevant to my personal life and told stories of my own experiences. Teaching via Skype adds a lot of distance – I tried to still be visible as a person and connecting on a personal level as much as possible.

5) I sent the slides before the call. This might seem obvious, but it really helped to know that they had the slides in Isafjördur already and that in the worst case if the internet were to break down, I could just deliver my lecture via speakerphone.

6) The slides were numbered with clearly visible numbers in one corner. Again, it might seem obvious, but it was really helpful to be able to say “go to slide 16” rather than having to go through “go three slides back, see the diagram? No? Then try going back one more. Still no diagram? I’m talking about the slide with ….”.

7) I made sure I could see the students. Since the internet connection was very slow, we could unfortunately not have a two-way video call for the whole duration of the lecture. But what we did was this: They showed my slides via a projector (thankfully they were numbered!), my video stream was initially, until the connection became too slow, shown on a laptop that was moved to face the class, and I could see the class via that laptop’s webcam. I could only see shapes and not distinguish facial expressions, but when I asked them to nod or shake their head in response to a question, I could see them respond. Next time, I would maybe even try using the ABCD card method or some other way to get more direct feedback in a Skype lecture.

8) We had tested the technology before. We knew what part of the classroom was visible via the webcam so we could ask the students to sit there, we had tested connecting via Skype, we had the telephone numbers on hand as a backup and we “met up” in Skype a couple of minutes before the lecture was supposed to start. But maybe this should go under the “over-prepared” heading.

All in all – I can’t stress the importance of preparation enough, and if you are to teach via Skype: Make sure you have someone in that class that you know and trust to be your ear on the ground to let you know if things don’t go the way they are supposed to.

And have fun! In the evaluation of that course, people explicitly mentioned my lectures as a highlight of the course, and I got really positive feedback. So teaching via Skype might be a bit of a hassle, but it is definitely possible to teach well via Skype.

Teaching in Isafjördur

Teaching a block course at the University Centre of the Westfjords, Iceland.

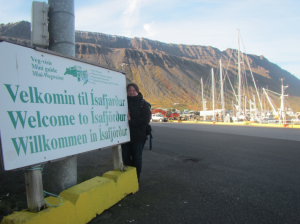
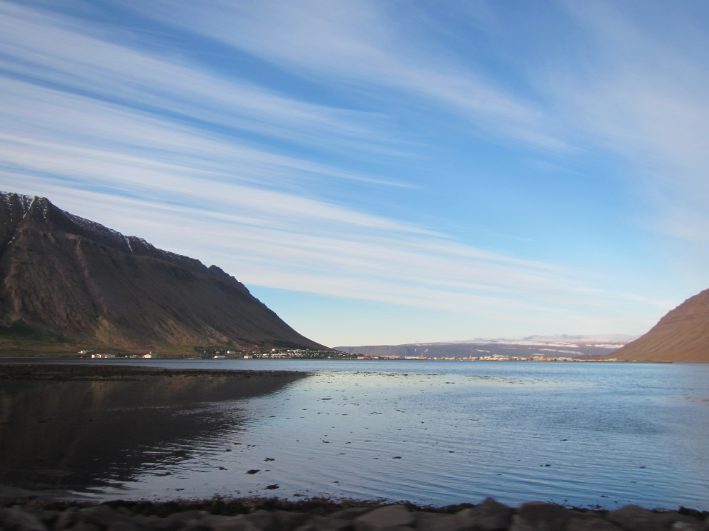
For those of you who were surprised that lately they didn’t recognize my students any more and the view from my office window was greatly improved: I am excited to be in Isafjördur in the Westfjords to teach the first two weeks of CMM31 “understanding the ocean” as part of the Master’s in Coastal and Marine Management.

Welcome to Isafjördur!

I visited the University Centre of the Westfjords by chance, really, when two years ago a research cruise ended in Isafjördur and I got in touch to ask whether they wanted to bring their students on a tour of the research ship. From that a connection developed and I taught two lectures on waves and tides at the University Centre of the Westfjords last year – except that I was sitting in my comfy office in Norway then and taught via Skype [more on how that worked in a later post]. While that was certainly an experience, this time I am actually physically present, and I’m very glad about that.

Isafjördur.

When preparing for the course I got an email from Dagny, the program’s academic director, who wrote “You will find that this is not a typical uni environment, hopefully in a good way.” And she was so right! It is not a typical university environment, but in the best way. I am so excited to be here and definitely hope to come back again next year! :-)

P.S.: The tag CMM31 marks posts that are about things I’ve been teaching while in Isafjördur.

Dangers of blogging, or ice cubes melting in fresh water and salt water

When students have read blog posts of mine before doing experiments in class, it takes away a lot of the exploration.

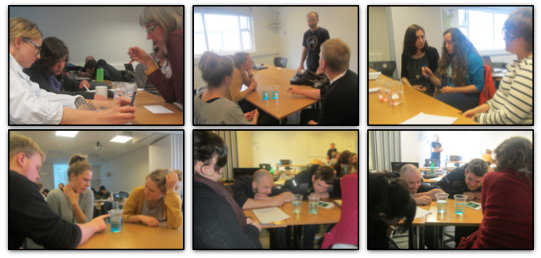
Since I was planning to blog about the CMM31 course, I had told students that I often blogged about my teaching and asked for their consent to share their images and details from our course. So when I was recently trying to do my usual melting of ice cubes in fresh water and salt water experiment (that I dedicated a whole series on, details below this post), the unavoidable happened. I asked students what they thought – which one would melt faster, the ice cube in fresh water or in salt water. And not one, but two out of four student groups said that the ice cube in fresh water would melt faster.

Student groups conducting the experiment.

Since I couldn’t really ignore their answers, I asked what made them think that. And one of the students came out with the complete explanation, while another one said “because I read your blog”! Luckily the first student with the complete answer talked so quickly that none of the other – unprepared – students had a chance to understand what was going on, so we could run the experiment without her having given everything away. But I guess what I should learn from this is that I have taken enough pictures of students doing this particular experiment so that I can stop alerting them to the fact that they can oftentimes prepare for my lectures by reading up on what my favorite experiments are. But on the upside – how awesome is it that some of the students are motivated enough to dig through all my blog posts and to even read them carefully?

For posts on this experiment have a look a post 1 and 2 showing different variation of the experiment, post 3 discussing different didactical approaches and post 4 giving different contexts to use the experiment in.

Why melting sea ice does not contribute to sea level rise.

Simple experiment on why the impact of glaciers and sea ice on sea level, respectively, are not the same.

It could be so simple: An ice cube sinks into water until the mass it replaces is equal to its own mass.

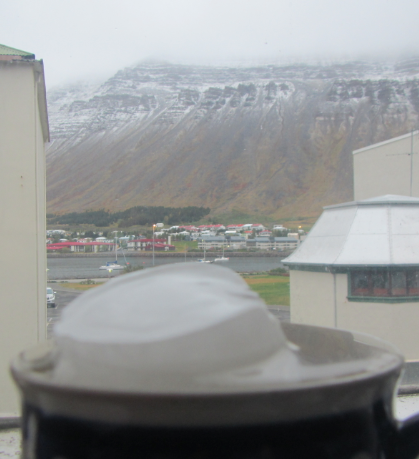
The mug is as full with water as it gets. But even if I stared out of the window at the mountain and the snow until this swimming piece of ice had completely melted – the water level in the mug would not have changed.

Since the mass of said ice cube is not changing when it melts, under the assumption that the difference in volume due to the temperature difference of the melt water and the water in which the ice cube swims is negligible (reasonable assumption in most cases) that means that a swimming ice cube can’t change the water level in a cup and a swimming ice berg can’t change sea level. Things are different for glaciers or other ice that is sitting on land rather than freely swimming.

IMG_5100

I should have thought about how I would transport the plate on which the mug with the ice is sitting back to the kitchen once the ice has melted. In other words: Yes, the mug will spill over.

This is a very easy demonstration and while it is intuitive that in the second case a mug that was completely filled with water when the ice was first added will spill over once the ice melts, the first case seems to be very difficult. Most students are not quite sure what they are expecting to see, and even if they are, they don’t really know why.

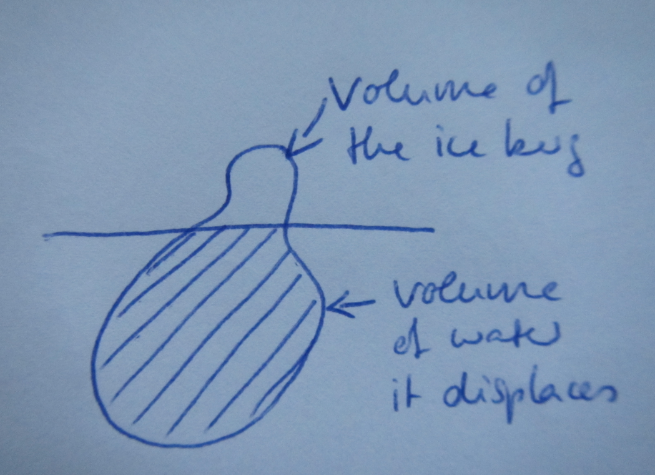
My typical drawing to explain this topic. The potato is supposed to be an ice berg floating in water.

I have always been teaching this by drawing the water level and the ice berg on the board, and then by marking the volume of the whole ice berg and the part of it that is under water, and trying to stress how the mass of the ice berg is the same as that of the water replaced by the part of the ice berg that is under water (because the molecules are more densely packed in liquid water and yada yada) — there must surely be a better way to explain this? Any ideas out there?

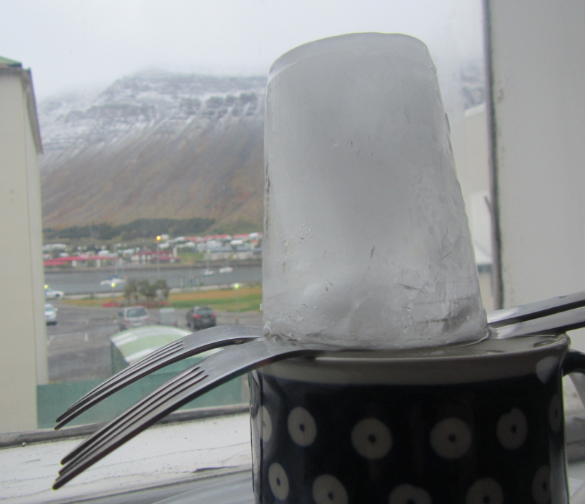
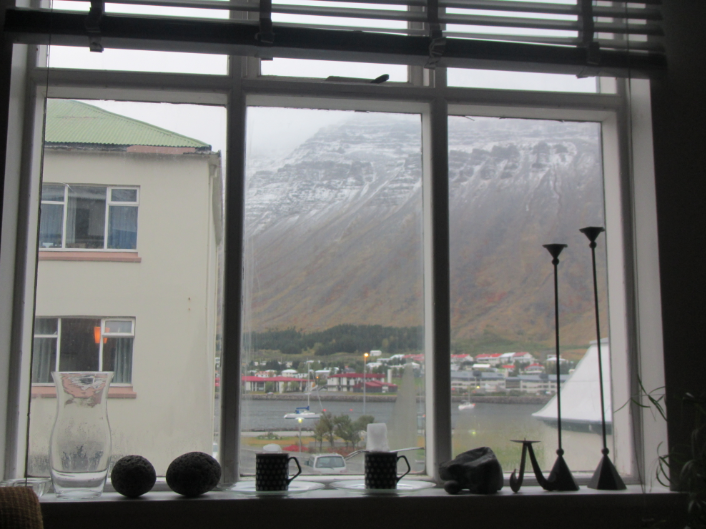
Experiments the Isafjördur way. Can you spot the two mugs and the ice in the middle of the window sill? Floating ice on the left, a “glacier” resting on forks above the water level on the right.

Measuring temperature.

Students build thermometers.

As described in this post, I like to have students build “instruments” to measure the most oceanographic properties (temperature, salinity and density). I find that they appreciate oceanographic data much more once they have first-hand experience with how difficult it is to design instruments and make sense of the readings. Over the last two days I described the experiments for salinity and density, today it’s temperature.

measuring_temperature

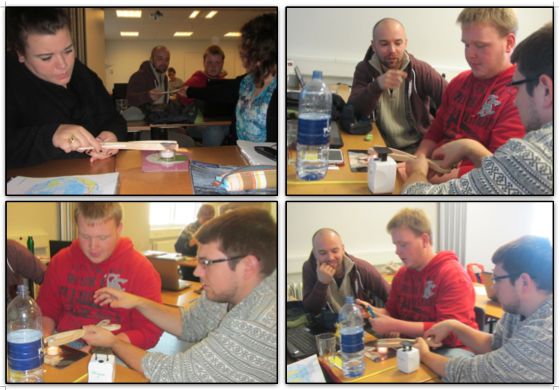
Students building thermometers.

Measuring temperature is probably the most difficult of the three properties. Firstly, there are lots of technical difficulties to be overcome. How can we seal the mouth of the bottle around the straw in a way that it is really water tight? How much water do we have to fill in the bottle? Does it matter if there are air bubbles trapped? What if the water level when we fill the bottle is not visible because of the seal? If the straw is clogged up with modeling clay, will we still be able to use it in the instrument? How long does the straw have to be above the seal in order to avoid water spilling out when the temperatures we try to measure become too hot?

Then, there are many problems connected to the actual measurement. If we lift up the thermometer (and hence squeeze the plastic bottle) – how does that influence our reading? Since we have half a liter of water in the thermometer, are we actually measuring the temperature of the water sample, or are we influencing it while trying to measure? How do we come up with a scale for our temperature measurements had I not supplied (mercury-free) thermometers to calibrate the new thermometer with? So many questions to think about and discuss!

Measuring salinity

Students evaporate water to measure the salinity of a water sample.

As described in this post, I like to have students build “instruments” to measure the most oceanographic properties (temperature, salinity and density). I find that they appreciate oceanographic data much more once they have first-hand experience with how difficult it is to design instruments and make sense of the readings. Today I’m presenting two groups that focused on salinity, while yesterday’s group was measuring density.

Students evaporate water to measure the salinity of a water sample.

The students in the course I currently teach were determined to not only evaporate some water to qualitatively look at how much salt was dissolved in the sample, they wanted to do it right. So they set out to measure the vessel, the sample and the remaining salt. But since measuring salinity is really pretty difficult, they ran into a couple of problems. First – my scales were nowhere near good enough to measure the amount of water they could fit into the evaporation cup with any kind of precision. Second, even the amount of water that they could fit took a lot longer to evaporate (or even boil) than anticipated. Third, they realized that even though they could see salt residue in the end, this might not be all the salt that had been there in the beginning, plus there was grime accumulating at the base of the cup, so weighing the cup in the end might not be the best option. But they still learned a lot from that experiment: For example that once the (small quantity of) water was boiling, it became milky very quickly and then turned to crystallized salt almost instantly. Or that in order to use this method, a tea candle is not as suitable as a heat source as a lighter (and there might probably even be even better ones out there).

P.S.: In this course, none of the groups set the wooden tongs on fire! :-)