Category Archives: hands-on activity (easy)

Salt fingering

How to show my favorite oceanographic process in class, and why.

As I mentioned in this post, I have used double-diffusive mixing extensively in my teaching. For several reasons: Firstly, I think that the process is just really cool (watch the movie in this post and tell me that it isn’t!!!) and that the experiments are neat and that everybody will surely be as excited about them as I am. Secondly, because it shows that understanding of small processes can be really important in order to understand the whole eco- and even climate system. And thirdly, because it helps to demonstrate a way of thinking about oceanography.

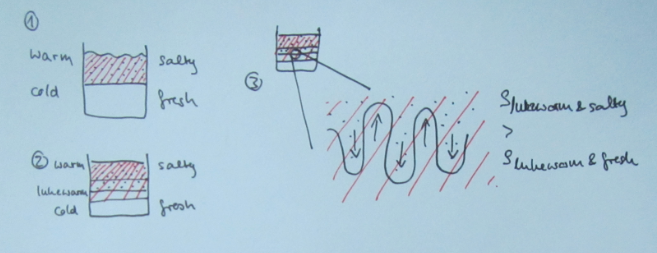
When I introduce salt fingering, I talk students through the process in very small steps. It goes something like this (Numbering is referring to the sketch below):

1) Initially, you have a stratification where warm and salty overlies cold and fresh water. This stratification is stable in density (meaning the influence of the temperature stratification on density outweighs that of the salinity stratification).

2) Since molecular diffusion of temperature is about a factor 100 faster than that of salinity (we will talk about why that is in a later blog post), the interface in salinity is initially basically unchanged, whereas a temperature exchange is happening across that interface, and a layer of medium temperature is forming.

3) At the salinity interface, we now have a stratification that is no longer stable in density: while the water now has the same temperature in a thin layer above and below the interface, it is still more salty on top and less salty below the interface. This means that the saltier water in this thin layer is denser than the less salty water below. This leads to finger-shaped instabilities at the interface: The salty water will sink and the fresh water will rise.

The individual salt fingers now have a much larger surface than the original interface, hence molecular diffusion of salt will happen much more efficiently and eventually the salinity inside and outside of the salt fingers will be the same, hence the growth of the fingers will stop.

At the depth where the salt fingers stopped, a new interface has formed. This new interface can also develop salt fingering, leading to a staircase-like structure in temperature and salinity.

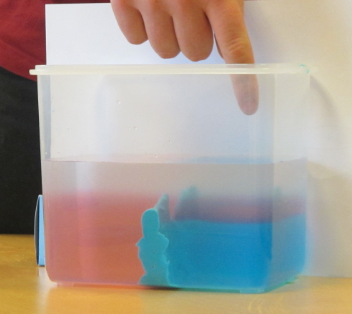
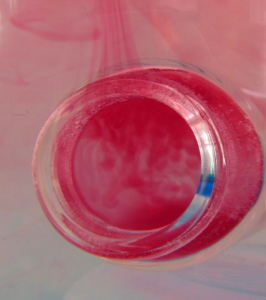
After salt fingering has been introduced, there are usually several other occasions where it, or its effects, can be pointed out, like for example when showing this experiment (see picture below), when talking about the hydrographic properties in the area of the Mediterranean outflow or the Arctic, or when talking about nutrients in subtropical gyres.
IMG_4233_sehr_klein

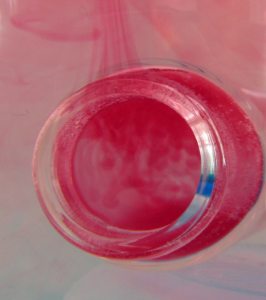
This is a zoom in on one of the bottles shown in this experiment: In the warm bottle, the red food dye acts as salt to form salt fingers!

While talking about salt fingering, since I focus so much on the process, I have always been under the illusion that students actually understand the reasoning behind it and that they can reproduce and transfer it. Reproduce they can – transfer not so much. Stay tuned for the next post discussing reasons and possible ways around it.
Double-diffusive mixing

On the coolest process in oceanography.

My favorite oceanographic process, as all of my students and many of my acquaintances know, is double-diffusive mixing. Look at how awesome it is:

Double-diffusive mixing happens because heat and salt’s molecular diffusion are very different: Heat diffuses about a factor 100 faster than salt. This can lead to curious phenomena: Bodies of water with a stable stratification in density will start to mix much more efficiently than one would have thought.

In the specific case of a stable density stratification with warm, salty water over cold, fresh water, finger-like structures form. Those structures are called “salt fingers”, the process is “salt fingering”.

IMG_4233_sehr_klein

Salt fingering happening with the red food dye acting as “salt”.

Even though salt fingers are tiny compared to the dimensions of the ocean, they still have a measurable effect on the oceanic stratification in the form of large-scale layers and stair cases, and not only the stratification in temperature and salinity, but also on nutrient availability in the subtropical gyres, for example, or on CO2 drawdown.

Over the next couple of posts, I will focus on double diffusive mixing, but less on the science and more on how it can be used in teaching. (If you want to know more about the science, there are tons of interesting papers around, for example my very first paper)

Mediterranean outflow

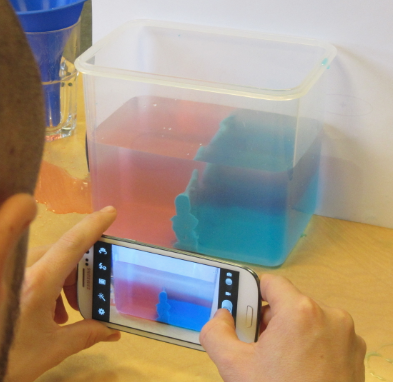
Students demonstrating the mediterranean outflow in a tank.

As reported earlier, students had to conduct experiments and present their results as part of CMM31. Niklas chose to demonstrate the mediterranean outflow – warm and salty water leaving the Mediterranean and sinking to a couple of kilometer’s depth in the Atlantic Ocean.

Since I happened to be around, they allowed me to document the experiments and blog about it, but there is a great description, including a movie, to be uploaded on the webpages of the University Centre of the Westfjords.

When the guys were done with the experiment, I couldn’t help but suggest to tip the tank so that the densest water would spill back into “the Mediterranean”. Check out the movie below if you fancy playing!

How sound is refracted towards the regions of minimum speed.

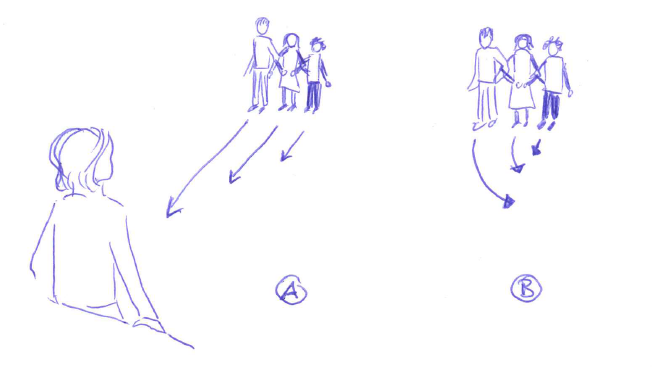
Students acting out the process of sound being refracted towards the region of minimum speed.

We’ve been talking about refraction lately. Waves get bent in the direction of lower velocity. This holds for light and sound and even ocean waves. However, students find it conceptually difficult to understand why waves are being bent towards lower rather than higher speeds, so I came up with this very simple demonstration.

Students, arms joint, are acting as a wave crest. Students on the one side of the student chain are told to move very slowly, students on the other side are asked to move quickly towards the instructor. Everybody takes care to not hurt anybody, so if tension builds up in the chain, everybody has to react to reduce the tension. What happens is that the “wave crest” of students changes direction towards the side of the slowest motion.

Easy visualization and – since it involved students getting up, joining arms and doing something – also very memorable. Win – win!

Another easy example: When you are sliding on an icy road and your foot gets caught in grass or gravel or something on one side (== region of lower velocity), you start skidding towards the side with the obstacle, not towards the middle of the icy road.

The broken spoon

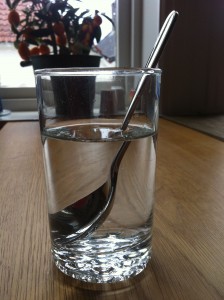
Refraction of light in water.

I just happened to notice this the other day, so I thought I’d take a picture and share it with you.

2013-10-24 12.13.01

“broken spoon”

It is amazing how much more aware of everyday things that can be used to illustrate concepts related to oceanography I have become since starting this blog! This is so much fun! :-)

Why do we get an Ekman spiral?

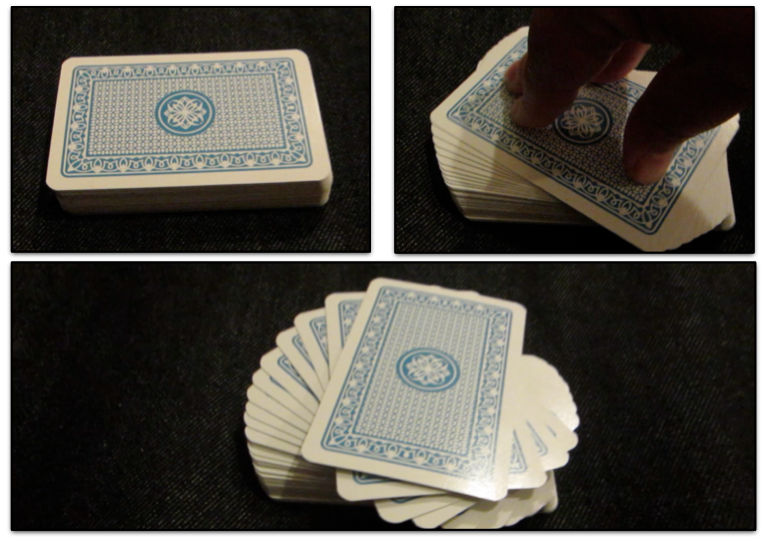
Visualizing an Ekman spiral using a deck of cards.

To state this right upfront: this post will not explain why the surface layer is moving at a 45 degree angle to the wind direction, and if anyone has a great idea for a simple demo for that please let me know! It will also not explain why the layers are turning further and further the deeper down you go. But what I am trying to do today is give an intuitive understanding for why all the theoretical layers in the water column turn in response to the surface layer and hence why an Ekman spiral develops if we accept that the surface layer is turning relative to the wind direction.

Demonstrating the formation of an Ekman spiral using a deck of cards.

You will need a deck of cards. Bonus points if they are “salmon fly” cards like mine (seriously – who could walk past a deck of cards with salmon flies on them? Plus I needed a deck of cards because I was already in Iceland when I realized I wanted to show this demo).

All you do now is put the stack in front of you. Put your hand on the top card, twist gently while applying a little bit of pressure. Voila – your Ekman spiral develops! It is turning the wrong way round, but the main point is that the twist is being transferred downwards from layer to layer and not only the top layer twisting while the other layers stay motionless.

And because people seem to always like movies:

Progressive waves on a rope

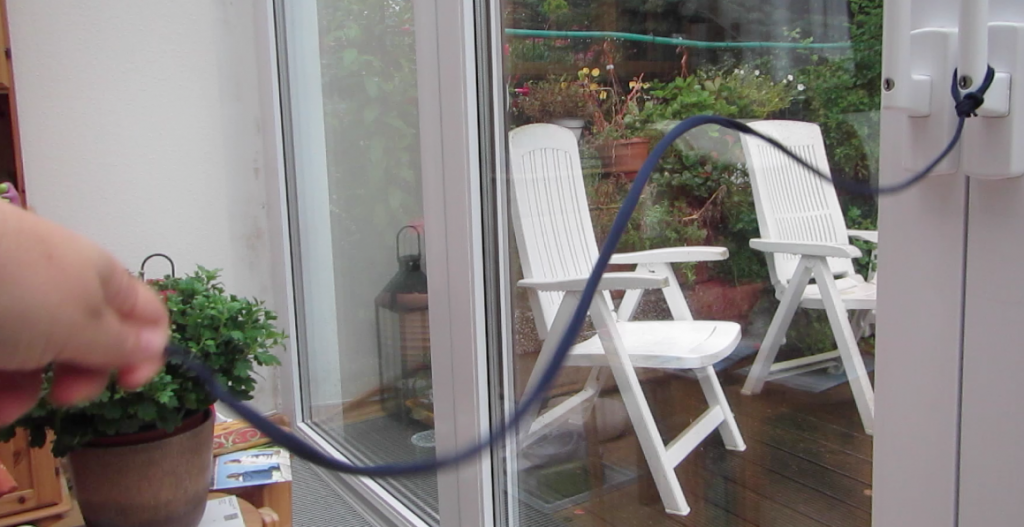
Visualization of progressive waves: wave form and energy move forward while the rope itself stays in place.

When I talked about waves in GEOF130 recently, in order to explain the concept of progressive waves, I showed a drawing from one of the textbooks, where someone was moving a rope such that waves traveled on the rope. The idea was to show that for progressive waves the wave form and energy travel, while the matter itself stays more or less in place, only moving up and down or in circular orbital motions.

The look I got from one of the students for showing that drawing confused me a bit and I am still not sure whether it was a “I have no idea what you are trying to tell me!” or a “Duh! Are we in kindergarden?”, but I think it was probably closer to the former. So from now on I will carry a piece of rope on me to show this in lectures and to have students try themselves.

A wave shape traveling forward on a rope, while the rope itself stays in place.

I filmed a quick video because it was difficult to watch the wave while exciting it myself, but it turns out it is even more difficult to hold a camera more or less steady while exciting waves at the same time, plus the movement is pretty quick even for a camera as awesome as mine. Anyway, if you want to procrastinate learn more about waves, watch this!

Why melting sea ice does not contribute to sea level rise.

Simple experiment on why the impact of glaciers and sea ice on sea level, respectively, are not the same.

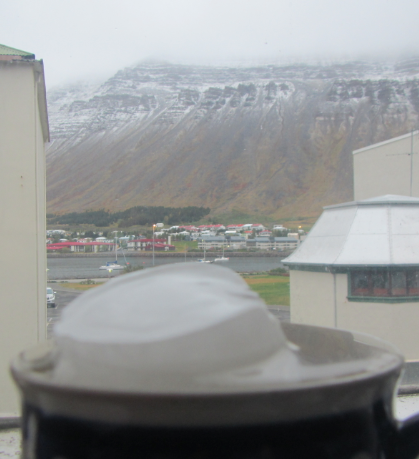
It could be so simple: An ice cube sinks into water until the mass it replaces is equal to its own mass.

The mug is as full with water as it gets. But even if I stared out of the window at the mountain and the snow until this swimming piece of ice had completely melted – the water level in the mug would not have changed.

Since the mass of said ice cube is not changing when it melts, under the assumption that the difference in volume due to the temperature difference of the melt water and the water in which the ice cube swims is negligible (reasonable assumption in most cases) that means that a swimming ice cube can’t change the water level in a cup and a swimming ice berg can’t change sea level. Things are different for glaciers or other ice that is sitting on land rather than freely swimming.

IMG_5100

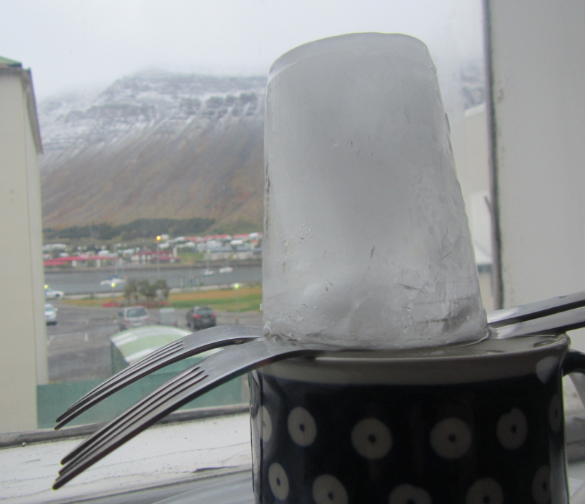
I should have thought about how I would transport the plate on which the mug with the ice is sitting back to the kitchen once the ice has melted. In other words: Yes, the mug will spill over.

This is a very easy demonstration and while it is intuitive that in the second case a mug that was completely filled with water when the ice was first added will spill over once the ice melts, the first case seems to be very difficult. Most students are not quite sure what they are expecting to see, and even if they are, they don’t really know why.

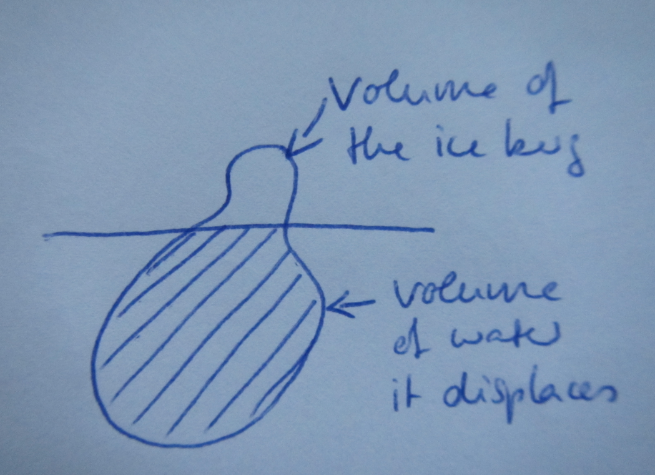
My typical drawing to explain this topic. The potato is supposed to be an ice berg floating in water.

I have always been teaching this by drawing the water level and the ice berg on the board, and then by marking the volume of the whole ice berg and the part of it that is under water, and trying to stress how the mass of the ice berg is the same as that of the water replaced by the part of the ice berg that is under water (because the molecules are more densely packed in liquid water and yada yada) — there must surely be a better way to explain this? Any ideas out there?

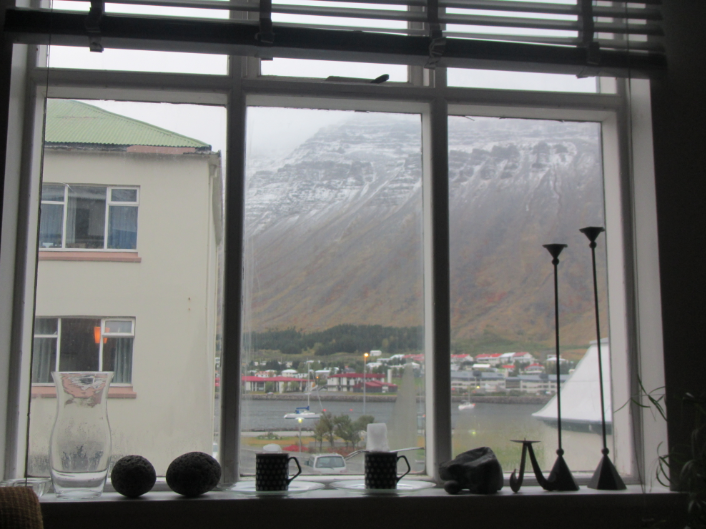
Experiments the Isafjördur way. Can you spot the two mugs and the ice in the middle of the window sill? Floating ice on the left, a “glacier” resting on forks above the water level on the right.

Measuring temperature.

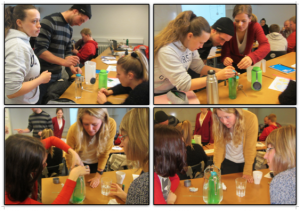
Students build thermometers.

As described in this post, I like to have students build “instruments” to measure the most oceanographic properties (temperature, salinity and density). I find that they appreciate oceanographic data much more once they have first-hand experience with how difficult it is to design instruments and make sense of the readings. Over the last two days I described the experiments for salinity and density, today it’s temperature.

measuring_temperature

Students building thermometers.

Measuring temperature is probably the most difficult of the three properties. Firstly, there are lots of technical difficulties to be overcome. How can we seal the mouth of the bottle around the straw in a way that it is really water tight? How much water do we have to fill in the bottle? Does it matter if there are air bubbles trapped? What if the water level when we fill the bottle is not visible because of the seal? If the straw is clogged up with modeling clay, will we still be able to use it in the instrument? How long does the straw have to be above the seal in order to avoid water spilling out when the temperatures we try to measure become too hot?

Then, there are many problems connected to the actual measurement. If we lift up the thermometer (and hence squeeze the plastic bottle) – how does that influence our reading? Since we have half a liter of water in the thermometer, are we actually measuring the temperature of the water sample, or are we influencing it while trying to measure? How do we come up with a scale for our temperature measurements had I not supplied (mercury-free) thermometers to calibrate the new thermometer with? So many questions to think about and discuss!

Measuring density

Students build a device to measure density.

As described in this post, I like to have students build “instruments” to measure the most oceanographic properties (temperature, salinity and density). I find that they appreciate oceanographic data much more once they have first-hand experience with how difficult it is to design instruments and make sense of the readings.

Students designing a hydrometer.

Measuring (relative) density is by no means easy. There are a lot of conceptual things to understand when developing hydrometers – one question that comes up every time is what to mark. The first idea tends be to mark displacement on the cup – either a zero-mark without the hydrometer in the cup and then the water level once the hydrometer is floating in the water, or the level of the bottom of the hydrometer. Which makes it fairly hard to measure other samples than the ones the instrument was initially calibrated with.

The student group working on the task was faced with – and overcame – many difficulties. The straw was top-heavy, so in order to float more or less vertically, it had to be cut down. They had four different test solutions, but they did not know the densities of those solutions, only their salinities, hence they developed their own density scale relative to which they measured the density of their solution. Pretty ingenious!