Blogging hiatus. Or: If there was a law against blogging about oceanography, would you protest it?

Some of you have noticed that during January and February, I did not write a single blog post. The reason for that is that I was sick. Sick enough to not even want to take pictures of water for a while, and then still sick enough to take the pictures, but to only upload them to draft posts and not write the actual texts to go with that (even though in many cases that would only mean writing “look! how awesome!” or something like that).

Before I got really sick, I watched a couple of videos by one of my biggest and most awesome mentors, Marie Forleo. I always like her stuff and look forward to new videos every Tuesday, but this old one really hit a nerve with me. It’s about “burnout vs. time for a change”. Do yourself a favour and check it out!

In the video, Marie describes four “tests” that you can do to figure out whether you are burnt out (and urgently need a break from it all!) or whether it’s just time to move on and try something new. And two of those really resonated with me, and I’ll discuss them in my context:

1. The law test. The law test is what motivated the title of this blog post. Marie suggests I ask myself: If there was a law against blogging, would I protest it? And in the beginning, when I was very sick, my response was that I would actually be hugely relieved if there was a law against science blogs because it would take such a weight off my shoulders if I never had to write about oceanography ever again, and nobody else was allowed to, either. This really scared me, because even though that was what I thought at the time, I knew that it was completely unlike me to think that thought. Because I love blogging, and even if I didn’t, I would totally protest because I believe that blogging has an important role in science communication. But I realised that I really urgently needed to take some time off of blogging and social media and scicomm in order to find back to “real me”.

2. Time off. This second rule is about asking yourself when you last had taken substantial time off from whatever you are doing. And I realised: Never. I’ve been blogging for almost four years, and doing all kinds of other scicomm, and it’s something that I’ve really enjoyed all this time. But every time I walk outside and see a puddle or a lake, a river or the ocean, I want to take pictures and write about what I am seeing. But at some point, without realising it, wanting to take pictures and write about them had become having to do it, and having to do it became a burden that killed all the joy that I have always felt doing it. And that that meant that I really urgently needed to take some time off of blogging and social media and scicomm in order to find back to “real me”.

Are you seeing the pattern here? I did, so I took some time off. First I planned to just be gone over New Year’s, but then I got sick and it turned into two months away from the blog. And I am glad I did take that time off, even though I started to feel the itch to come back a lot earlier, because now I am back, and I am rested and full of new energy and new ideas, and I am excited to be back! :-)

P.S.: There are two more tests, the “80/20 rule” on how 20% of work cause 80% of stress, and “Natural strength” on whether we spend most of our time doing what we are good at and what comes easily. But the first two had given me all I needed to know already, so I am just mentioning the other two for reasons of completeness. You should go check out the video!

P.P.S.: I wasn’t sure whether I was going to write about being sick, and about being sick of blogging, but when I was looking through my saved drafts earlier today and thought about whether I should post them back-dated to fill the gap in my blogging record, I decided that no, I would not. I will leave that gap to remind myself that sometimes it is absolutely necessary to take a break, and that a break is not failure, but an opportunity to come back relaxed and stronger and more joyful than ever before. And that next time I should take the break a lot earlier, long before I feel like there should be a law against doing things that I love doing!
My March on Instagram

My private #SciCommChall for March was to start a science communication Instagram account, fascinocean_kiel. I had a pretty clear idea of where I wanted to go with this account:

  • The target group are people who live close to Kiel fjord who I want to talk to about oceanographic phenomena you can spot when walking along Kiel fjord
  • For that, I wanted to post daily pictures of whatever is going on that day, plus short explanations in German
  • I wanted to do this as a proof of concept, to get an idea of the amount of work involved, and to get a feel for how many people you can reach organically with this kind of content; basically to build my portfolio as a science communicator.

This post is for all of you who are curious about

a) how that has been going (I will reflect on that below); or

b) what I have actually done on Instagram, since you don’t actually use the app.

So here we go! :-)

a) How Instagram is working for me (or, at least, the first couple of weeks)

My first impression after four weeks on Instagram: It’s fun! I thought it would be less work than writing a blogpost, but it’s actually not, it is just different. I have to take and select pictures a lot more carefully, crop them, sometimes put a filter on or something (except the green lakes — those were 100% real!), but now I have to think about relevant hashtags so people can find my posts…

And social media are really that, social. Through Instagram, I have connected with a lot of people who I only met through Instagram: On my very first day actively posting on Instagram, I have received an invitation to visit something really cool (will let you know when it’s not a big secret any more). Then, several people who I didn’t know before, messaged me to tell me they liked my “feed”. And then I got recommended for an interview about scientists and social media by someone I don’t even know! I am very impressed with the community on Instagram. And connection also works the other way round: I have found amazing science communicators on Instagram whose posts I look forward to reading every day, for example stories.of.a.scientist, science.sam, bakingsciencetraveller, and sci_wilson, just to name a few.

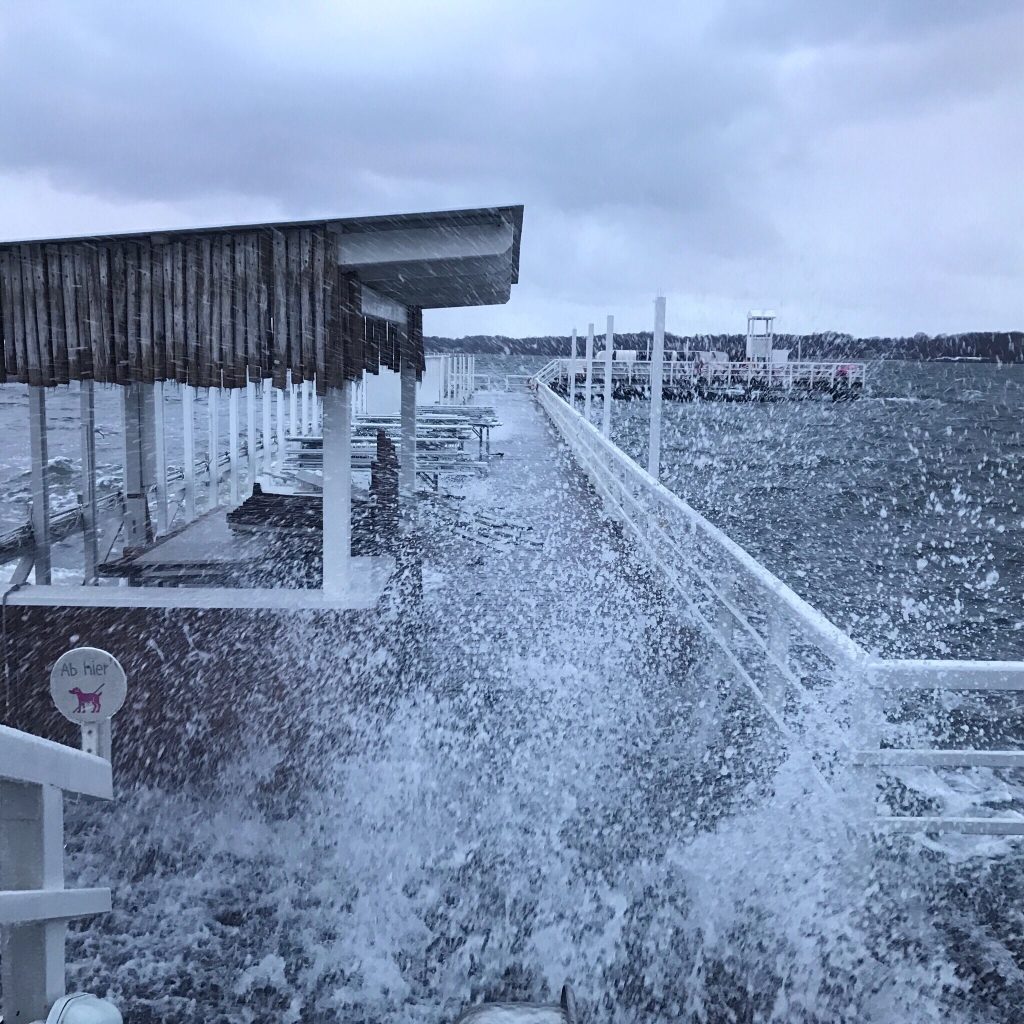
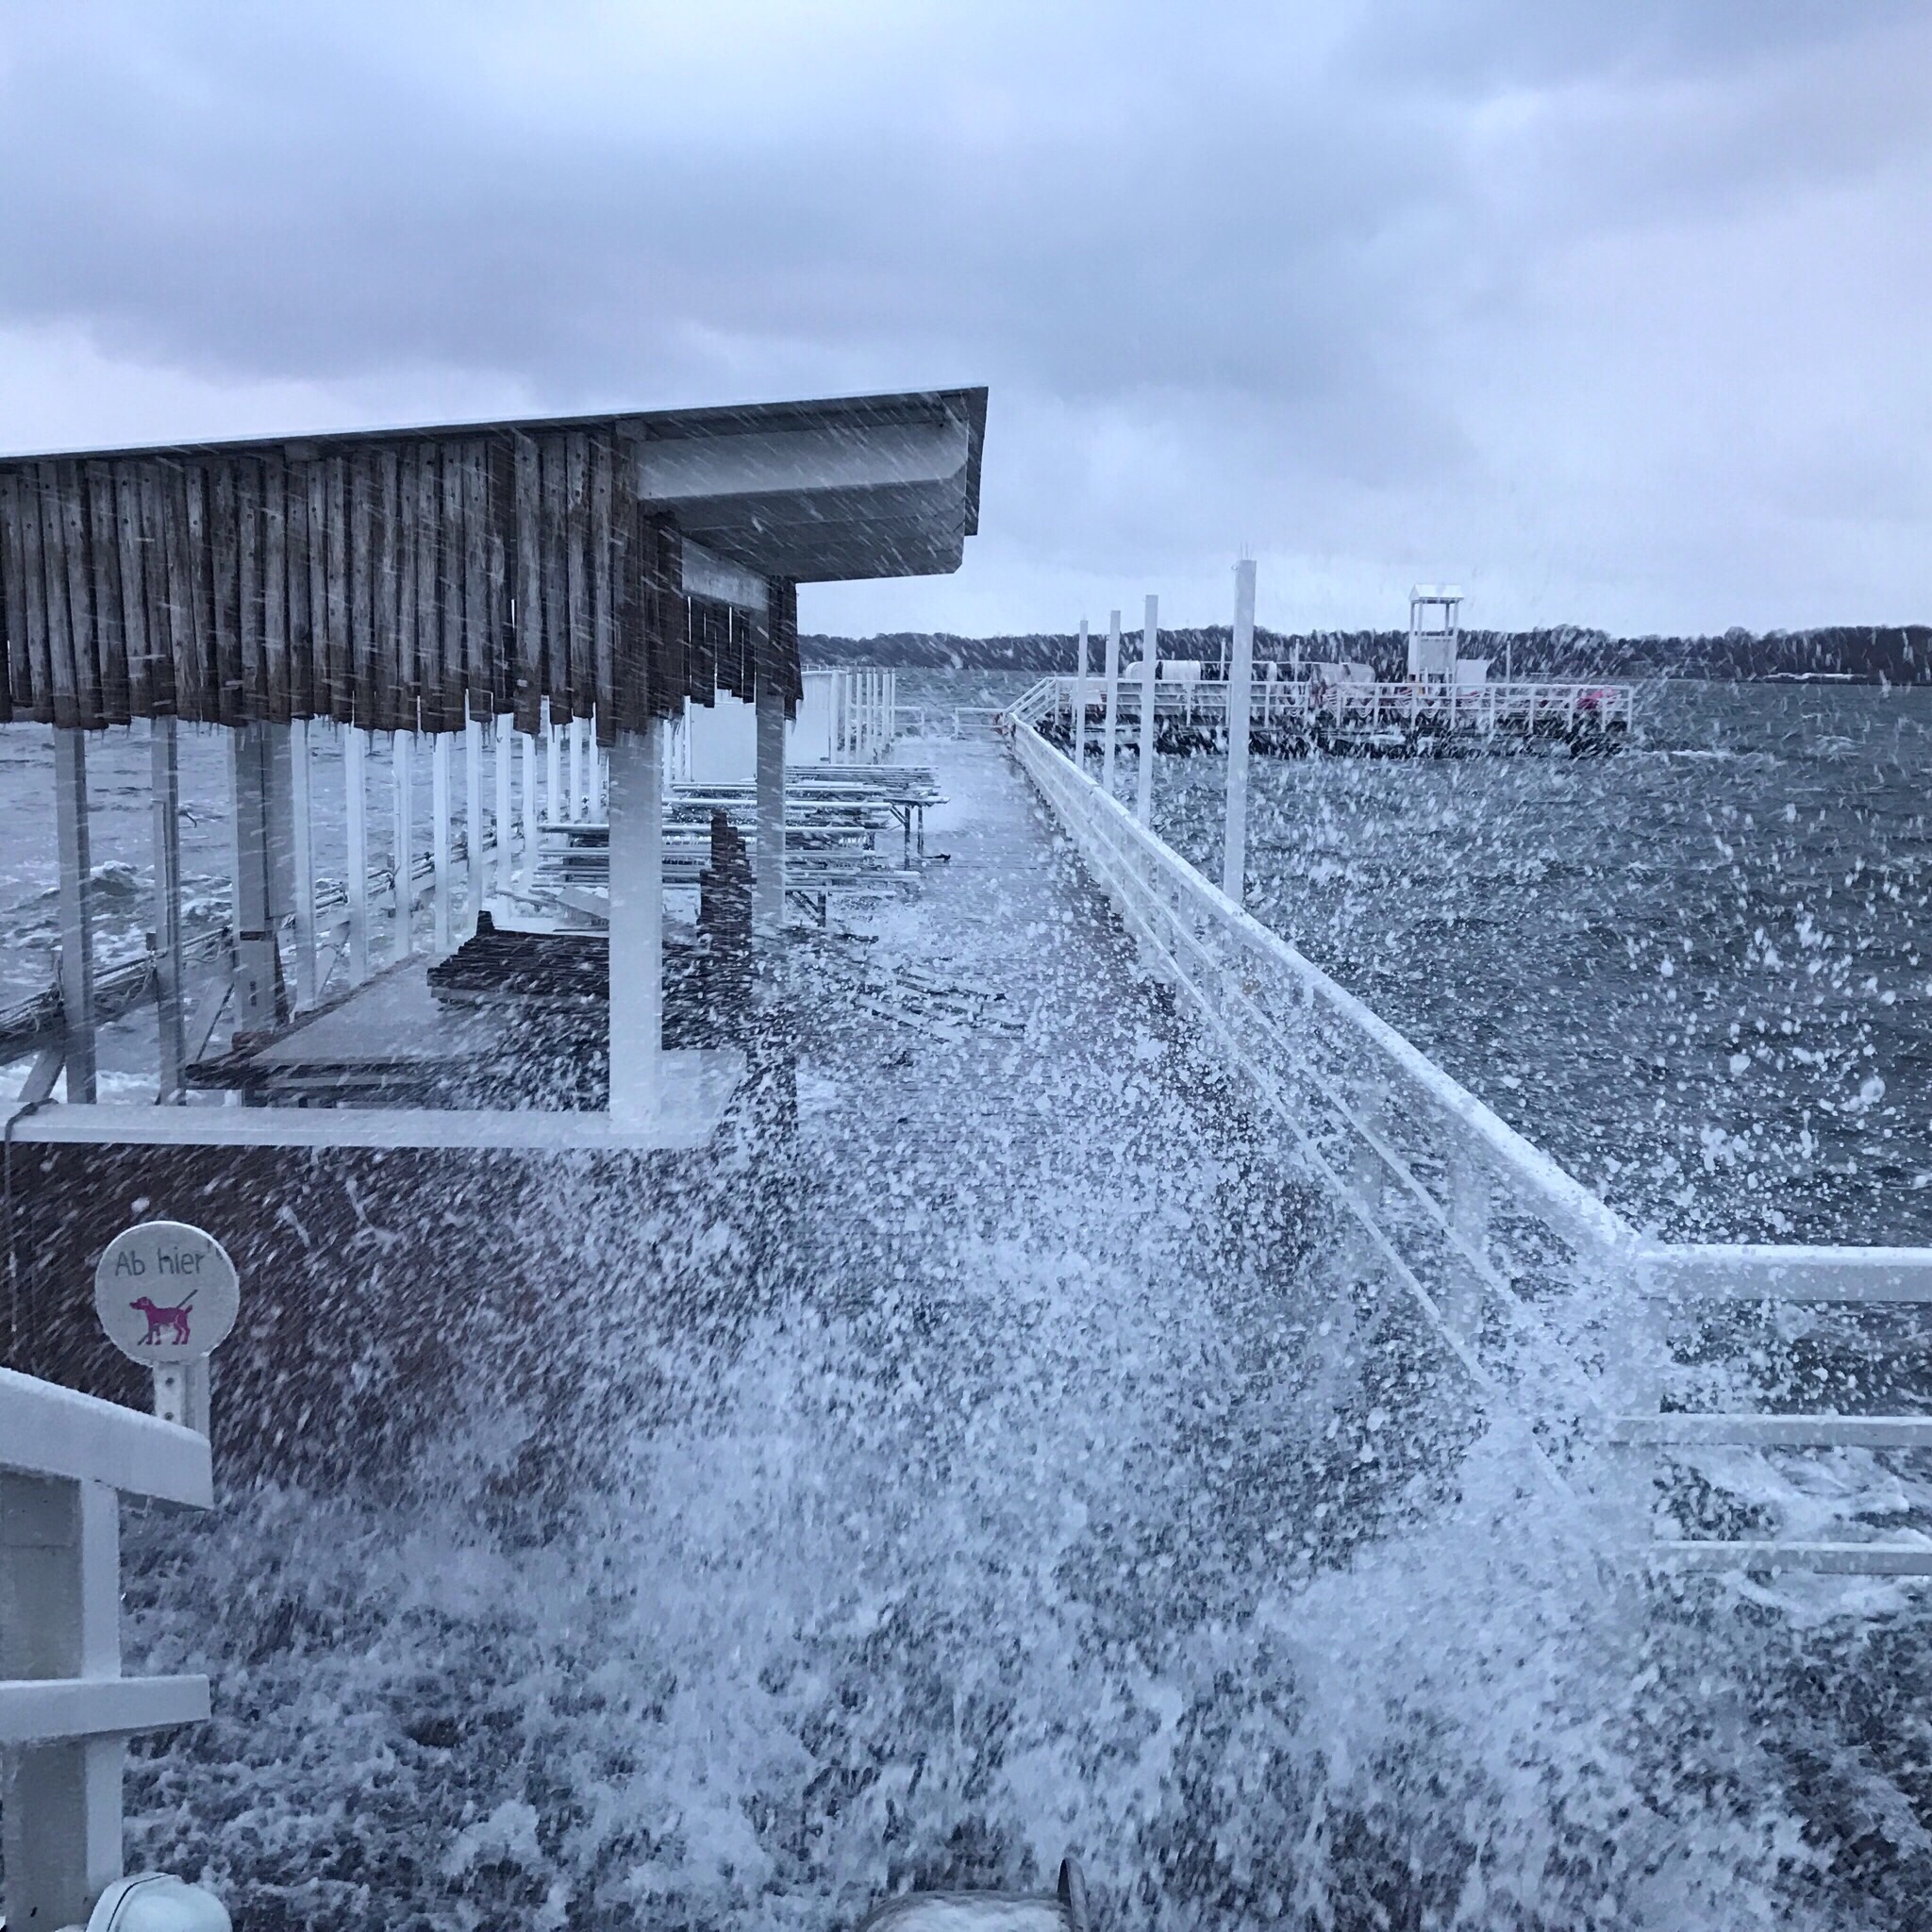
As for how many people I’ve been reaching (after less than a month on Instagram!): A picture typically get 30-40 “likes”. My best picture currently has 87 likes, but that’s a really awesome picture if I say so myself (see below). I think this picture performed so well for two reasons: because it’s a really cool picture, but also because it’s showing an exclusive view of my favourite restaurant in really really bad weather. I think that people recognized the spot and that I had an exclusive pic really helped.

Continue reading

Are you following fascinocean_kiel on Instagram already? You definitely should!

fascinocean_kiel is my latest scicomm project — I am posting daily pictures from Kiel fjord together with a german description of some cool oceanography stuff you can see on the picture. But Instagram has a pretty good translator built in, and I am happy to translate any post if you leave me a comment with the picture you are interested in!

My latest post is the picture above: Here you can calculate the dominant wave length from the length of the pier and where waves are breaking through the floor boards of said pier. Storms are awesome when you are safely on land!

And below you can take a look at the whole fascinocean_kiel Instagram feed. See you over on Instagram? :-)

A sketch of a learning sequence on fjord circulation experiments

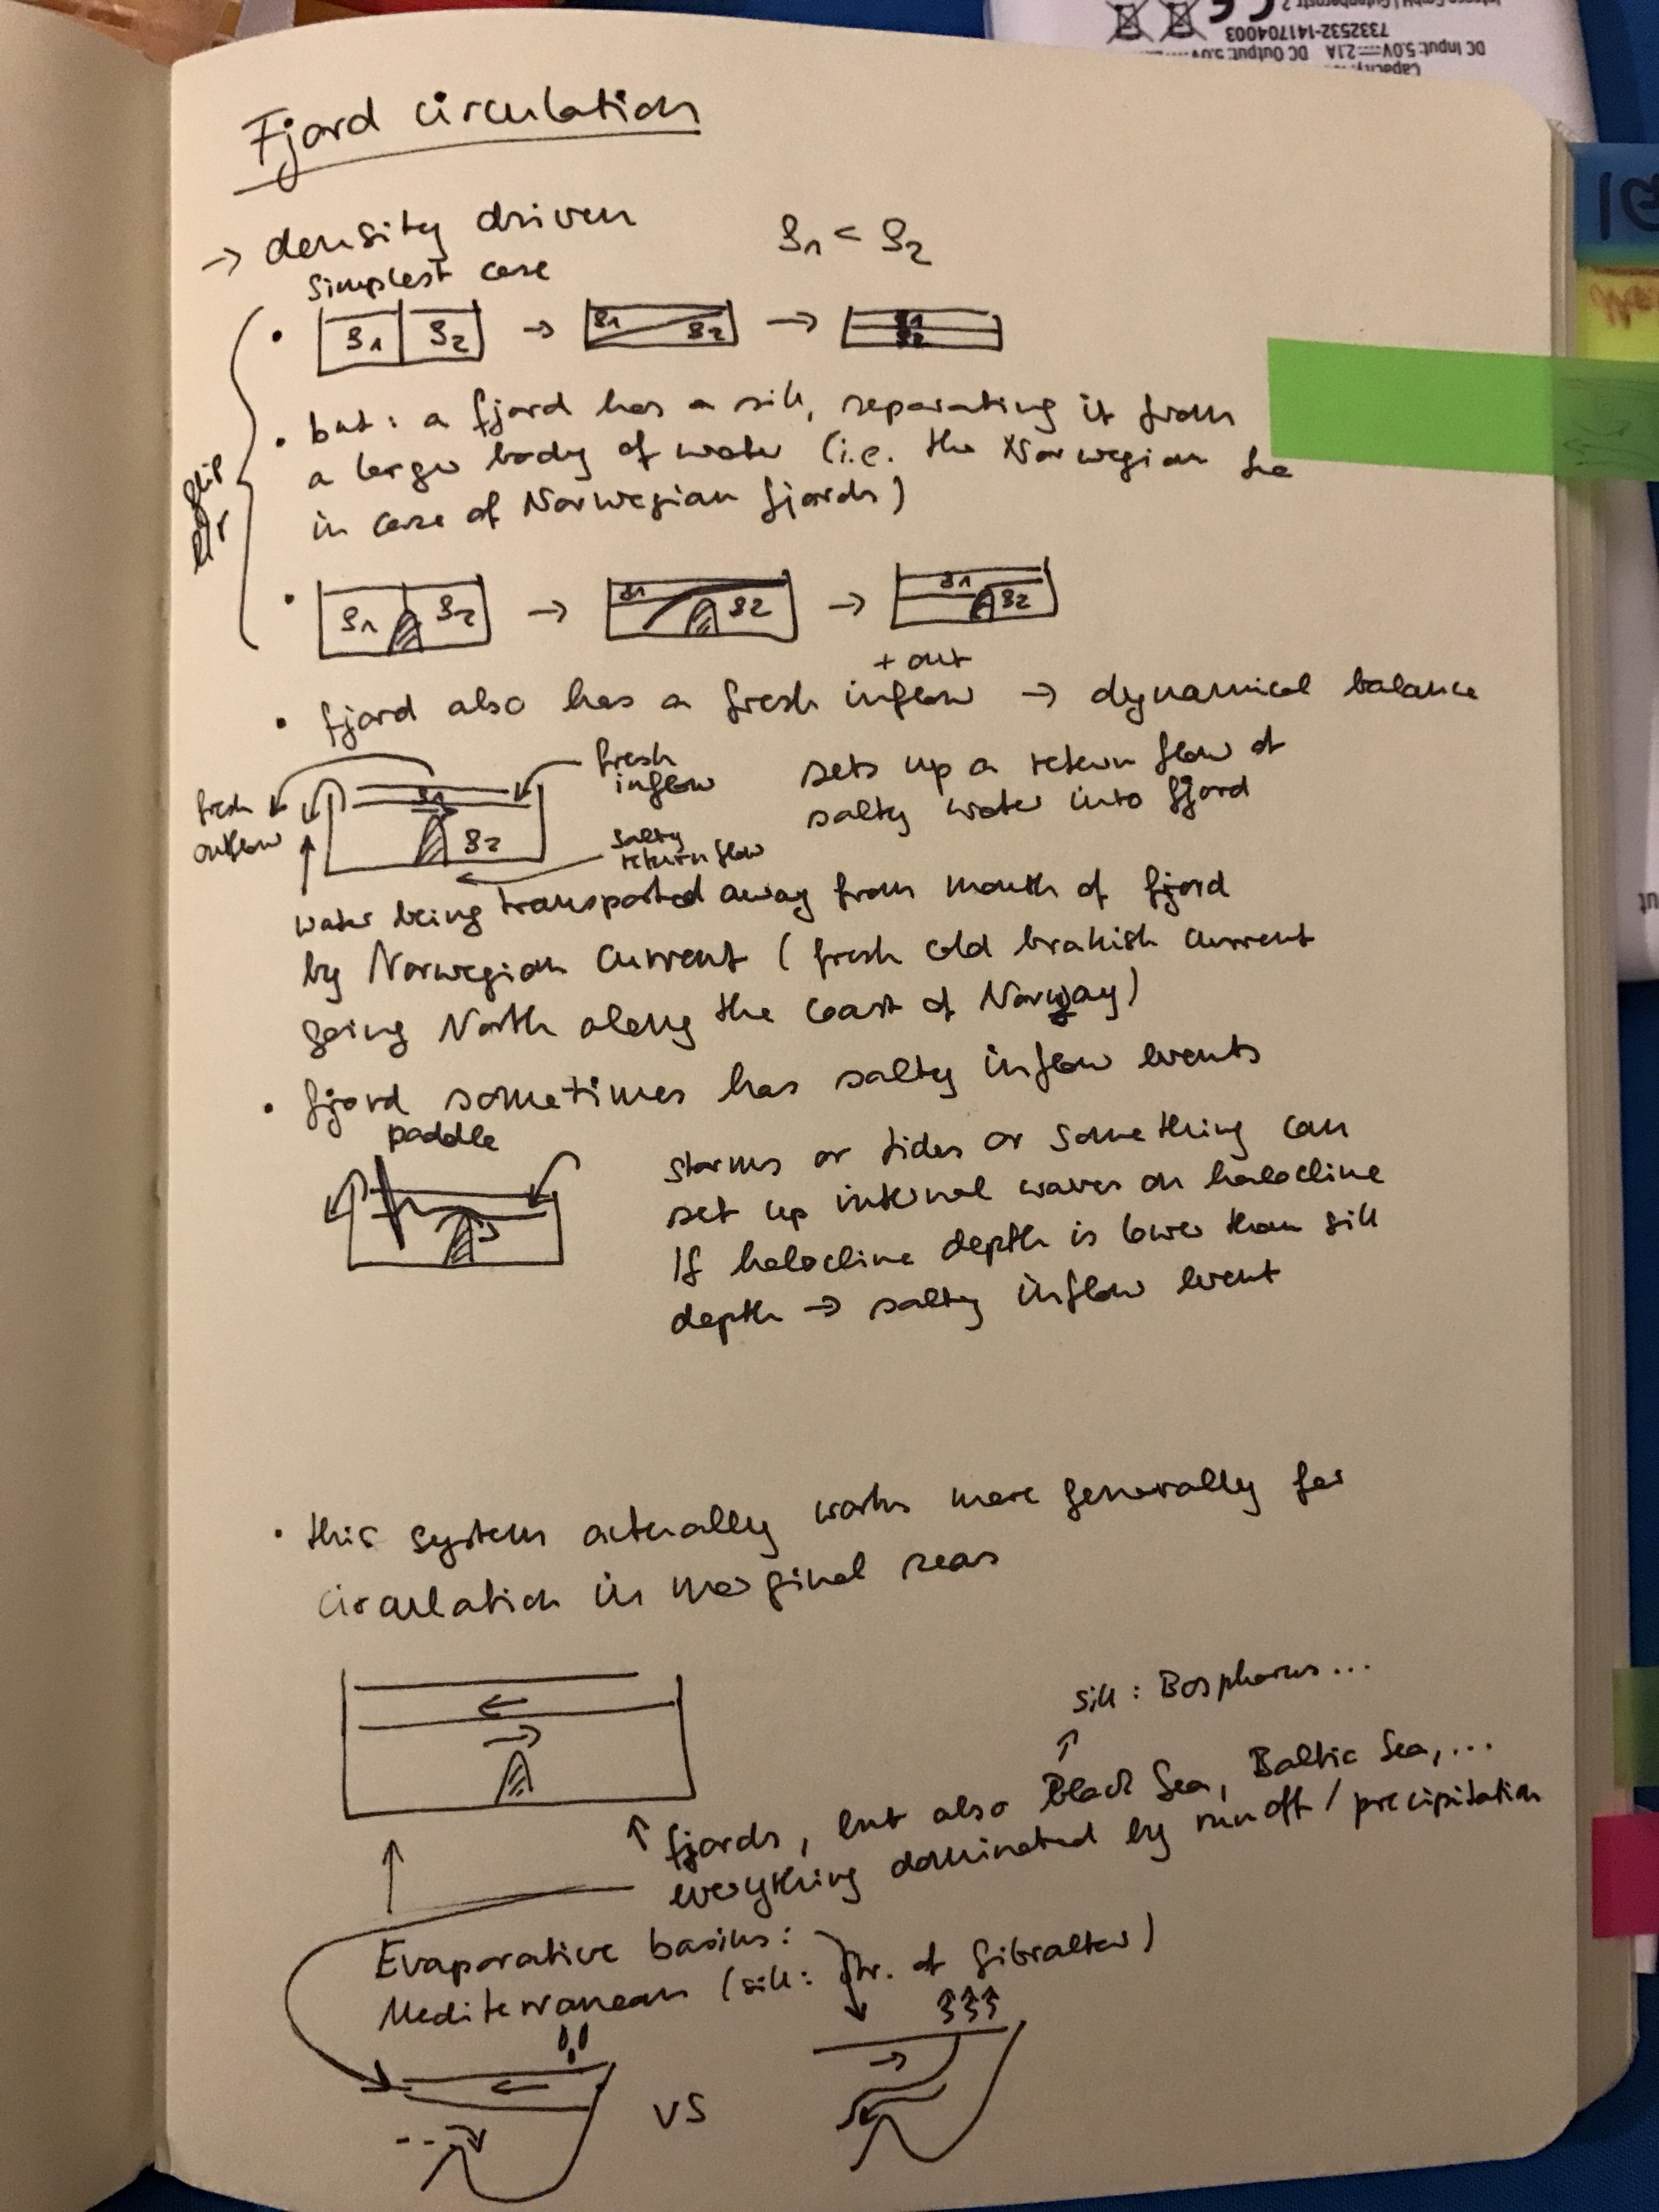
I’ve been wanting to develop a good fjord circulation experiment for a long time now — I wasn’t happy with the one we used back when I was teaching in Bergen, and then 1.5 years ago I talked with Steffi and Ailin who took over the tank experiments in Bergen a while back and we wanted to do something about it, but it just never happened. Life, you know, and jobs with other foci…

But then when I couldn’t sleep, I decided that 4:15 in the morning is a very good time to sketch out how I would develop a learning sequence on fjord circulation. Let’s see how I feel about it at a more normal hour after some more sleep, but right now I am happy with it, and excited to flesh out the sketch a little more with actual instructions for experiments. Would you be interested in reading that? And where would you look for instructions like that (except for on my blog)? I am hoping to maybe publish it somewhere “official”…

Proudly presenting: #SciCommChall – the science communication challenge!

It’s been a little while in the making, but now it’s official and I invite you to join our #scicommchall!

#SciCommChall is a science communicator community-based challenge with the goal to experiment with different science communication formats in reaction to monthly prompts. The aim is to non-competitively inspire each other to come up with fun ideas, some of which might be taken further and become part of our science communication portfolio.

The April-challenge is currently active, so now is as good a time to join as any!

The website https://scicommchall.org, email address scicommchall@gmail.com, and social media (Twitter @scicommchall, Instagram @scicommchall, Facebook page https://www.facebook.com/scicommchall/) are all up and running, so pick your favourite mode of interaction and don’t be a stranger! And I would love for you to share #SciCommChall with your networks if you like the idea :-)

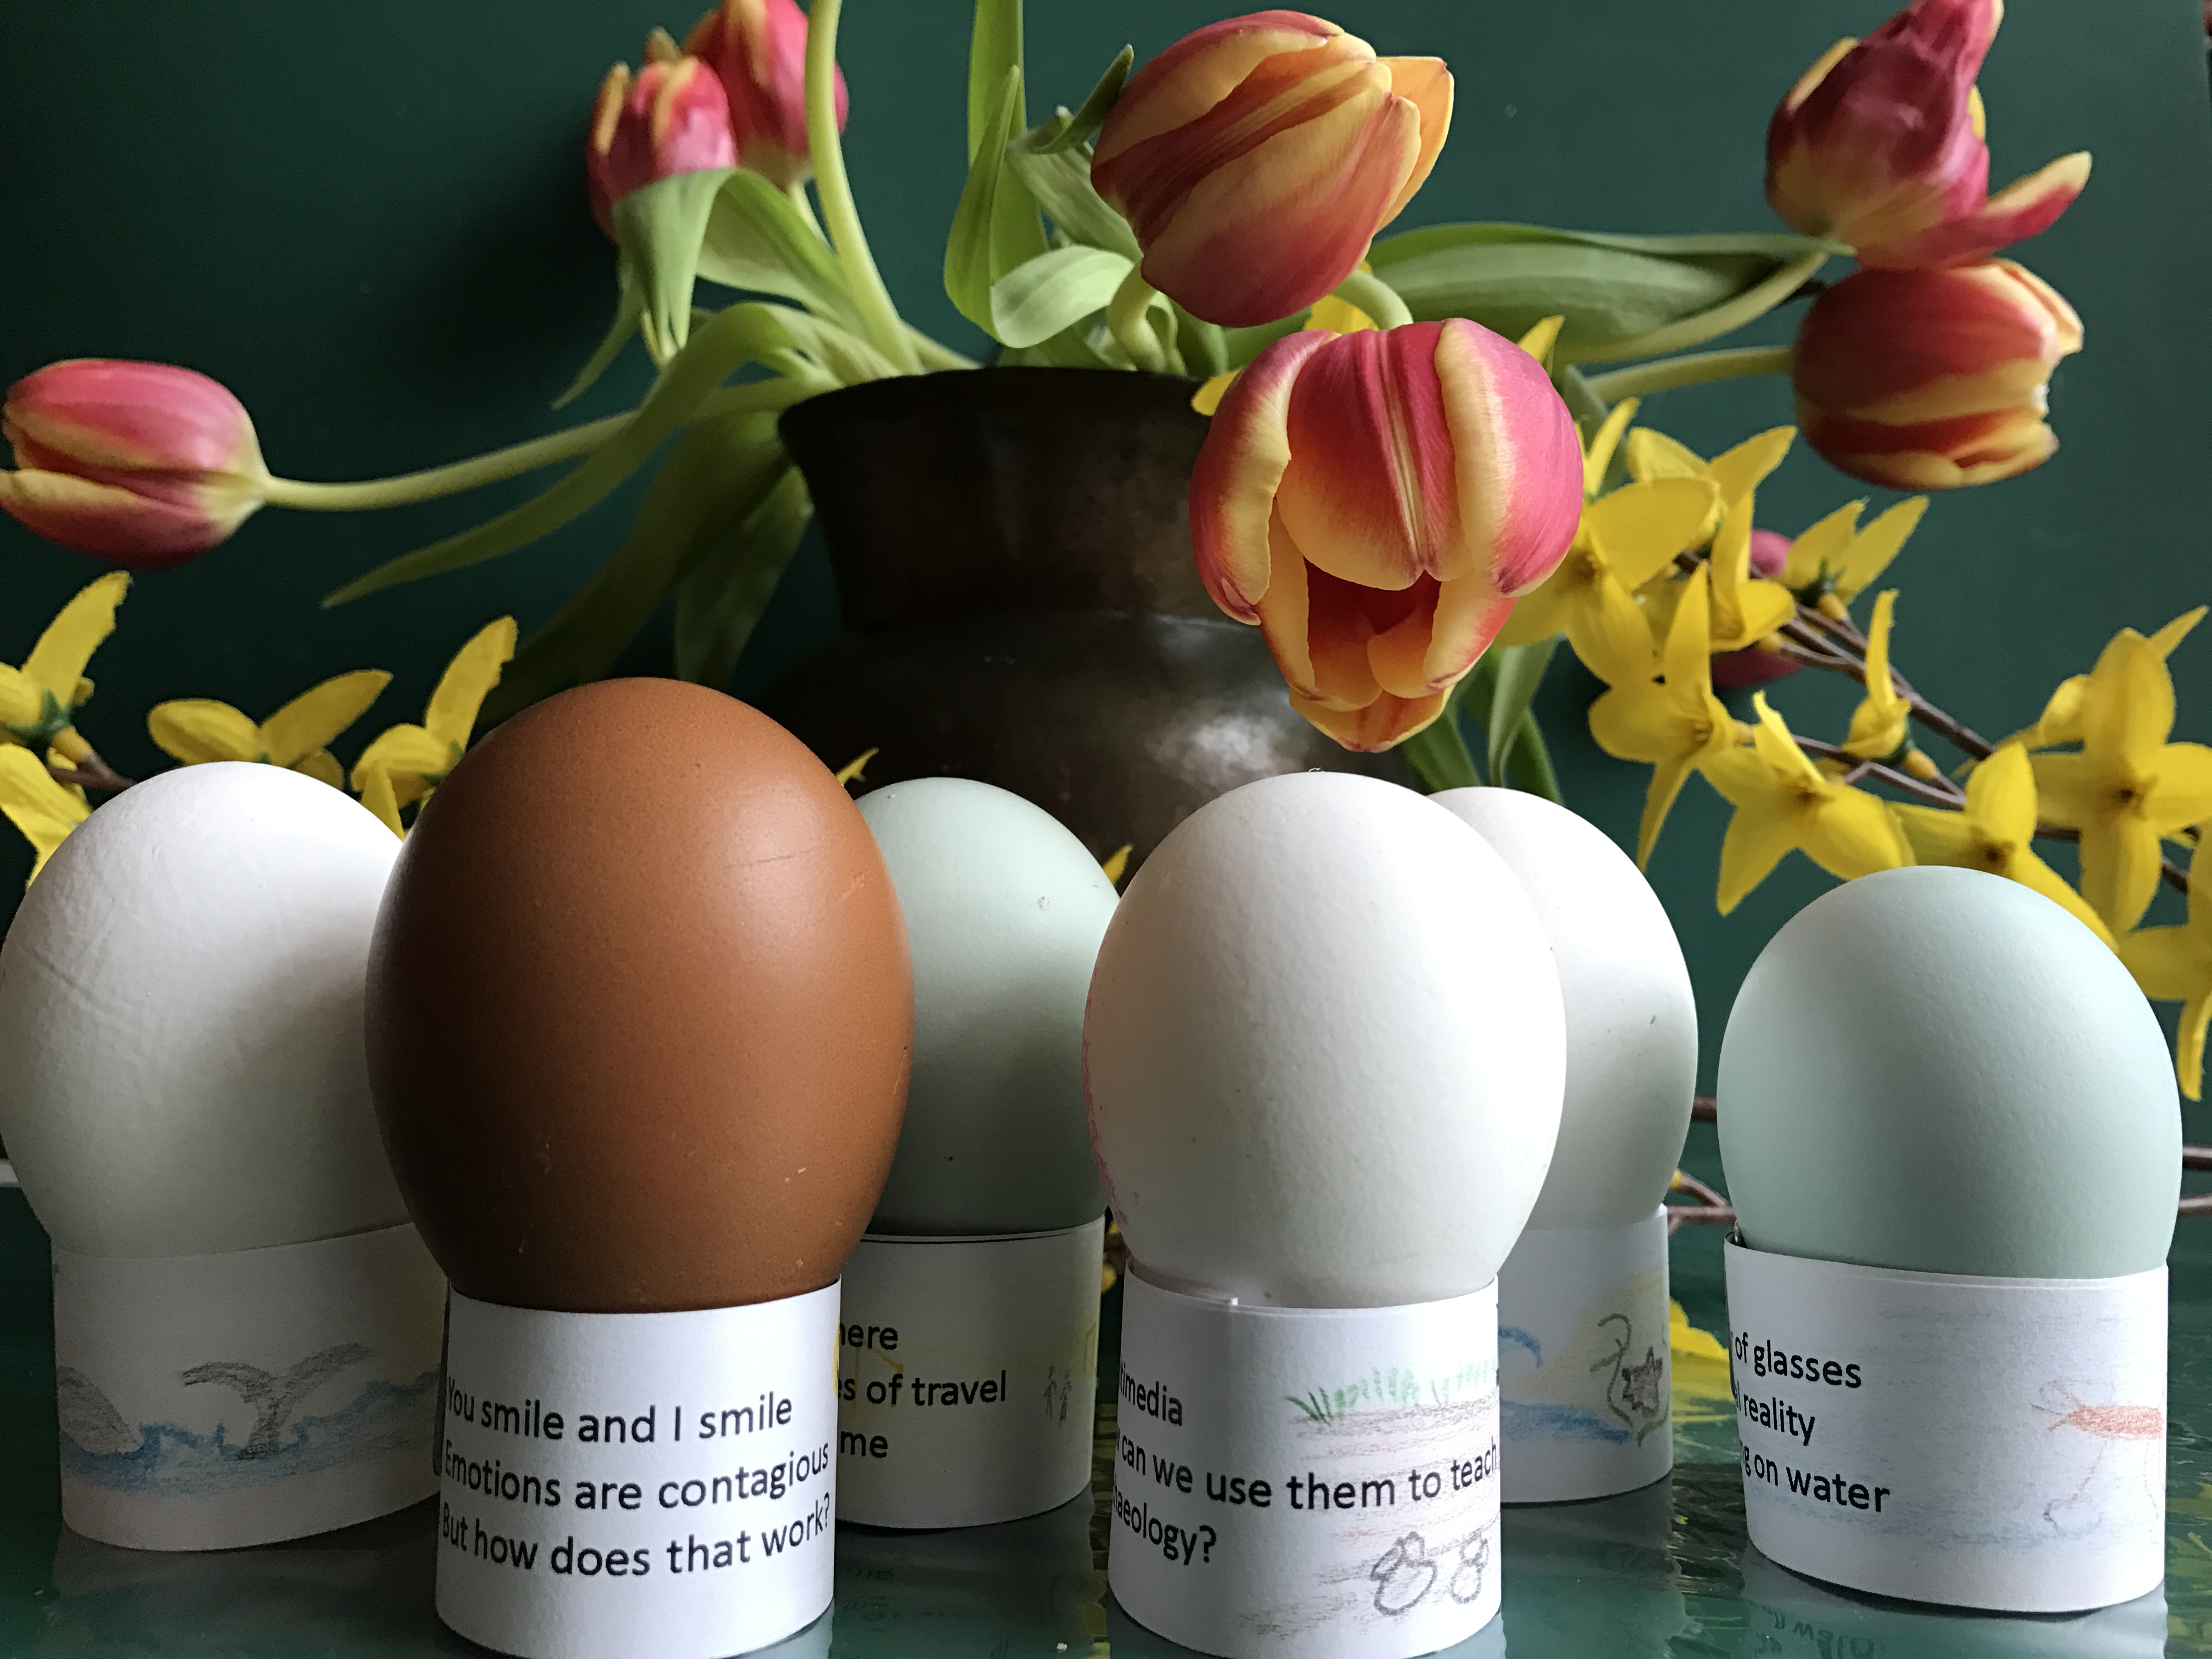
Below you see my personal interpretation of the March challenge (“Show us how you would sneak some science communication into a Brunch with your family and friends!”): As an Easter gift to my colleagues, I wrote Haikus about their research projects in KiSOC. Those little poems are on the outside of egg cups, on the inside I hid little explanations about the research projects. Check out other interpretations of that challenge on our website or social media! And join us for future challenges! :-)

Awesome outreach collaboration to continue: We won a Bjerknes Visiting Fellowship 2018!

We are excited and grateful for a great opportunity for continued collaboration that has recently presented itself: Elin won a Bjerknes Visiting Fellowship 2018 for me to visit her and the rest of her team in Bergen for a month in 2018!

We have several goals for that visit, but the main one is to develop more hands-on experiments (which we lovingly call “kitchen oceanography”), which parents, teachers, and other educators can use to get children excited about oceanography (and obviously for the grown-ups to play with, too :-)). Between Elin and me, we do already have a lot of experiments which we use regularly and recommend (for Elin’s, check out this site, and mine are here). But we would love to bring them in a different format so that they are easy to find and use, and are well integrated with the ekte data project. And then, obviously, we want to let everybody in Bergen (and all of our faithful readers) know where to find the experiments, and how to use them in science communication.

So plenty of stuff to stay tuned for! We’ll absolutely keep you posted on our progress on here!

Presenting our new school lab on “energy in the climate system” at a conference

Next week we’ll be presenting out new lab on energy in the climate system (read more about it here) at a conference.

The main focus is on actually presenting and conducting the experiments and showing and discussing the materials we developed, but I put together two posters to put up in some corner, to have something to point at while giving a brief overview over the concept and the experiments.

If you are curious, here they are (unfortunately in german, but give me a shout if you would like a translation of something!).

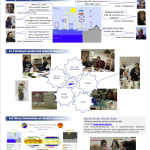
Poster 1 is about the general concept and the three phases of the lab: The overarching question, the experimental phase, and the expert puzzle which we use together with the MSCM model (more about that here) to bring the experts to a common understanding of the system.

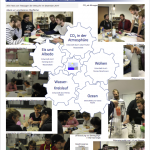
Poster 2 is just a bunch of pictures of individual experiments that are being done at the different stations. And I realized I urgently need better pictures for the next conference! Especially pictures with kids on them and not my team.

So here we go! That’s what I’ve been up to recently.

Dipping a toe into instagramming

This month’s private* #scicommchall: Run a scicomm Instagram feed! See the feed below. I’m doing this for several reasons: First: curiosity, how Instagram works for me personally as a scicomm format. Second: more curiosity, whether I can actually reach a german-speaking audience** that isn’t “just” scientists who are interested in the topic anyway. Third: Building my portfolio as a scicommer. Fourth: A little bit of laziness. You might have noticed my long blogging hiatus. I was sick for a long time, and now that I am back at work, I feel like I should pay a little more attention to what I spend all my time and energy on. Of course I still have to talk about water! But maybe this format is a little better suited for me at the moment. So I will definitely still write posts on this blog, but maybe not as many as you’ve gotten used to over the last years. But if you want to hear from me regularly, follow me on Instagram!

*”private” as opposed to the public #scicommchall that I have started. Since the beginning of this year, I am one of two scientific coordinators for the Kiel Science Outreach Campus (KiSOC), and I am challenging my colleagues there now, too. But I will report on that one another time…

**if you see a post you are interested in and would like to know what it says, just comment on that post and I’ll happily provide a translation! I’ve just decided against posting in two languages because I am lazy… ;-)

Cloud in a bottle experiment

Guest post by Susann Tegtmeier (written two months ago, I just never got around to posting it. Sorry!)

No one likes clouds when they bring rain, but what if you could make your own? Making a cloud inside a bottle will help us to understand how they are formed in the atmosphere. The experiment demonstrates how changes in air pressure, temperature and volume are related and how these changes can lead to the sudden appearance of tiny water droplets, or in other words, lead to the formation of a cloud.

You can do the experiment alone at home, in front of a classroom or as a hands-on experiment with all your students. I have chosen the latter option as part of my ‘Introduction to meteorology’ lecture for the first-year students in the Bachelor program ‘Physics of the Earth System’. For this class, Mirjam and I received funding from our university’s PerLe project for teaching innovations. We use the PerLe funding to consolidate the student’s physical-based understanding of the climate system through various experiments, exercises and discussions.

For the experiment you need an air-tight, transparent container that you can pump up with air (in order to increase the pressure inside the bottle). We made a simple version using materials from home including a plastic water bottle supplemented with valve from a bike tire that is attached between the bottle and the cap. Furthermore you need a pump (in our case a bike pump), water and matches.

Picture by Susann Tegtmeier

During the first round of the experiment, the students pumped up the bottles enhancing the pressure inside. During our discussion before the experiment, the students assumed correctly that the bottles would warm due to the enhanced pressure under a constant volume. By putting their hands around the bottles, it was possible for the students to feel that indeed the air inside the bottles was warming. When opening the valve slowly the opposite effect could be noticed and the bottles cooled very quickly. While the temperature change is small, it turned out to be quite fascinating and memorable for the students to see and feel the ideal gas law, they learned about earlier in class, in real life action.

During the second round of the experiment, the pumping up of the bottles was repeated, but this time with a small amount of water in the bottles. Since warm air can take up more water vapor than cold air, some of the water in the bottle was evaporated during the increase of pressure and temperature. While we discussed this effect during the experiment, it was, of course, not possible to observe the formation of the invisible water vapor. The next step of the experiment, the opening of the valve and the accompanying cooling of air, can theoretically lead to the condensation of the above discussed water vapor back to water. However, to the surprise of the students, no condensing little water droplets could be seen in the bottles.

Picture by Susann Tegtmeier

In order to lift the mystery, we carried out the third part of the experiment. With the bottle open, we lit a match and a moment later threw the blown out, smoking match into the bottle. Now the bottle needs be closed quickly before the same action (pumping of bottles and opening of valve) can be repeated. Only in this last round of the experiment, the expected water droplets became visible while the air was cooling. The reason is that small condensation nuclei are necessary for water vapor to condense and form water droplets. The experiment demonstrates this effect quite nicely in the bottle, but it also holds on large scales for the formation of atmospheric clouds.

The ‘Cloud in a bottle’ experiment is a perfect class room exercise, as it leads the students within 30 min from the basic, physical principles of the ideal gas law to one of the big climate effects, the aerosol – cloud interaction.

The mystery of Lokksund. Mysterious as ever, and I am still intrigued…

Forget climate change and all the big questions, there is this one thing that is really bugging me because I haven’t figured it out yet, but I really want to: This morning, when I was searching my old backup drives for data for my friend, I came across my favorite oceanography riddle of all times (which is still, as far as I know, unsolved!).

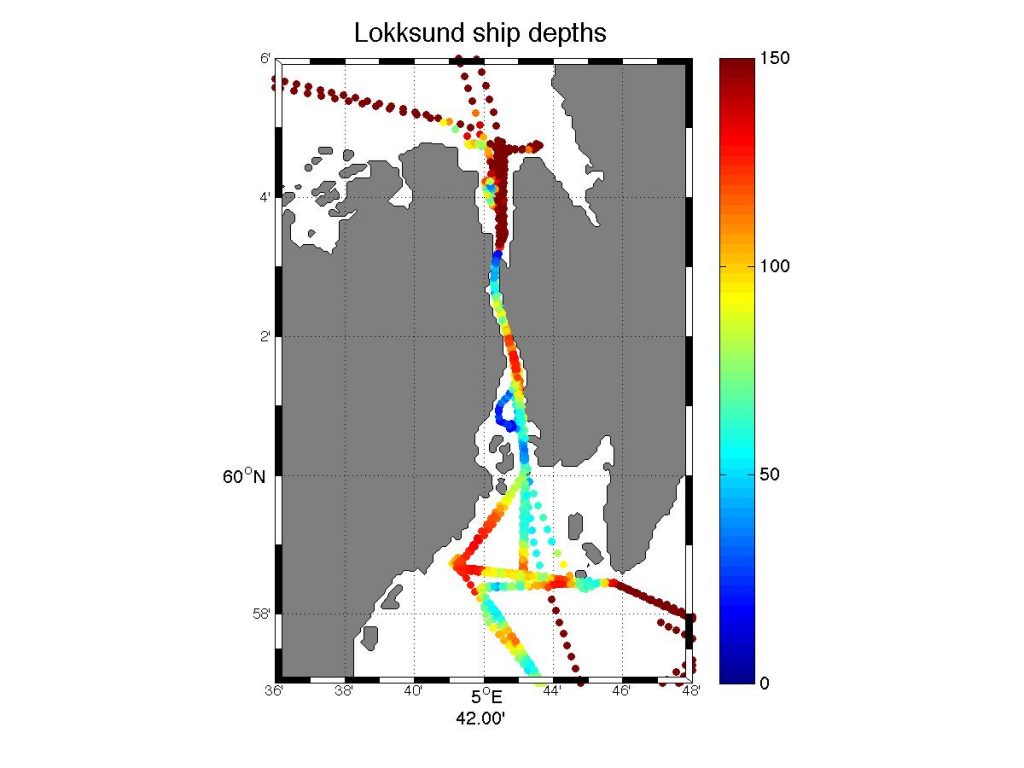
In 2012 and 2013, I went on cruises in the area of Hardangerfjorden, and there is one place that I find very intriguing: A narrow straight, connecting Hardangerfjorden in the south to Bjørnafjorden in the north. This straight is called Lokksund, and in its narrowest bit it’s only something like 20 meters wide and 30 meters deep. Which, as soon as water levels on both ends of the street are not exactly the same, leads to pretty strong currents.

In the description of Norwegian shipping lanes, it says about Lokksund “in the narrow part of the straight, the tidal current can be strong, up to 3-4 knots during spring tides, shifting direction every two hours. It goes southward for two hours before high tide, stops at high tide, goes north for two hours after high tide, and so on. … If there is constant wind from the south, the current can go continuously northwards. For wind from north or west, the same situation can happen with southward currents” (Den norske los 3, Farvannsbeskrivelse, Jørem Rev-Stad, 2006).

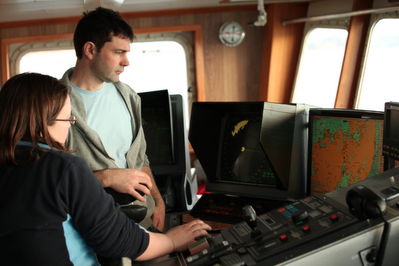
That the current is very strong in the straight was fairly obvious, and captain and crew were understandably not too happy that we wanted to spend a lot of time there (funnily enough, it’s Lokksund you see on the map on the screen in the picture below! Clearly, I really wanted to go there!).

Screen shot 2012-03-09 at 6.24.50 PM

On the bridge, discussing the scientific plan for the next day. Picture courtesy of Angus Munro.

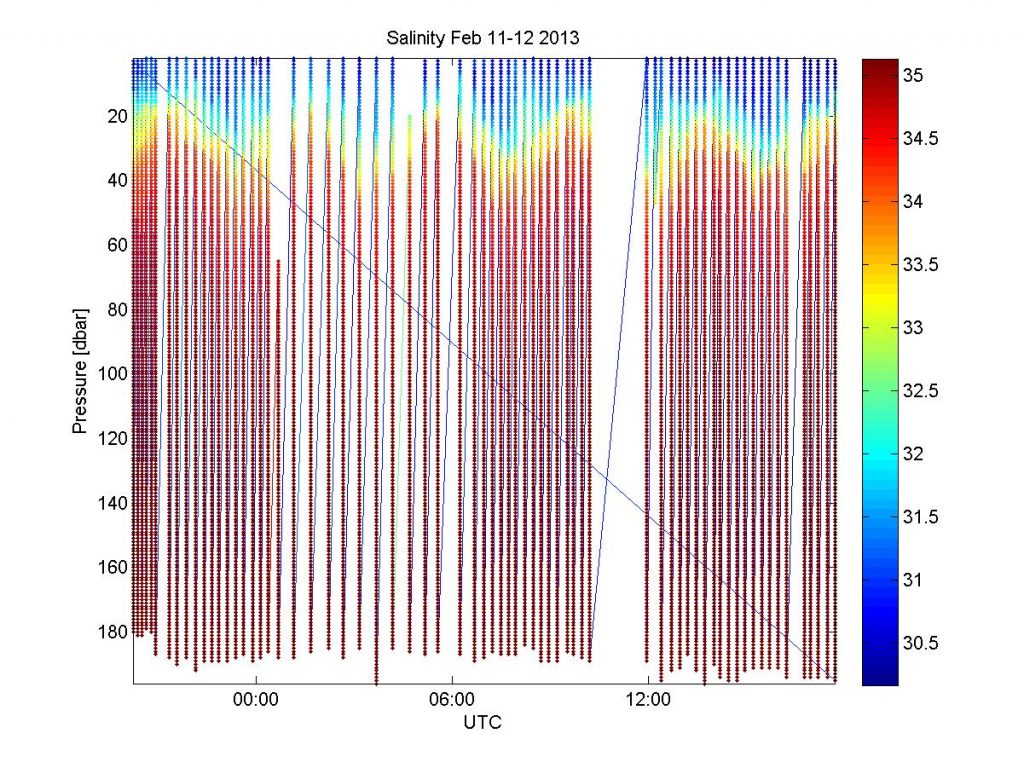
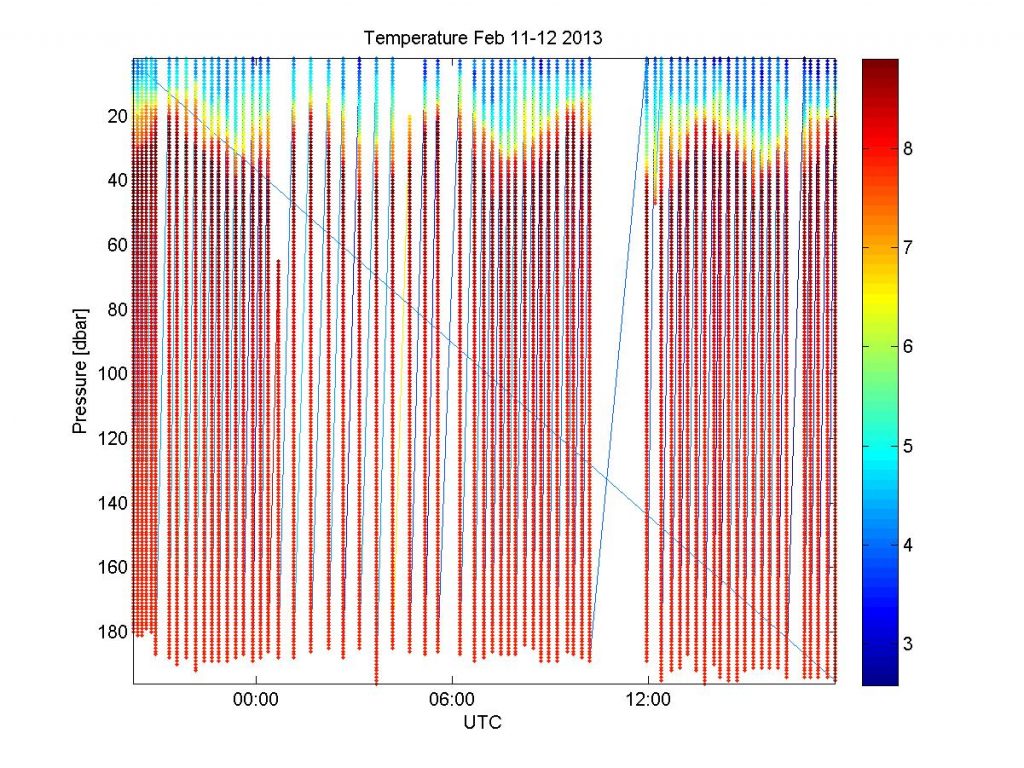
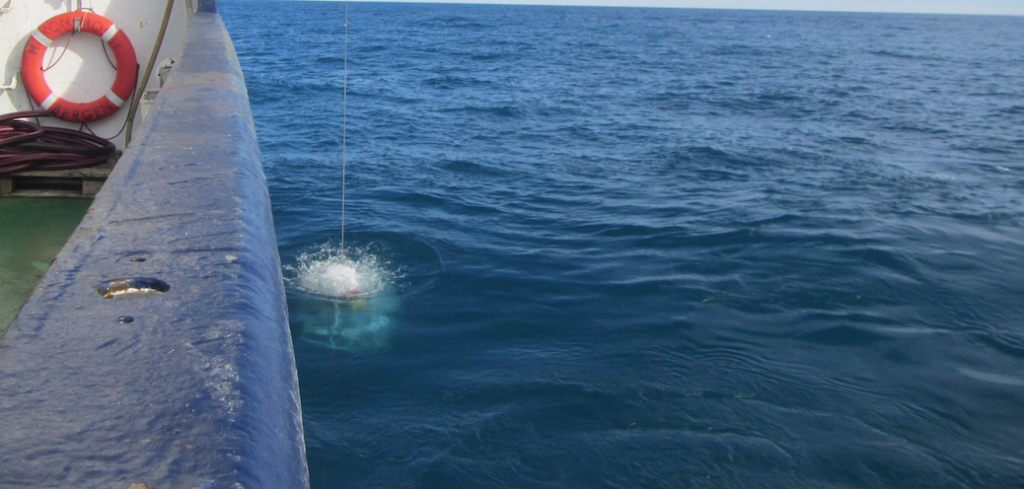
However, the current directions that we observed didn’t seem to agree with the farvannsbeskrivelse, but they also did not seem to agree with tides from mooring data we had from north and south of the mouths of Lokksund. So we ended up doing a repeat CTD station just north of Lokksund. The CTD data is very interesting:

Above, you see a plot for salinity, and below for temperature. And there is a strong interface in both S and T — approximately at sill depth! — that is oscillating with the same frequency as described in the farvannsbeskrivelse, although from what I remember the timing was somehow different from what we expected based on the tides from the mooring data we had available.

Also, looking at how narrow the straight is, even with peak speeds of 3-4 knots, the volume of water that can actually go through Lokksund is actually very small. So even though the mixing in the narrow spots with high speeds is probably very high, the volume of displaced water is still very very low, and it’s not even clear how big its influence on mixing between the two fjords is.

But that’s not what makes me so intrigued: It should be such an easy system to understand: A narrow straight and water levels on either end driving the flow through the straight. Right? Except there is clearly more to it, and I wish I could go back there and figure out what that is!

I know for a fact that to this day, some of the crew vividly remember the time we spent in Lokksund during that cruise, and that they don’t have the fondest memories of being in a narrow straight in a strong current in the dark. But I still think it was good we spent all that time there, and luckily Elin is taking on this riddle now, hope you will keep us posted on what you find! :-)