#BergenWaveWatching: Ruins of a wave power plant
Reposted from Elin’s blog:
Kjersti, Steffi, Elin and myself (Mirjam) recently discussed ways to better integrate the GEOF105 student cruise into the course. My suggestion was to ask the students to observe things throughout the whole duration of the course, and then have them relate their time series with what they observe when “at sea”. In this mini series tagged #BergenWaveWatching, I write up a couple of suggestions I have for observations that are easy and fun to make. I am anticipating that my suggestions will be strongly biased towards #wavewatching, so if you have any other suggestions, I am all ears! :-)
Where to go
Bølgekraftverket in Øygården
When to go
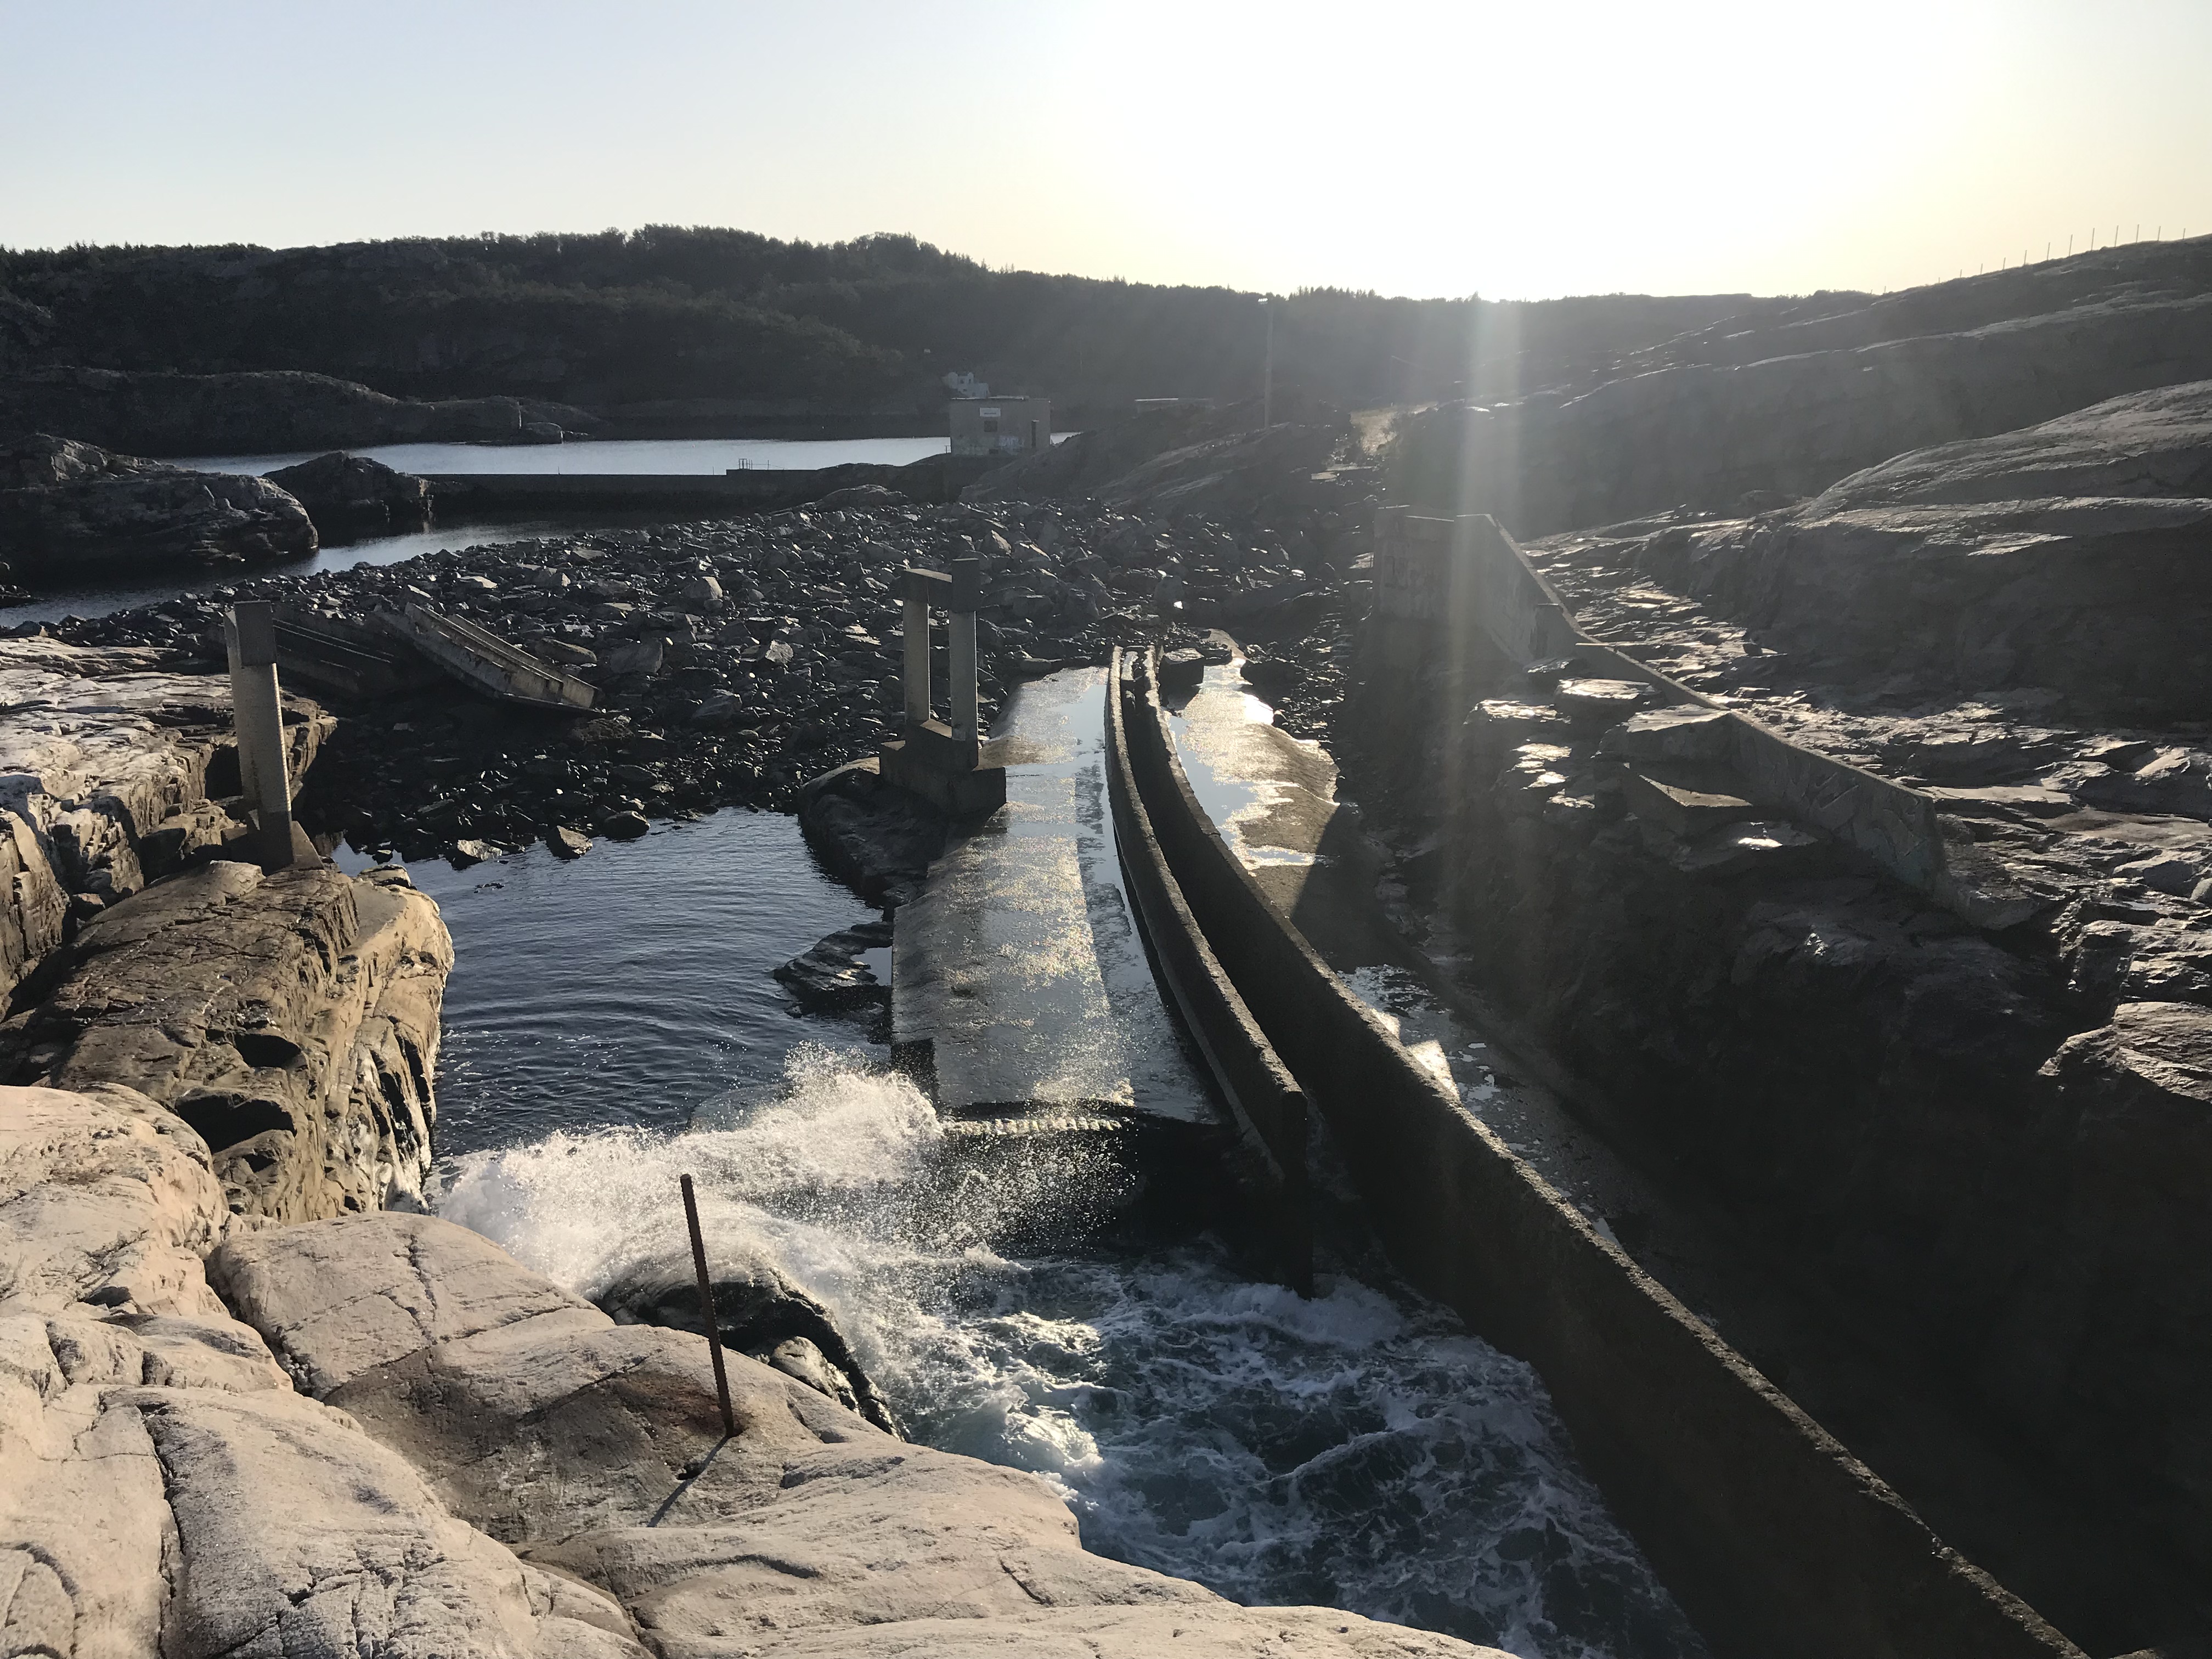
Until recently I would have said that it doesn’t really matter when you are going, because whenever I had been there I got to see things like this:
But then I went there and there were absolutely no waves to be seen, which I think was a combination of a calm day with hardly any wind, no swell coming in either, and very low water levels, possibly tides and in general. So I would recommend going there when there is wind and also the water levels aren’t super low so any potential waves actually have the chance to make it into the area of the wave power plant.
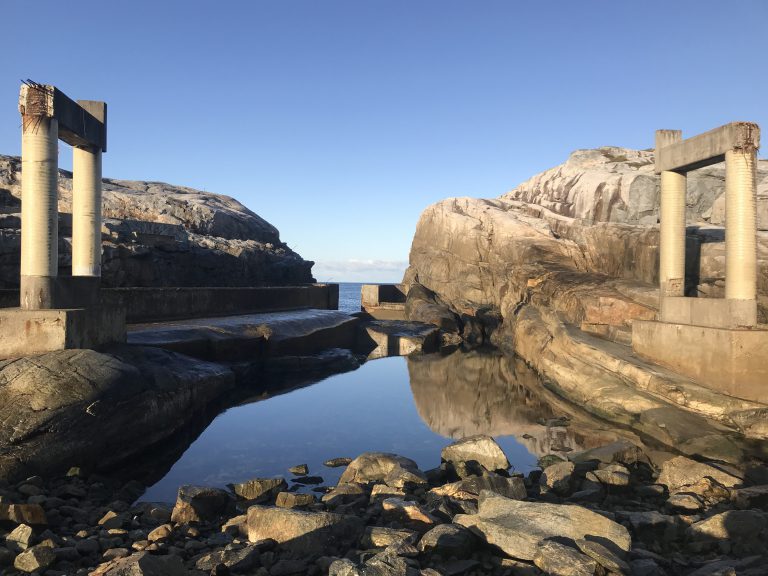
Unusually calm day at the wave power plant. See the pillars that used to carry a bridge across here?
A one-off visit on a wavy day should give you plenty of things to discover and think about, but you might get addicted and come back again ;-)
What to look out for
There are at least two parts of the wave power plant where you can clearly recognize how they were supposed to work when they were still in operation. A wave power plant where waves used to drive a turbine, and another one where waves run up a funnel to fill a reservoir. But in general it’s a pretty awesome wave watching spots with some rocks that are usually just below or at water level, steep cliffs, areas that are exposed to the open ocean while others are sheltered from the waves and wind. So much to explore!
What to do with the data
“Data” here means your pics and movies of the waves.
I find it super interesting to just describe the observations of the waves around the island and wave power plant, and it might keep you busy for a while (see for example the two blog posts I linked to in the paragraph above). But you could of course also look into wave conditions in this spot. What does the wave forecast say for the day you are visiting? How do the wave conditions on that day compare to the average conditions? Or the day when the power plant got destroyed? Or the most recent extreme events? How often do extreme events occur? And what conditions actually make an event “extreme” in this place?
How this is relevant for the student cruise
Understanding waves and their enormous forces is relevant for anyone who wants to work with ocean observations or any kind of structures in the ocean. This is the ideal spot to become aware of how fragile any human structure is when confronted with the forces of nature. Also looking at wave fields more closely, both in observations and in models, is a great way to connect to what’s really going on in the ocean.
Do you have suggestions for us? What other spots or topics would you recommend in and around Bergen to be added to the #BergenWaveWatching list? Please leave a comment! We are always looking to expand this list!