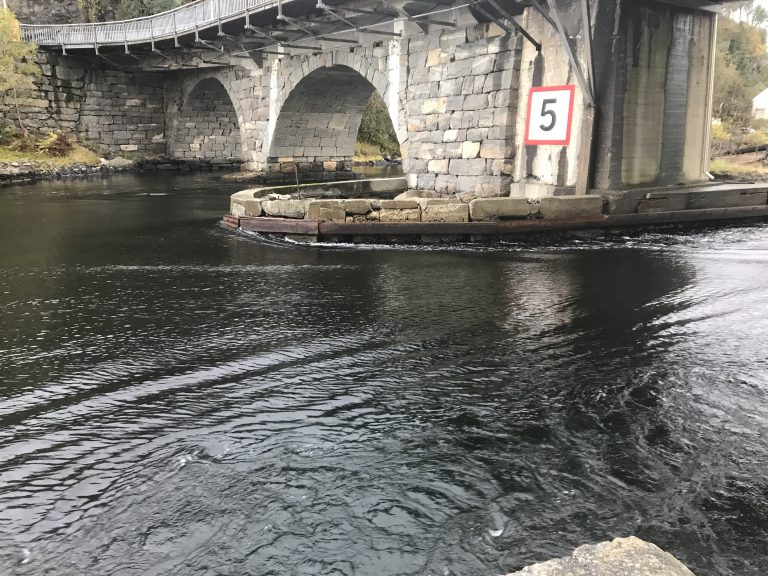
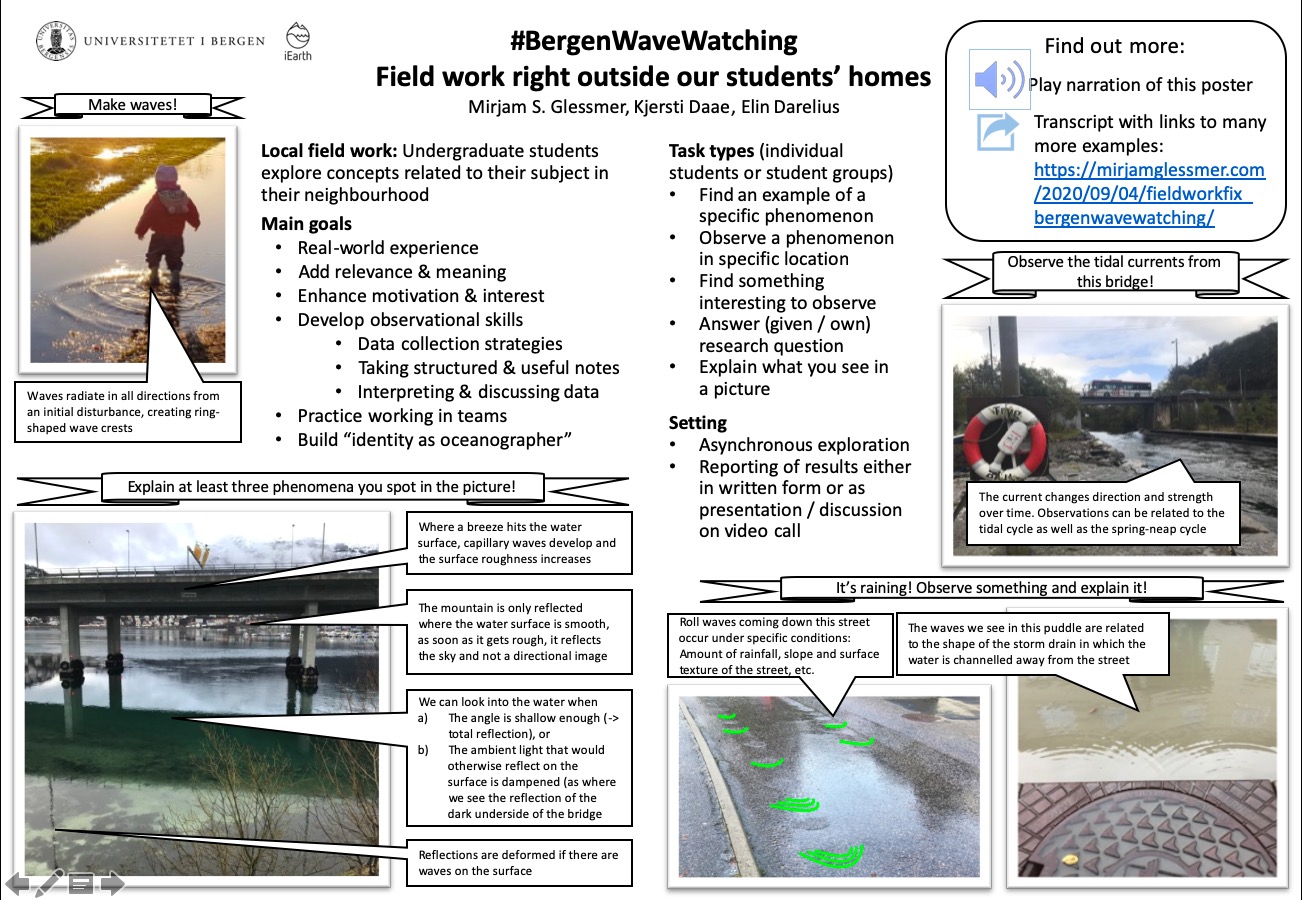
Tag Archives: #BergenWaveWatching

#BergenWaveWatching: Rainbows!

Reposting from Elin’s blog here!

Kjersti, Steffi, Elin and myself (Mirjam) recently discussed ways to better integrate the GEOF105 student cruise into the course. My suggestion was to ask the students to observe things throughout the whole duration of the course, and then have them relate their time series with what they observe when “at sea”. In this mini series tagged #BergenWaveWatching, I write up a couple of suggestions I have for observations that are easy and fun to make. I am anticipating that my suggestions will be strongly biased towards #wavewatching, so if you have any other suggestions, I am all ears! :-)

Neither wave watching nor particularly Bergen-specific, but still super cool! And probably as close as I will ever come to suggesting any kind of meteorological observation. Clouds are pretty amazing, too, but I really don’t know enough about those…

Where to go

Nowhere specific, just keep an eye out for situations in which there are water droplets in the air and the sun is low enough in the sky for rainbows to appear. Be aware of where rainbows would appear if they were visible (the shadow of your head would be in the center of the rainbow) and check out if they are there.

It doesn’t actually have to rain for rainbows to appear…

When to go

Since the sun needs to be sufficiently low in the sky for rainbows to be above the ground, rainbows are more likely to appear in the morning and afternoon.

What to look out for

Duh. Rainbows?

What to do with the data

I think it could be fun to try and relate the appearance of rainbows to the kind of weather. Obviously, you need both sun and rain. But for double rainbows, you need several rain fronts behind each other. And for a secondary rainbow as in the picture on the very top (blog post on that here), you need strong sunshine.

The observations suggested here are also well suited for a description of the phenomenon and an explanation of the physics behind it.

How this is relevant for the student cruise

Not directly, but I think getting into the habit of observing something fairly specific and, over time, becoming an expert on spotting and explaining rainbows, is pretty awesome!

Do you have suggestions for us? What other spots or topics would you recommend in and around Bergen to be added to the #BergenWaveWatching list? Please leave a comment! We are always looking to expand this list!

#BergenWaveWatching: “Remote sensing”

Reposting from Elin’s blog:

Kjersti, Steffi, Elin and myself (Mirjam) recently discussed ways to better integrate the GEOF105 student cruise into the course. My suggestion was to ask the students to observe things throughout the whole duration of the course, and then have them relate their time series with what they observe when “at sea”. In this mini series tagged #BergenWaveWatching, I write up a couple of suggestions I have for observations that are easy and fun to make. I am anticipating that my suggestions will be strongly biased towards #wavewatching, so if you have any other suggestions, I am all ears! :-)

Where to go

Anywhere where you can look out over water, for example Fjellveien (where the picture above was taken from) or Fløyen

When to go

Any time

What to look out for

Pattern on the water. Can you see wakes? Langmuir circulation? Gusts of wind? Areas that are sheltered from the wind?

Langmuir circulation in Østerfjorden, described here.

What to do with the data

Observe closely and try to make sense of it by relating it to, for example, ships, weather at that time, …

Do you have suggestions for us? What other spots or topics would you recommend in and around Bergen to be added to the #BergenWaveWatching list? Please leave a comment! We are always looking to expand this list!

#BergenWaveWatching: Bergen Harbour

Reposted from Elin’s blog:

Kjersti, Steffi, Elin and myself (Mirjam) recently discussed ways to better integrate the GEOF105 student cruise into the course. My suggestion was to ask the students to observe things throughout the whole duration of the course, and then have them relate their time series with what they observe when “at sea”. In this mini series tagged #BergenWaveWatching, I write up a couple of suggestions I have for observations that are easy and fun to make. I am anticipating that my suggestions will be strongly biased towards #wavewatching, so if you have any other suggestions, I am all ears! :-)

Where to go

Bergen Harbour

When to go

Any time you might have to run errands around there anyway

What to look out for

So many things! Here are a couple of examples:

  • Waves. What direction are they coming from? What causes them?
  • Wakes, as a special form of waves. Which ship/animal did they originate from?
  • Reflections of waves on the straight walls of the harbour basin (like I did here)
  • Tides
  • Water levels in general

What to do with the data

Describe and try to make sense of it by relating it to other variables like wind speed and direction, atmospheric pressure, tides, shape of the boundaries, ships, etc, like I did for example here.

Do you have suggestions for us? What other spots or topics would you recommend in and around Bergen to be added to the #BergenWaveWatching list? Please leave a comment! We are always looking to expand this list!

#BergenWaveWatching: On vibrating surfaces

Reposting from Elin’s blog:

Kjersti, Steffi, Elin and myself (Mirjam) recently discussed ways to better integrate the GEOF105 student cruise into the course. My suggestion was to ask the students to observe things throughout the whole duration of the course, and then have them relate their time series with what they observe when “at sea”. In this mini series tagged #BergenWaveWatching, I write up a couple of suggestions I have for observations that are easy and fun to make. I am anticipating that my suggestions will be strongly biased towards #wavewatching, so if you have any other suggestions, I am all ears! :-)

Where to go

We spotted standing waves in a bucket on the latest GEOF105 student cruise, but in addition to on ships, they can also be spotted for example on trains (see pic below), in cars, or even on washing machines.

What to look out for

The pattern that form on the surface of vibrating fluids

What to do with the data

Describe the pattern and try to understand why it looks the way it does (like I did here). Is it the frequency of vibration? The shape of the vessel? The material of the vessel? The location relative to the source of vibration?

Do you have suggestions for us? What other spots or topics would you recommend in and around Bergen to be added to the #BergenWaveWatching list? Please leave a comment! We are always looking to expand this list!

#BergenWaveWatching: Ruins of a wave power plant

Reposted from Elin’s blog:

Kjersti, Steffi, Elin and myself (Mirjam) recently discussed ways to better integrate the GEOF105 student cruise into the course. My suggestion was to ask the students to observe things throughout the whole duration of the course, and then have them relate their time series with what they observe when “at sea”. In this mini series tagged #BergenWaveWatching, I write up a couple of suggestions I have for observations that are easy and fun to make. I am anticipating that my suggestions will be strongly biased towards #wavewatching, so if you have any other suggestions, I am all ears! :-)

Where to go

Bølgekraftverket in Øygården

When to go

Until recently I would have said that it doesn’t really matter when you are going, because whenever I had been there I got to see things like this:

But then I went there and there were absolutely no waves to be seen, which I think was a combination of a calm day with hardly any wind, no swell coming in either, and very low water levels, possibly tides and in general. So I would recommend going there when there is wind and also the water levels aren’t super low so any potential waves actually have the chance to make it into the area of the wave power plant.

Unusually calm day at the wave power plant. See the pillars that used to carry a bridge across here?

A one-off visit on a wavy day should give you plenty of things to discover and think about, but you might get addicted and come back again ;-)

What to look out for

There are at least two parts of the wave power plant where you can clearly recognize how they were supposed to work when they were still in operation. A wave power plant where waves used to drive a turbine, and another one where waves run up a funnel to fill a reservoir. But in general it’s a pretty awesome wave watching spots with some rocks that are usually just below or at water level, steep cliffs, areas that are exposed to the open ocean while others are sheltered from the waves and wind. So much to explore!

What to do with the data

“Data” here means your pics and movies of the waves.

I find it super interesting to just describe the observations of the waves around the island and wave power plant, and it might keep you busy for a while (see for example the two blog posts I linked to in the paragraph above). But you could of course also look into wave conditions in this spot. What does the wave forecast say for the day you are visiting? How do the wave conditions on that day compare to the average conditions? Or the day when the power plant got destroyed? Or the most recent extreme events? How often do extreme events occur? And what conditions actually make an event “extreme” in this place?

How this is relevant for the student cruise

Understanding waves and their enormous forces is relevant for anyone who wants to work with ocean observations or any kind of structures in the ocean. This is the ideal spot to become aware of how fragile any human structure is when confronted with the forces of nature. Also looking at wave fields more closely, both in observations and in models, is a great way to connect to what’s really going on in the ocean.

Do you have suggestions for us? What other spots or topics would you recommend in and around Bergen to be added to the #BergenWaveWatching list? Please leave a comment! We are always looking to expand this list!

#BergenWaveWatching: Gutters and storm drains

Reposted from Elin’s blog:

Kjersti, Steffi, Elin and myself (Mirjam) recently discussed ways to better integrate the GEOF105 student cruise into the course. My suggestion was to ask the students to observe things throughout the whole duration of the course, and then have them relate their time series with what they observe when “at sea”. In this mini series tagged #BergenWaveWatching, I write up a couple of suggestions I have for observations that are easy and fun to make. I am anticipating that my suggestions will be strongly biased towards #wavewatching, so if you have any other suggestions, I am all ears! :-)

Where to go

Pretty much anywhere you like / need to go to anyway

When to go

When it’s raining

What to look out for

Pattern in puddles, gutters, storm drains. Because there is so much more to them than just being the means of getting rid of water or annoyances where water has accumulated! For example, check out the roll waves in the picture above and my blog post on those.

Or the picture below. What’s going on there? Solution to this wave riddle here.

Waves on a puddle on a street in Bergen. Picture from this blog post.

What to do with the data

Collect, describe, become more aware of what is happening everywhere around you.

How this is relevant for the student cruise

Not directly, it’s about forming the habit of looking at the world through the eyes of someone who’s interested in waves, which can then lead into the habit of looking at the world with a focus on anything you are specifically interested in.

Do you have suggestions for us? What other spots or topics would you recommend in and around Bergen to be added to the #BergenWaveWatching list? Please leave a comment! We are always looking to expand this list!

#BergenWaveWatching: Looking at waves from all sides in Lille Lungegårdsvannet

Reposted from Elin’s blog:

Kjersti, Steffi, Elin and myself (Mirjam) recently discussed ways to better integrate the GEOF105 student cruise into the course. My suggestion was to ask the students to observe things throughout the whole duration of the course, and then have them relate their time series with what they observe when “at sea”. In this mini series tagged #BergenWaveWatching, I write up a couple of suggestions I have for observations that are easy and fun to make. I am anticipating that my suggestions will be strongly biased towards #wavewatching, so if you have any other suggestions, I am all ears! :-)

Today we have another really accessible spot in Bergen that is super well suited for wave watching!

Where to go

Lille Lungegårdsvannet in Bergen city center

When to go

Whenever you happen to walk past there anyway

What to look out for

Suggestion 1: Waves and wind direction. The latter is very easy to observe from the fountain. And Lille Lungegårdsvannet is amazing for wave watching because you can walk all the way around and see waves from all sides!

Looking at Lille Lungegårdsvannet with the wind. Waves only appear at a distance from the shore in the foreground, because the water is sheltered from the wind by the shore. Blog post on this here.

Suggestion 2: wave reflection. Due to the geometric shape of Lille Lungegårdsvannet with all the straight edges all around, wave reflection can lead to really cool pattern! Can you relate what’s going on to the wind direction?

What to do with the data

Depending on how often you go, you can either relate the wave field to the wind direction and strength (both your own estimates and what the weather forecast says about those). Or you can describe a single situation like I did for example here.

Looking across Lille Lungegårdsvannet into the wind. See how the waves are now a lot taller than in the picture above? Blog post on this here.


The geometric shape of Lille Lungegårdsvannet leads to pretty reflections! Picture from this post

How this is relevant for the student cruise

Understanding waves is very relevant for anyone being on the water. Whether you are riding off a storm, deploying instrumentation or trying to keep the boat as steady as possible for sensitive work, being able to read the waves is key.

Also, connecting observations of conditions at land and sea to wind speeds is how the Beaufort scale was originally defined. Of course, you won’t see a fully developed wave field on a body of water as small as Lille Lungegårdsvannet, but it’s a good first step to observe differences.

Do you have suggestions for us? What other spots or topics would you recommend in and around Bergen to be added to the #BergenWaveWatching list? Please leave a comment! We are always looking to expand this list!

#BergenWaveWatching: observing waves and tides on Storelungeren

Reposted from Elin’s blog:

Kjersti, Steffi, Elin and myself (Mirjam) recently discussed ways to better integrate the GEOF105 student cruise into the course. My suggestion was to ask the students to observe things throughout the whole duration of the course, and then have them relate their time series with what they observe when “at sea”. In this mini series tagged #BergenWaveWatching, I write up a couple of suggestions I have for observations that are easy and fun to make. I am anticipating that my suggestions will be strongly biased towards #wavewatching, so if you have any other suggestions, I am all ears! :-)

Really close to home today! Nygårdsbruen.

Where to go

Nygårdsbruen — the bridge right next to GFI

When to go

Whenever you are going to or leaving GFI anyway works fine, especially if that happens to be at around the same time every day

What to look out for

That kind of depends on how regularly you will realistically be able to go there. If you are there several times per week, you could look at the tidal current. Which direction is it going in, how strong is it, what’s the water level like, …?

If you aren’t going as often, maybe focus more on a general description of what is going on. Is there a tidal current visible? Is it going in or out? Does it have an influence on the wave field? What other factors influence the wave field? What’s the wind direction? Can you see areas that are sheltered from the wind and areas where the wave field is more developed? Can you easily look into the water? Where, and where not? Why is that? That kind of stuff.

The current acts as a barrier to wind-generated waves. How cool is that? Blog post on this here.

What to do with the data

By “data”, I mean the collection of pictures on your smartphone. You could, for example, relate them (thanks to the phone’s time stamp on the pictures) to time before/after high water as I did in this post for tides on the Elbe river in Germany. This of course doesn’t account for the spring/neap signal, which you might want to include.

Questions that I find interesting: When is the strongest current actually happening relative to high water, and within the spring/neap cycle? In what way do ingoing and outgoing currents differ (and why? Shape of the landscape? Different gradients in the water level? …)?

Or, if you don’t have a lot of data from different days, describe what you see (maybe similarly to what I did here).

Looking towards Storelungeren. See there are at least four different areas of what you see on the water? (Being able to look into it clearly, being able to look into it where shaded by the bridge, reflection of the other shore, rough surface due to wind waves)

How this is relevant for the student cruise

One task on the GEOF105 student cruise is relating trajectories of drifters to several factors. The wind field on that day, for example, but also the tidal currents in byfjorden. So having a good intuitive understanding of tides makes interpreting the drifters’ trajectories a lot easier, even though the drifters will be deployed in a different area.

More generally, this suggestion is about repeatedly observing a very easily accessible body of water and looking at how it looks different each time. This is good practice of observational skills, and also eye-opening to the many ways in which a body of water can look different at different times — different times in the tidal cycle, different seasons, different weather, especially different winds.

Do you have suggestions for us? What other spots or topics would you recommend in and around Bergen to be added to the #BergenWaveWatching list? Please leave a comment! We are always looking to expand this list!

#BergenWaveWatching: observing the tides from a bus

Reposted from Elin’s blog:

Kjersti, Steffi, Elin and myself (Mirjam) recently discussed ways to better integrate the GEOF105 student cruise into the course. My suggestion was to ask the students to observe things throughout the whole duration of the course, and then have them relate their time series with what they observe when “at sea”. In this mini series tagged #BergenWaveWatching, I write up a couple of suggestions I have for observations that are easy and fun to make. I am anticipating that my suggestions will be strongly biased towards #wavewatching, so if you have any other suggestions, I am all ears! :-)

My first recommendation in this series is actually more about watching tides than watching waves, but it is impressive and well worth a visit!

Where to go

Straume Bru — either get off the bus 51 at that bus stop and walk around (as I did for this blog post), or, if you have to take that bus regularly anyway, just observe from the bus.

Observing the tidal current at Straume Bru from the bus

When to go

If you are going for a one-off visit, you might be well-advised to look at the tidal forecast and time your visit so you are there a little later than half time between high water and low water (or, I am assuming, low water and high water), so you will be able to observe strong tidal currents. As the currents change direction when the tide turns, there will also be periods with no current or very weak current, which are probably not nearly as impressive. Ideally I would want to spend a full tidal cycle there, but I haven’t gotten around to doing that yet. Maybe you will?

If you only pass the current on the bus, then you will hopefully do it often and take many pictures!

What to look out for

If you are at Straume Bru at the right time, you will be able to see a strong current going underneath the bridge. You might want to take pictures of the current that also include features of either the bridge or other structures or landmarks, so you can relate this and further pictures you might take to each other. What’s the water level like? How strong is the current? Which direction is it going in?

A picture of the tidal current at Straume Bru, including the bridge itself for scale and reference

What to do with the data

By “data”, I mean the collection of pictures on your smartphone. You could, for example, relate them (thanks to the phone’s time stamp on the pictures) to time before/after high water as I did in this post for tides on the Elbe river in Germany. This of course doesn’t account for the spring/neap signal, which you might want to include.

Questions that I find interesting: When is the strongest current actually happening relative to high water, and within the spring/neap cycle? In what way do ingoing and outgoing currents differ (and why? Shape of the landscape? Different gradients in the water level? …)?

How this is relevant for the student cruise

One task on the GEOF105 student cruise is relating trajectories of drifters to several factors. The wind field on that day, for example, but also the tidal currents in Byfjorden. Even though the drifters will be deployed in a different area, having a good intuitive understanding of tides makes interpreting the drifters’ trajectories a lot easier.

Do you have suggestions for us? What other spots or topics would you recommend in and around Bergen to be added to the #BergenWaveWatching list? Please leave a comment! We are always looking to expand this list!