Tag: turbulence
Rotating vs non-rotating turbulence
Last Thursday, Torge & I invited his “atmosphere & ocean dynamics class” to a virtual excursion into my kitchen — to do some cool experiments. As you know, I have the DIYnamics rotating table setup at home, so this is what it looked like: We did two experiments, the very boring (but very important) solid […]
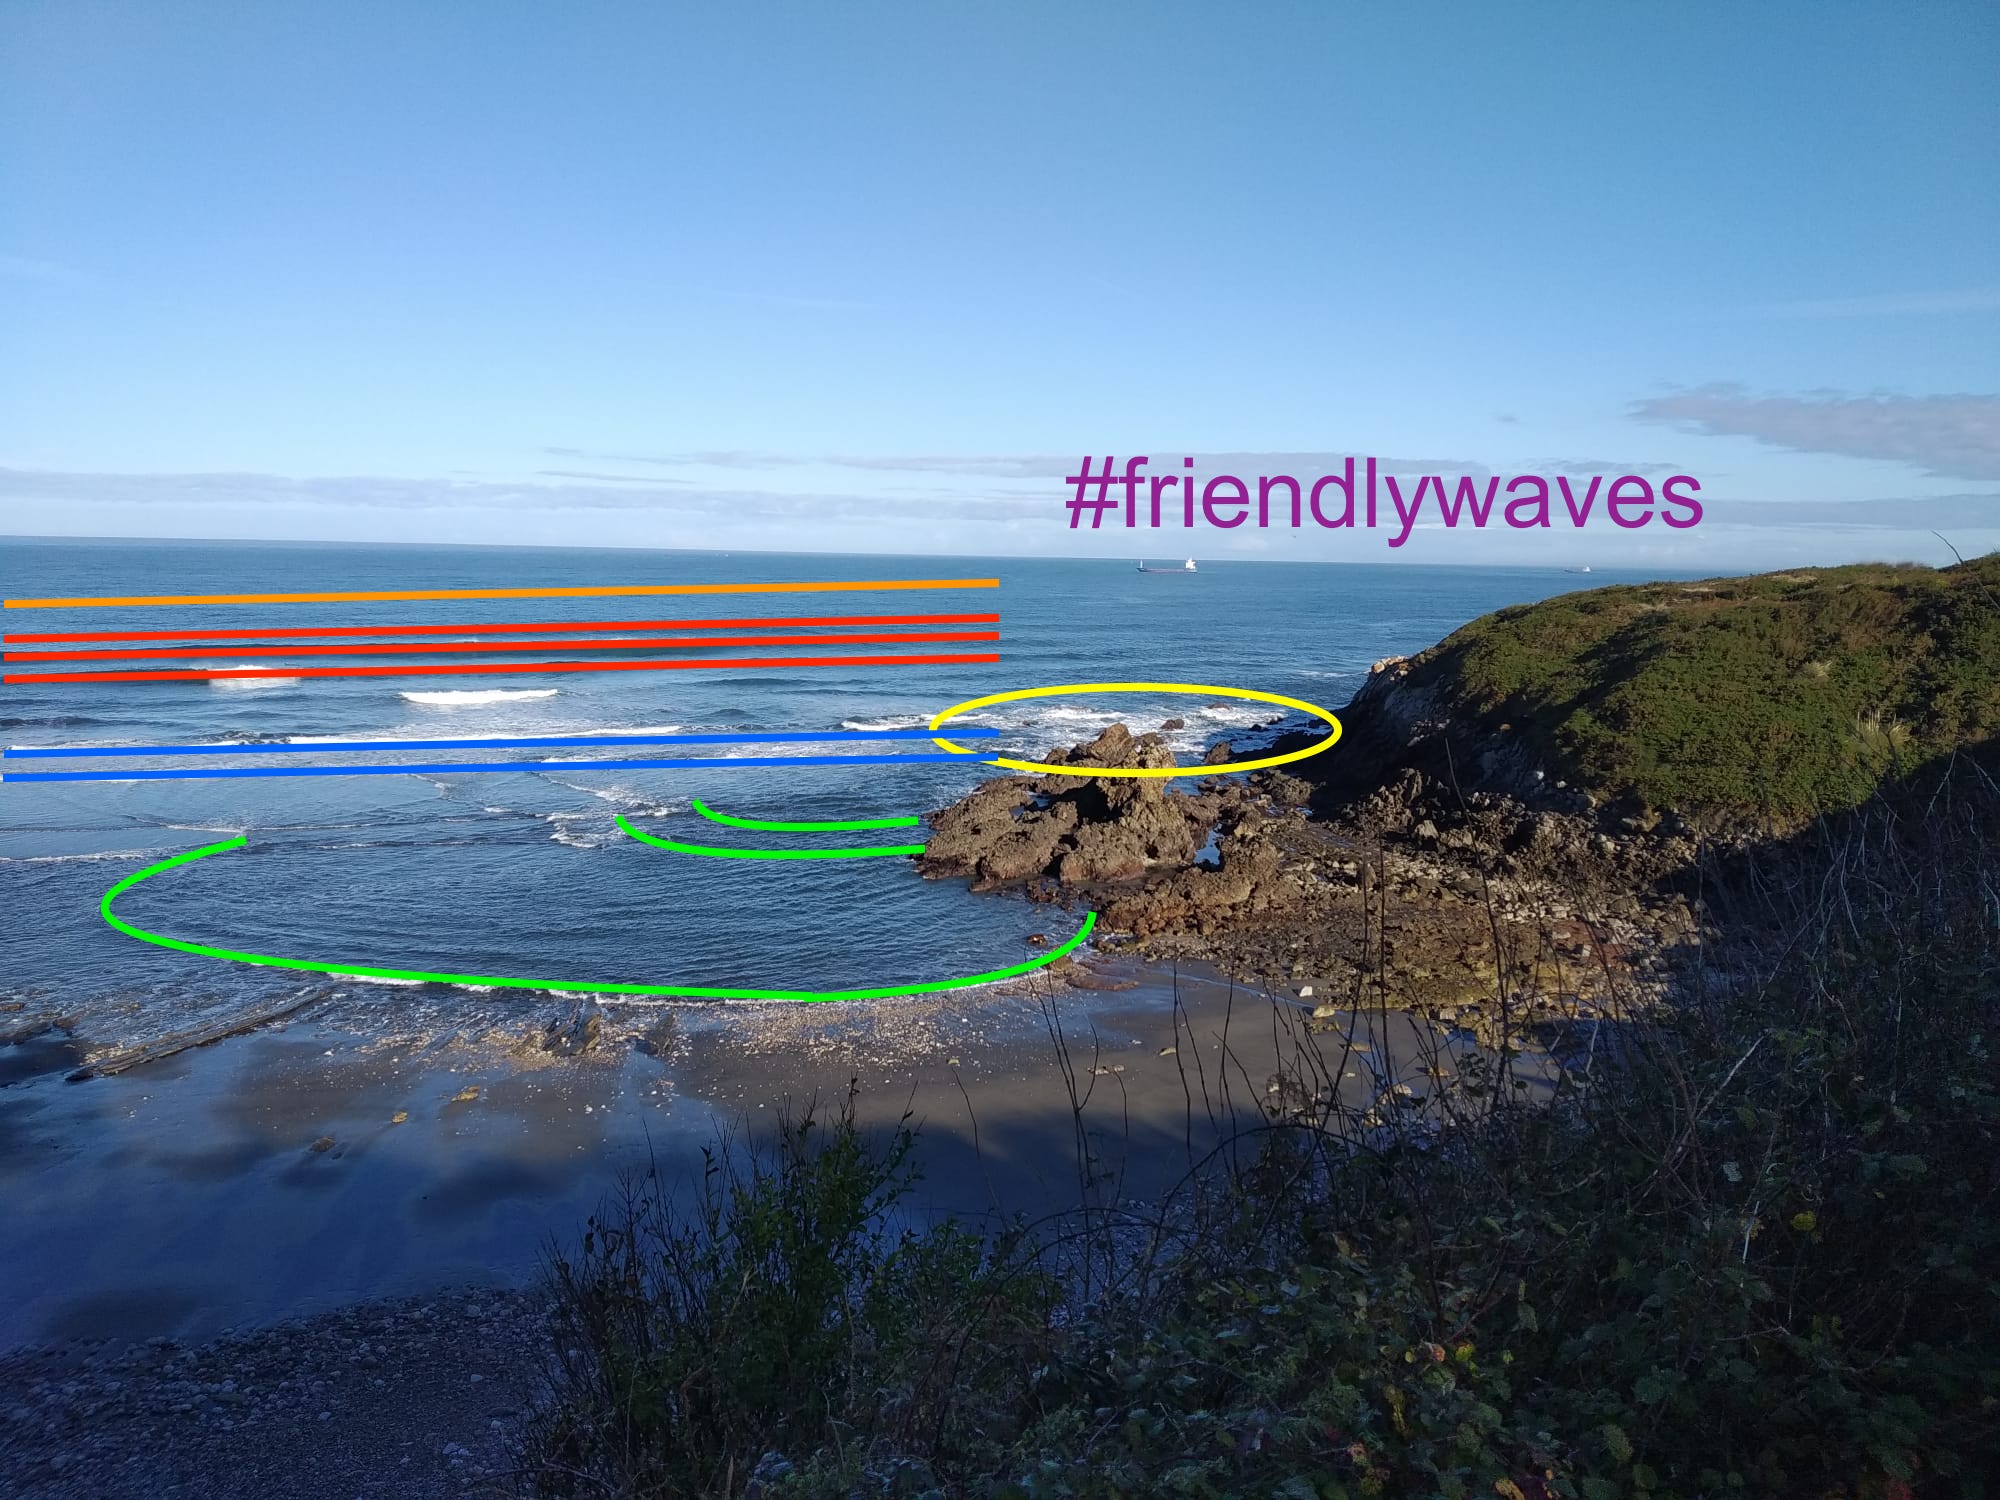
A beautiful #friendlywaves from Spain
A reader of my blog, Rocío*, sent me this beautiful image from Arnao beach (Castrillón- Asturias-Spain), and I asked if I could use it in a #friendlywaves post. He agreed, so here we go! First, let’s check out the original image in all its beauty, before I start scribbling on it. What features of the waves […]
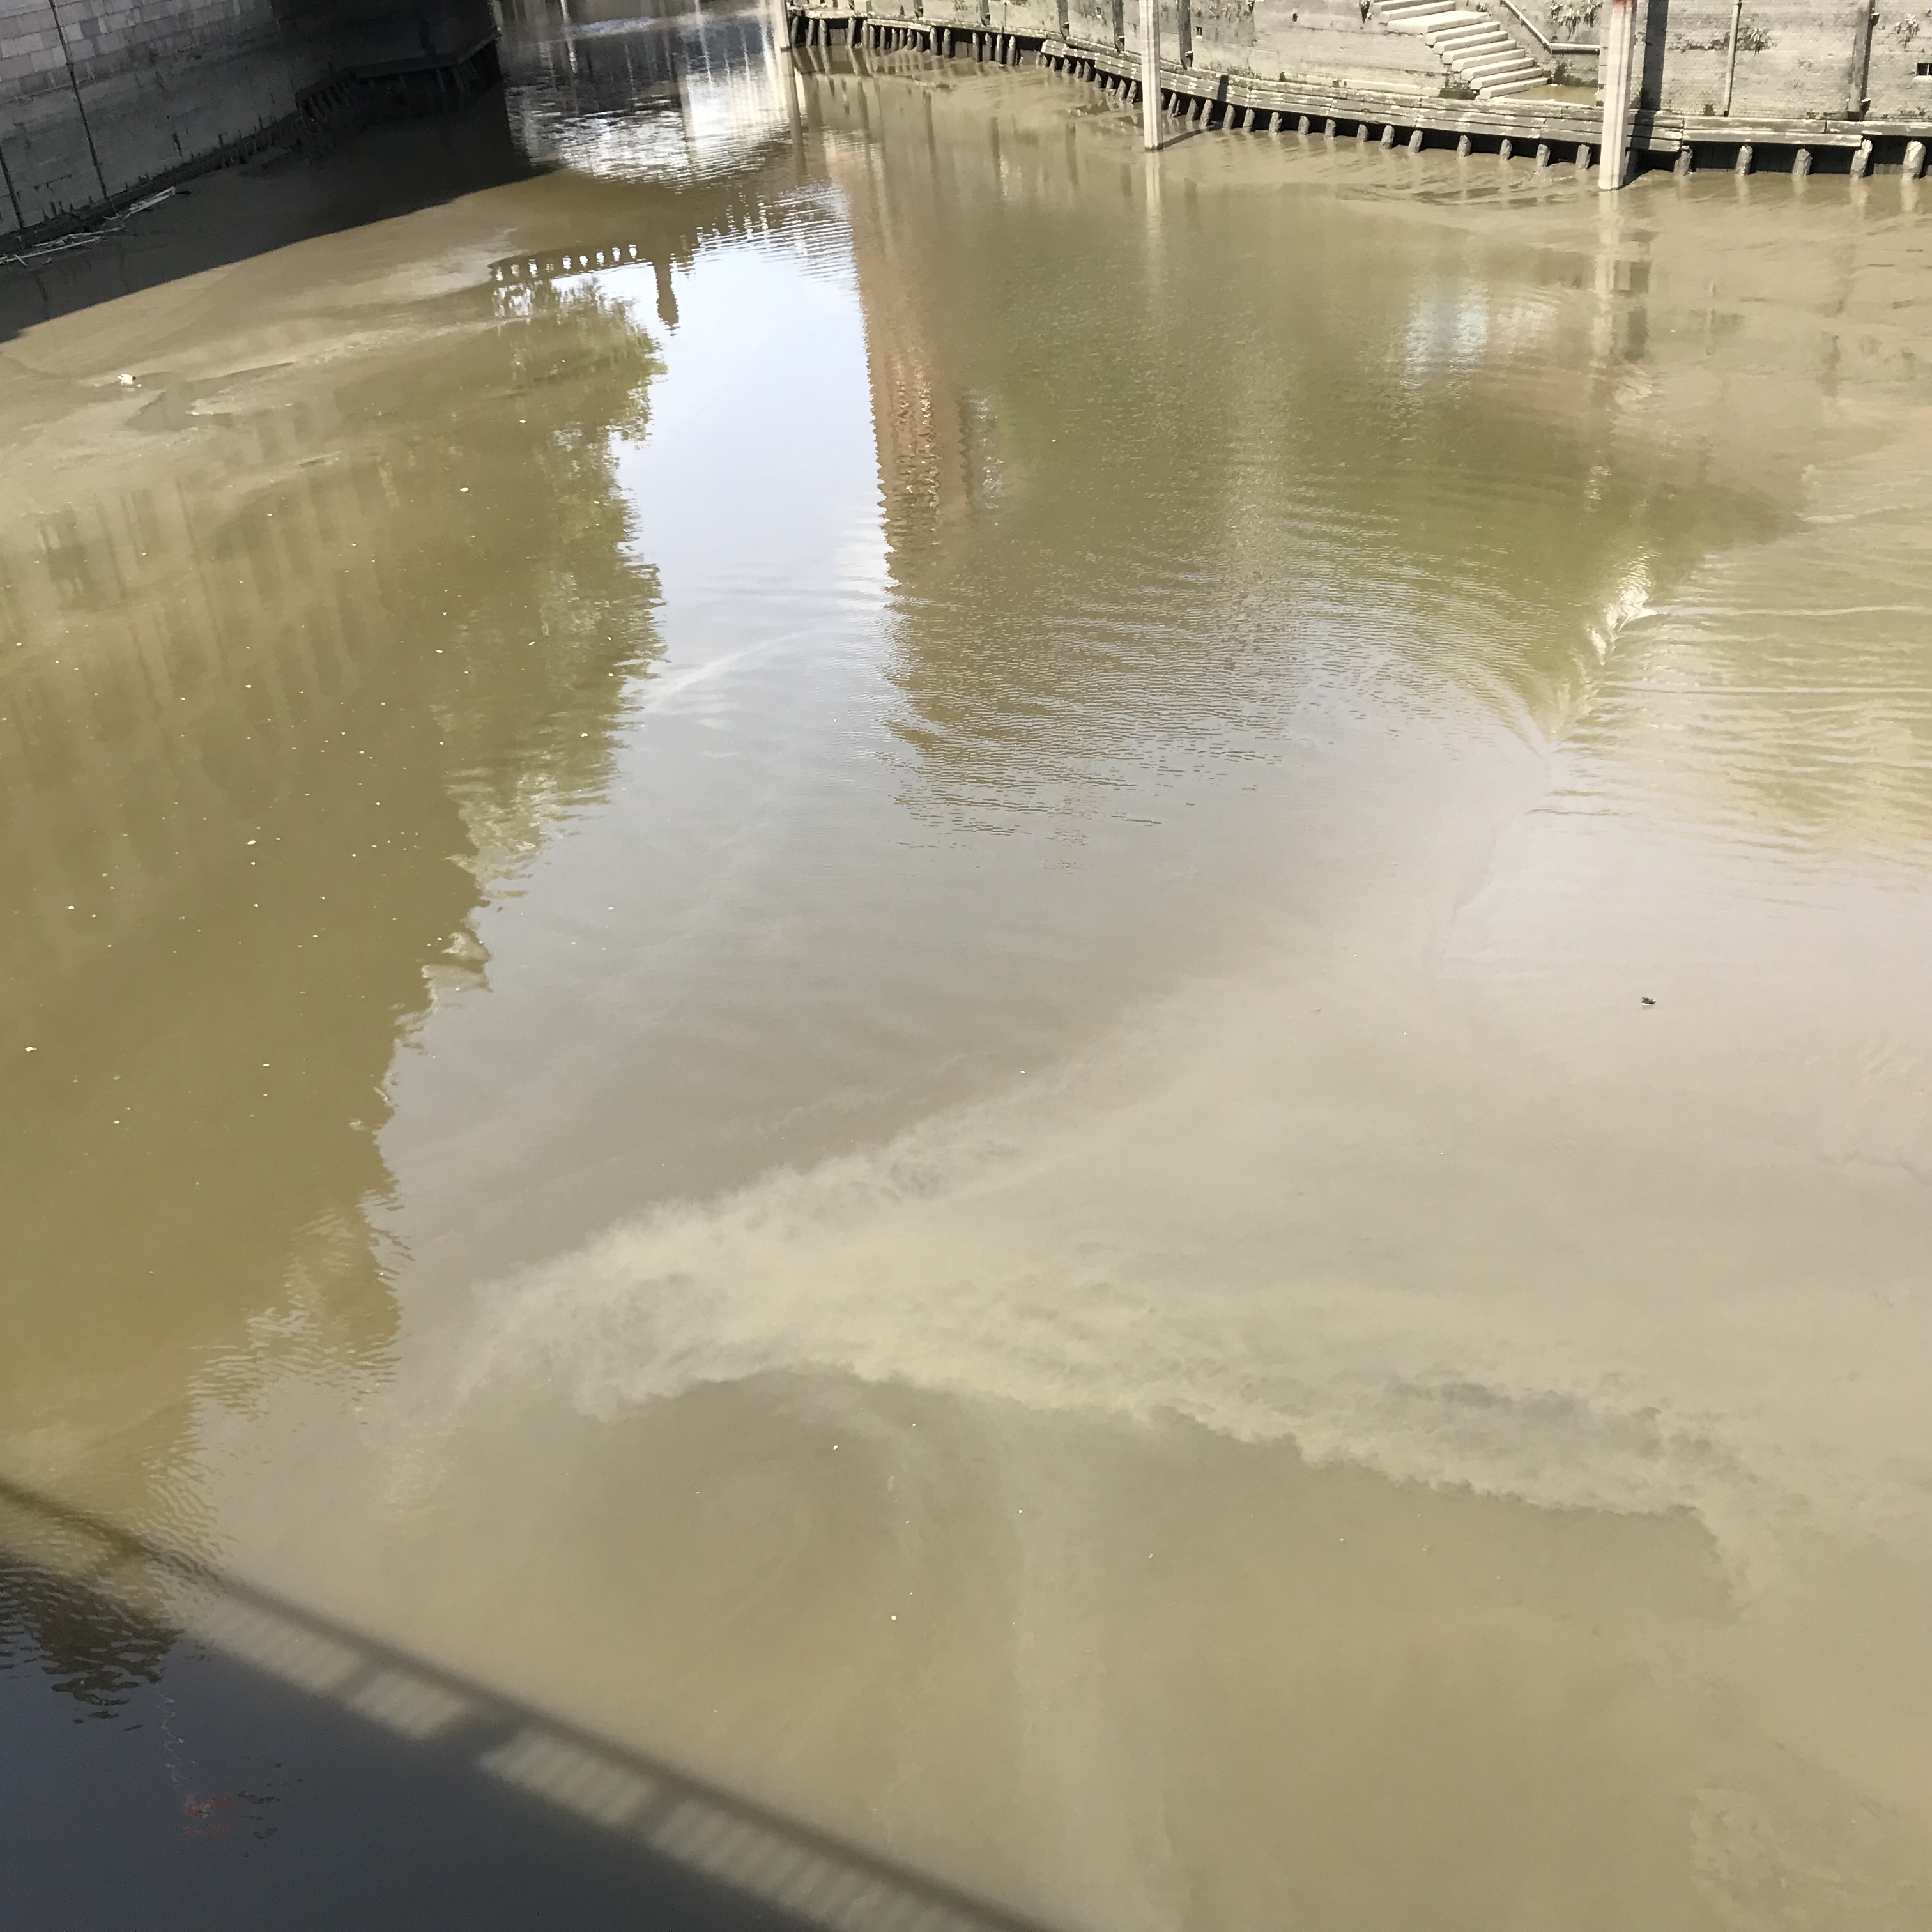
Muddy water watching on my lunch break. Turbulence and all the good stuff!
This might not be the kind of water that people usually like to look at during their lunch break — I admit, it does not look particularly inviting. But look at how much the mud can tell us about what’s going on in the water! I love how the overexposed seagull is stirring up a […]
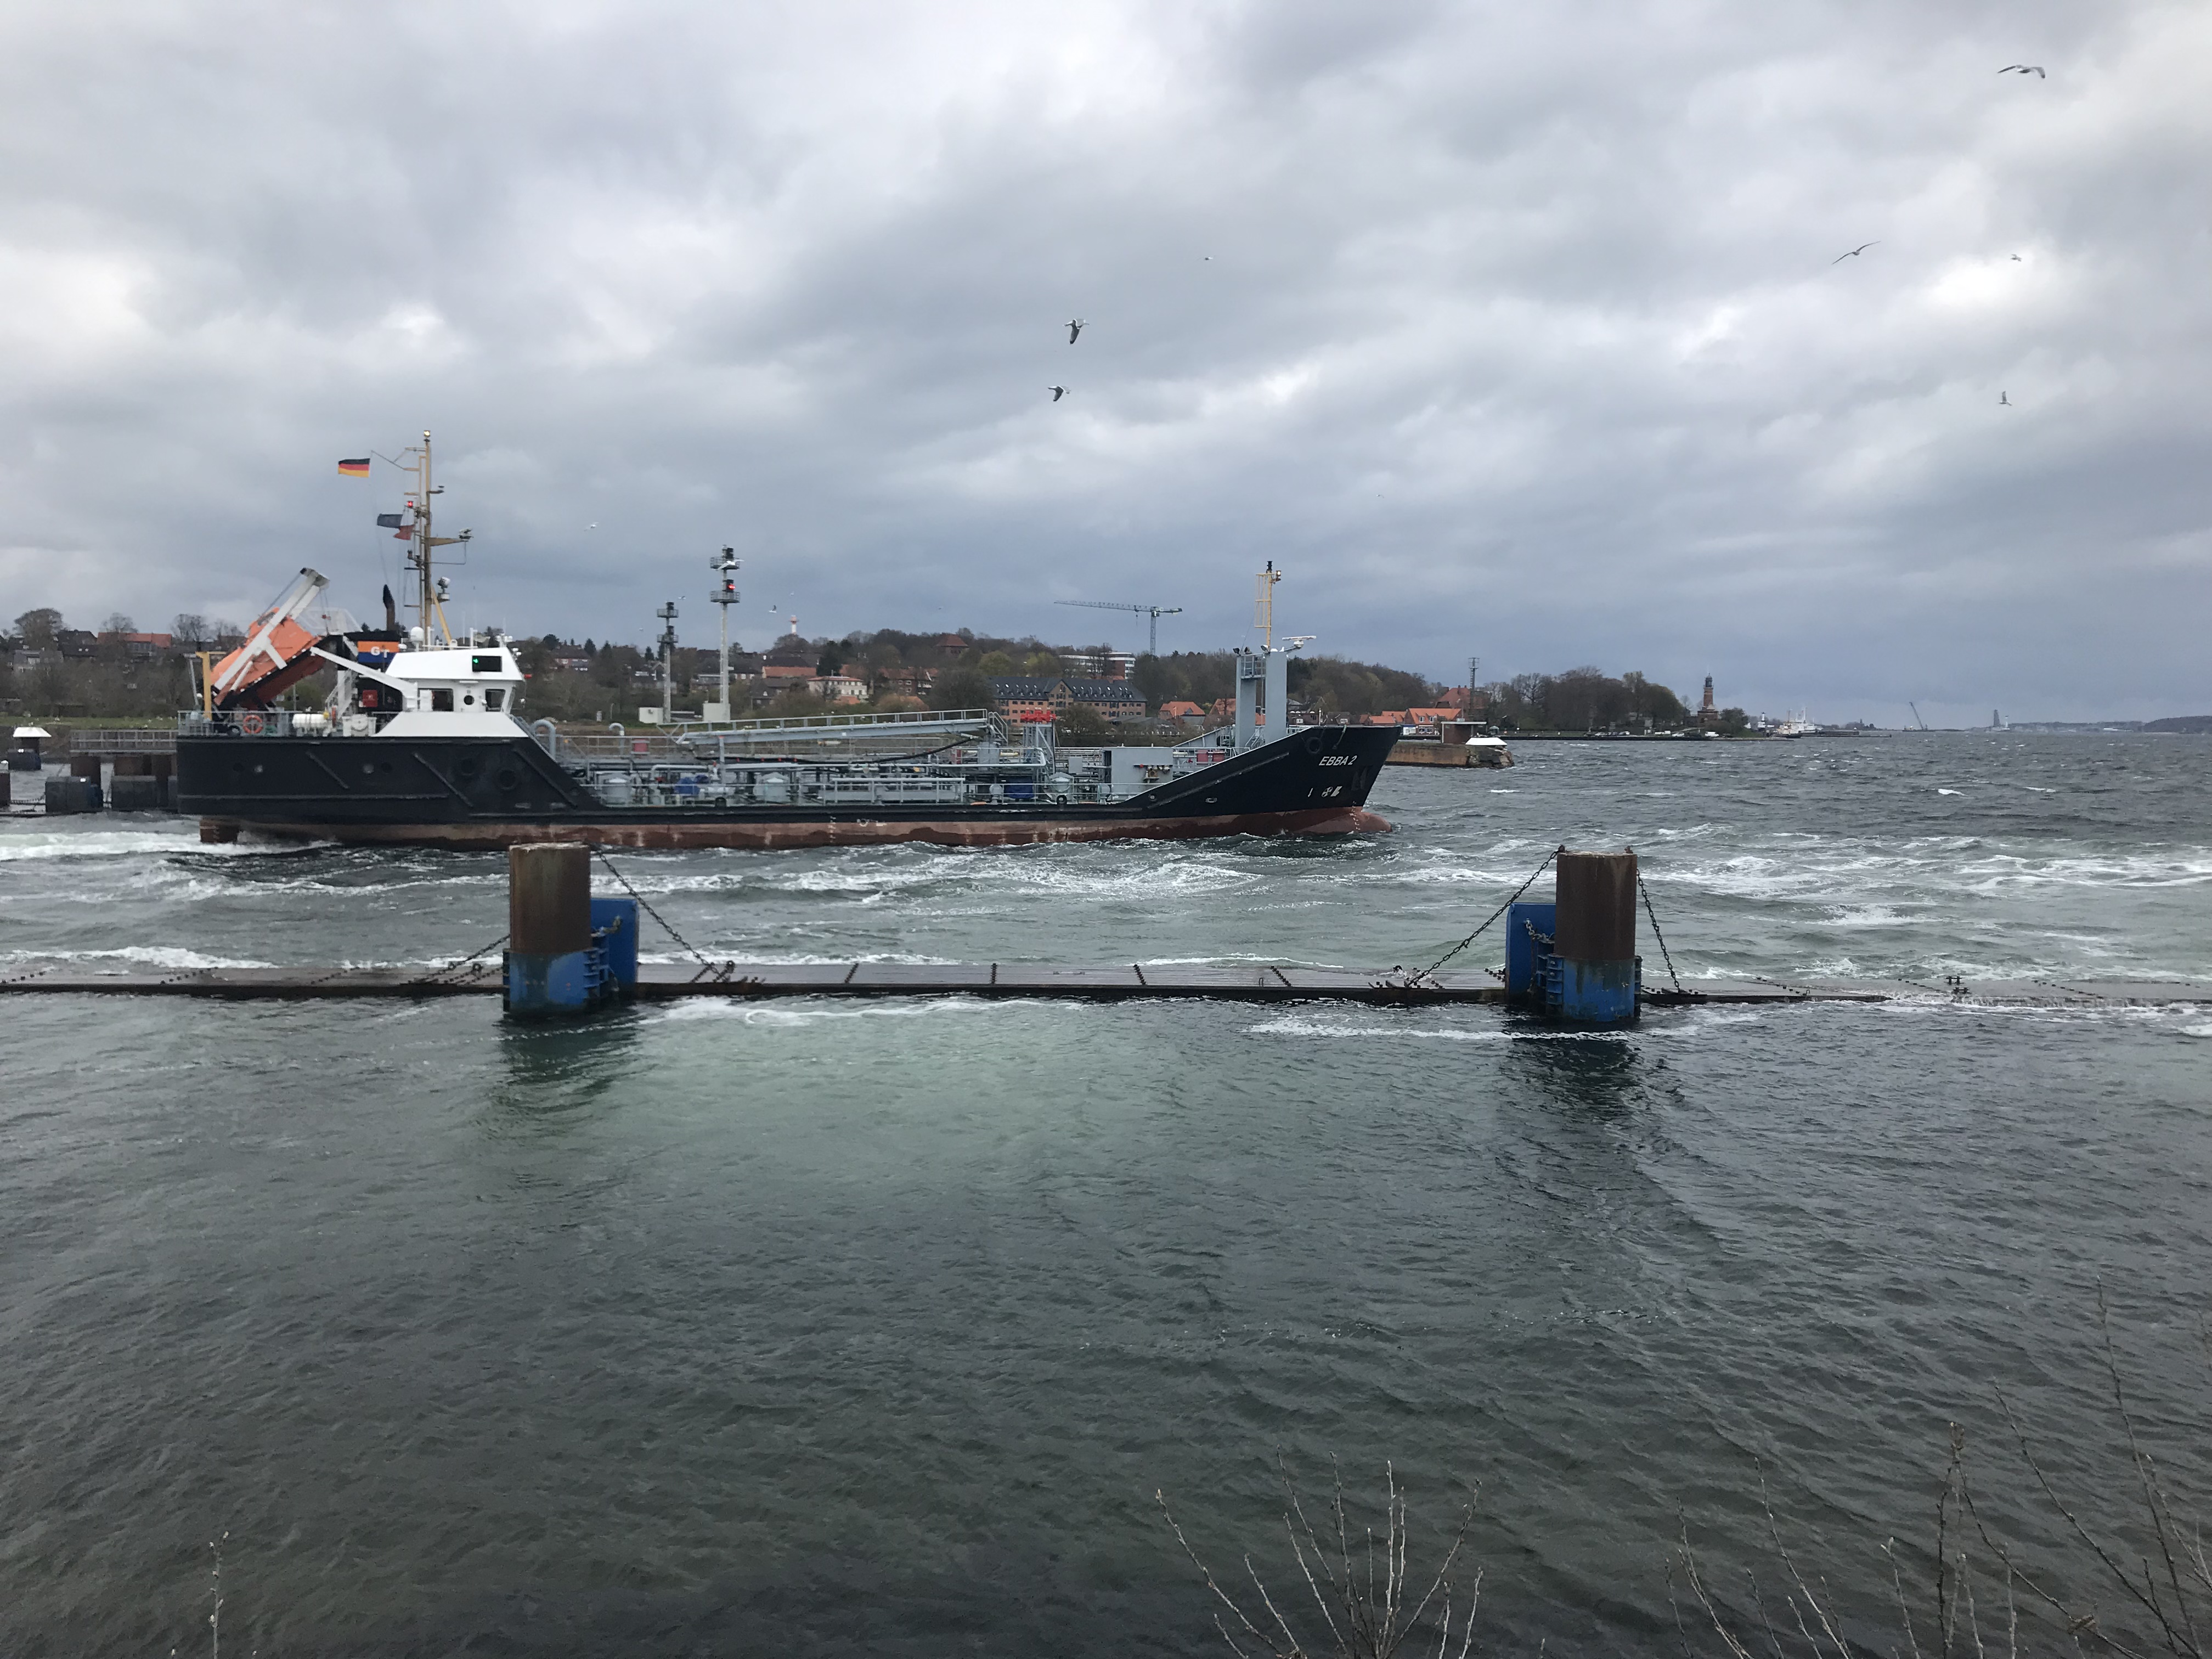
Windy days at Holtenau locks: Now THAT’s a turbulent wake!
Now that the weather is nice and sunny again, here is what it looked like only last Saturday. It wasn’t even really stormy, but windy enough so that the ships leaving the locks at Kiel Holtenau were working a lot harder than usual. Especially difficult when you are almost empty and then there is a […]
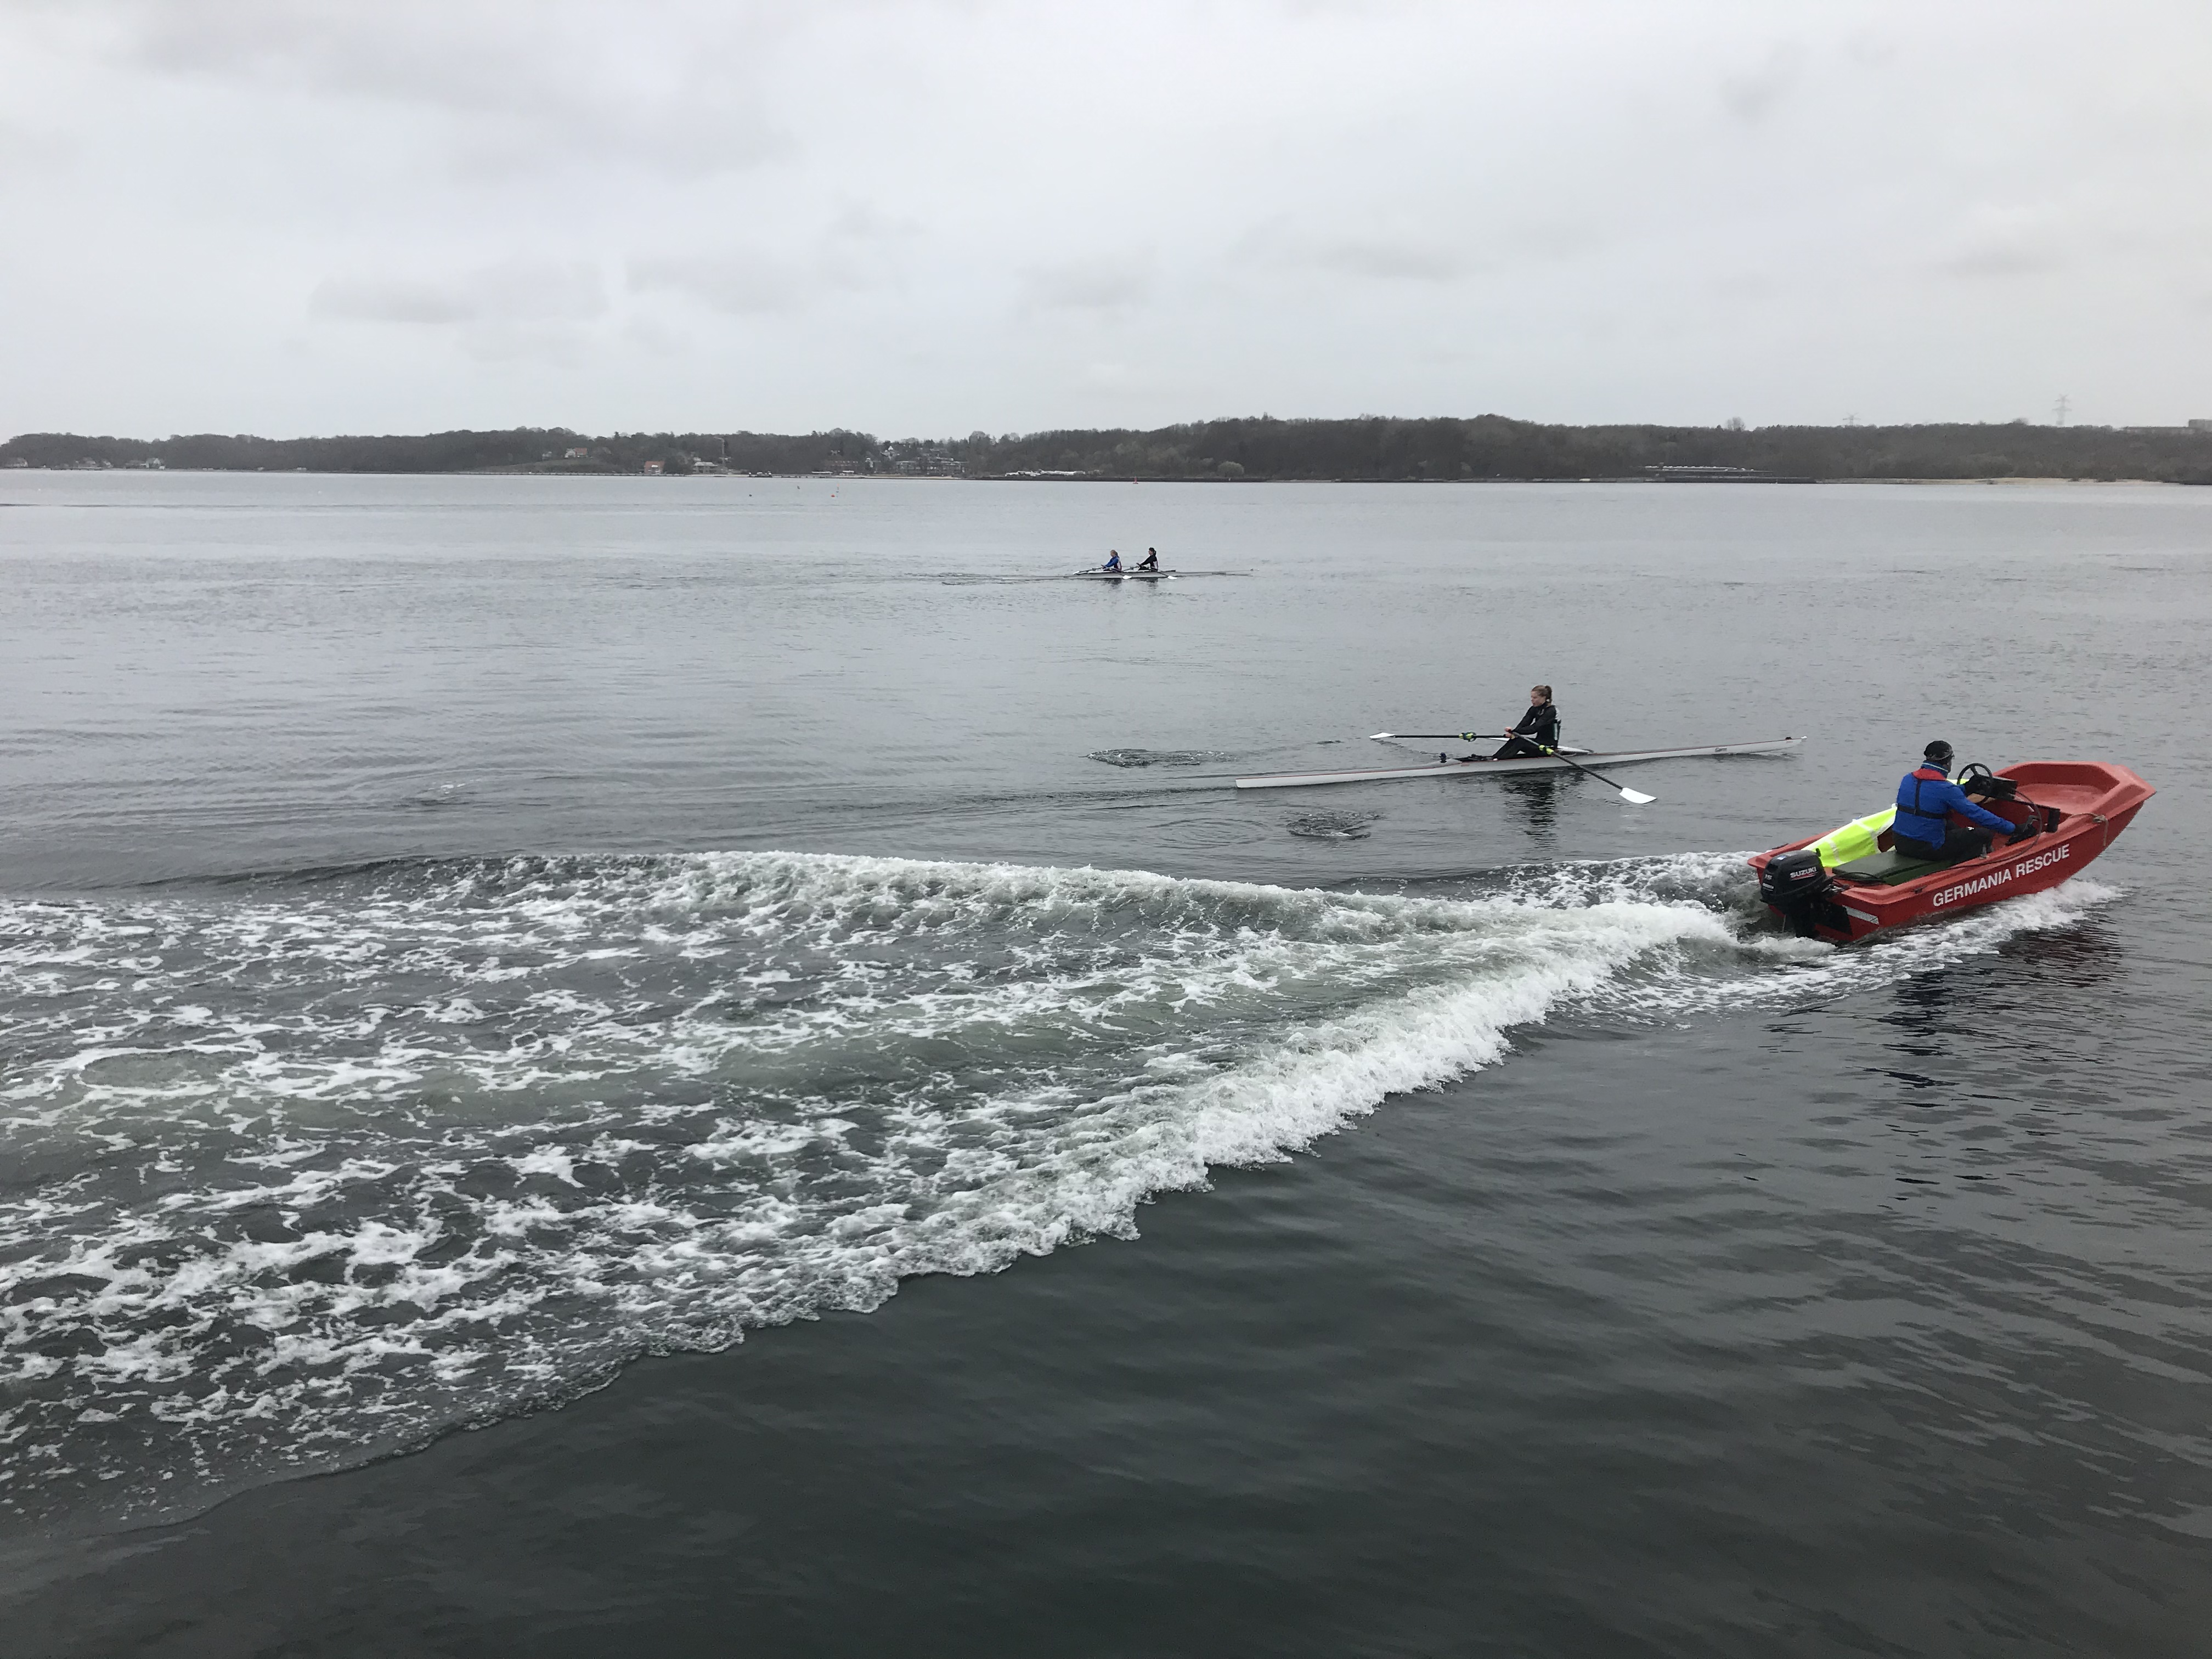
Wake comparisons: Row boat and motor boat
I just love this picture: The two boats in the front are going at the same speed (the trainer is driving right next to the person in the row boat over a long distance), yet look at how different the two ships’ wakes look! The motor boat has this huge, breaking, turbulent wake. Even though […]
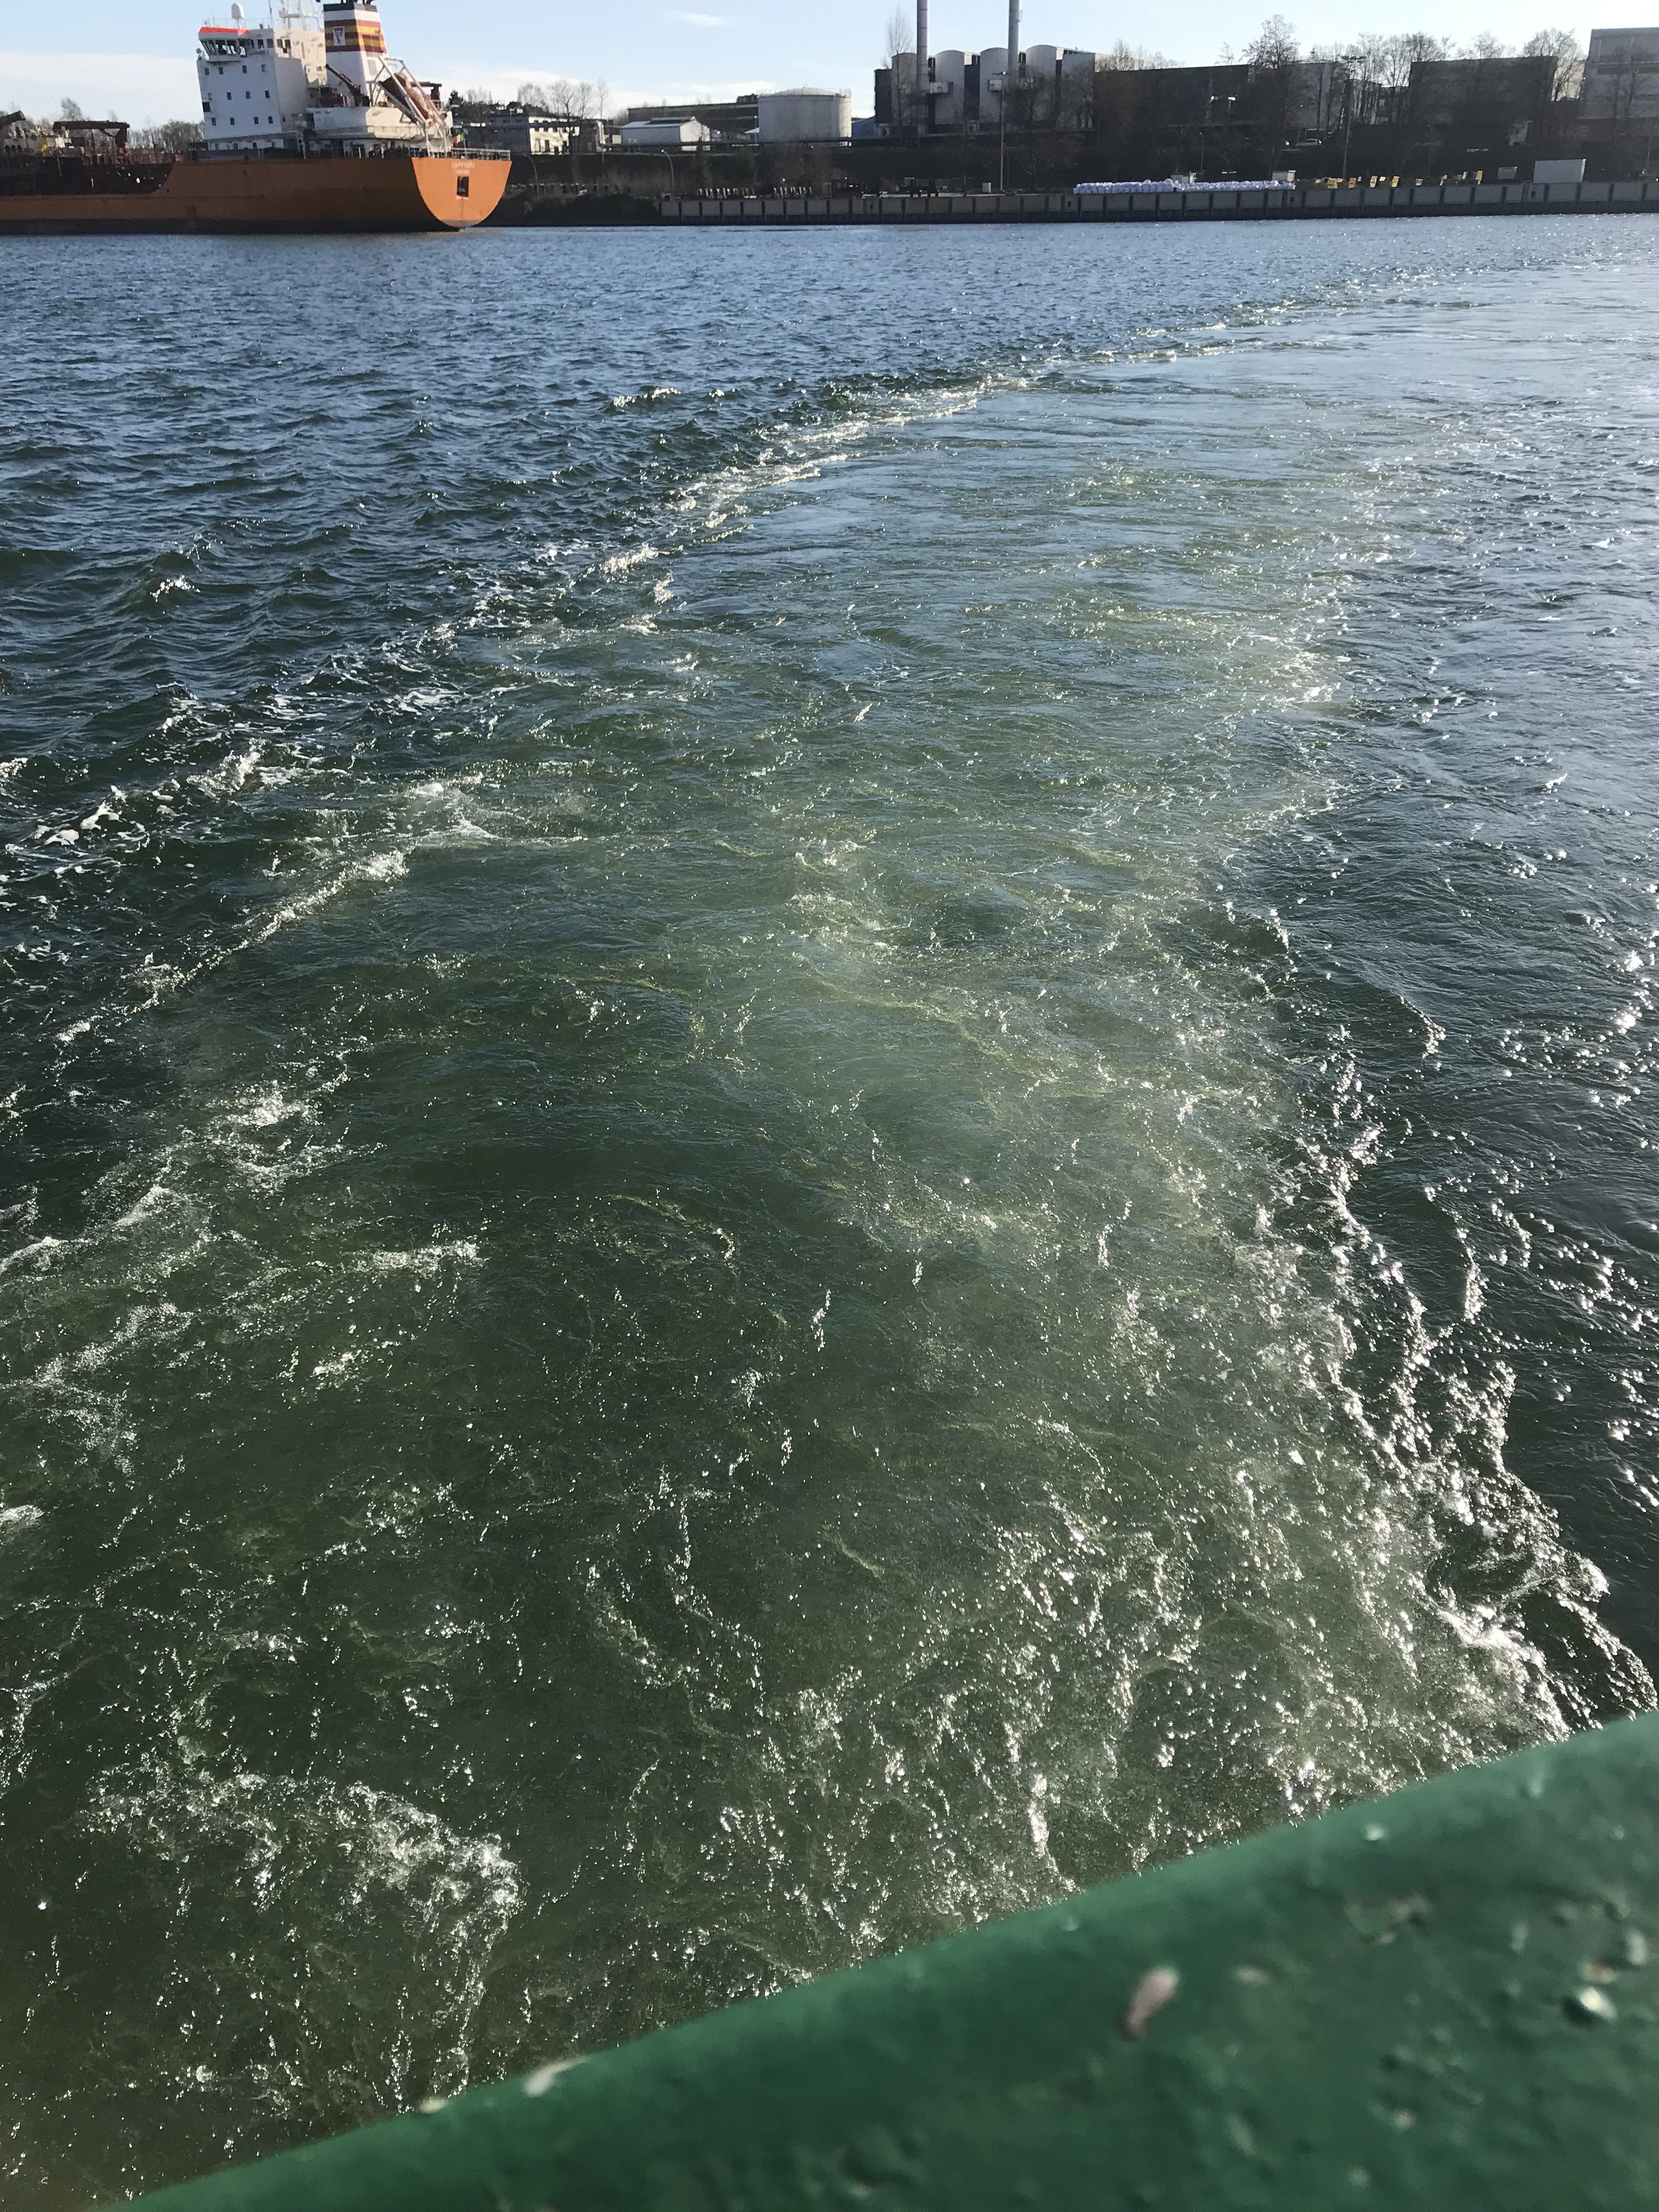
Turbulent wake watching
Yesterday I wrote about why a ship’s turbulent wake stays visible for such a long time after the ship has gone. Here just more pictures of the same phenomenon because apparently I cannot NOT take pictures of this kind of stuff. Above: Very clearly very turbulent. Below: Less energetic, but the large eddies still move […]
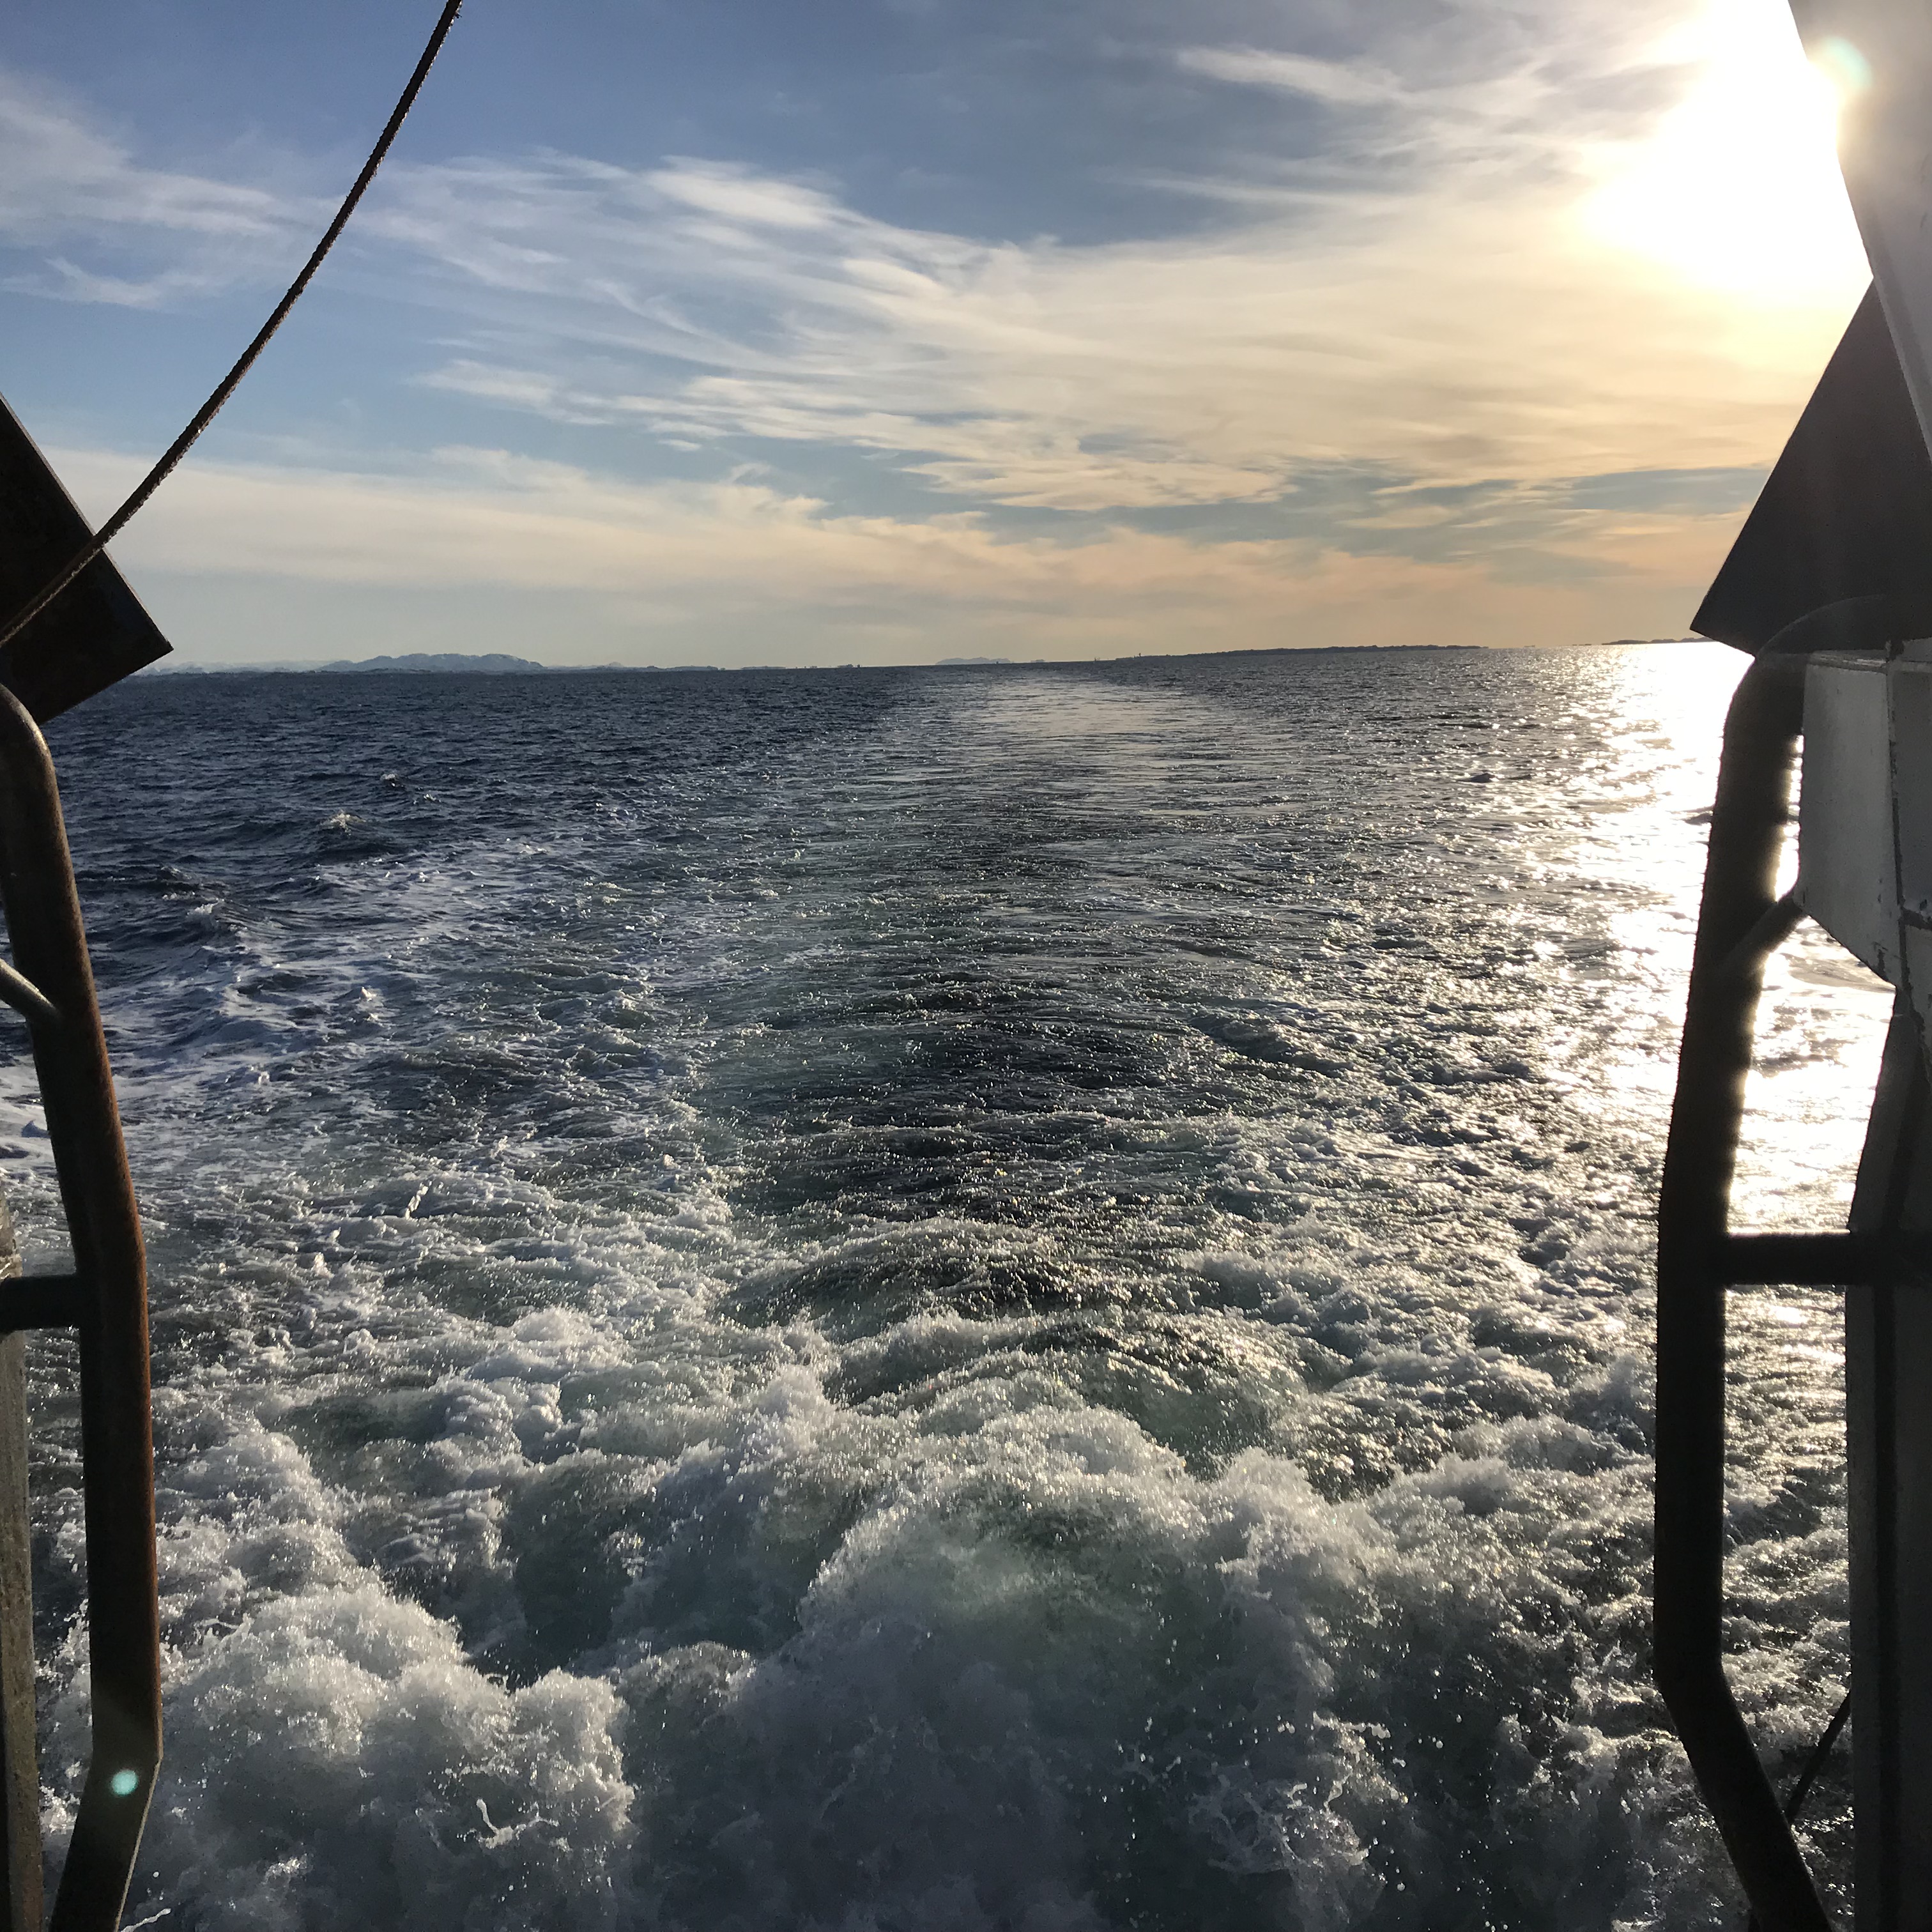
Why does a turbulent wake stay visible for such a long time after the ship has gone?
Speaking of wake watching, the other day I wrote about long distance wave watching in the sunset, i.e. what kind of things one can deduce on surface roughness (and its causes) from different reflections of the setting sun on the water. And then I was asked why ships’ wakes were still visible for such a […]
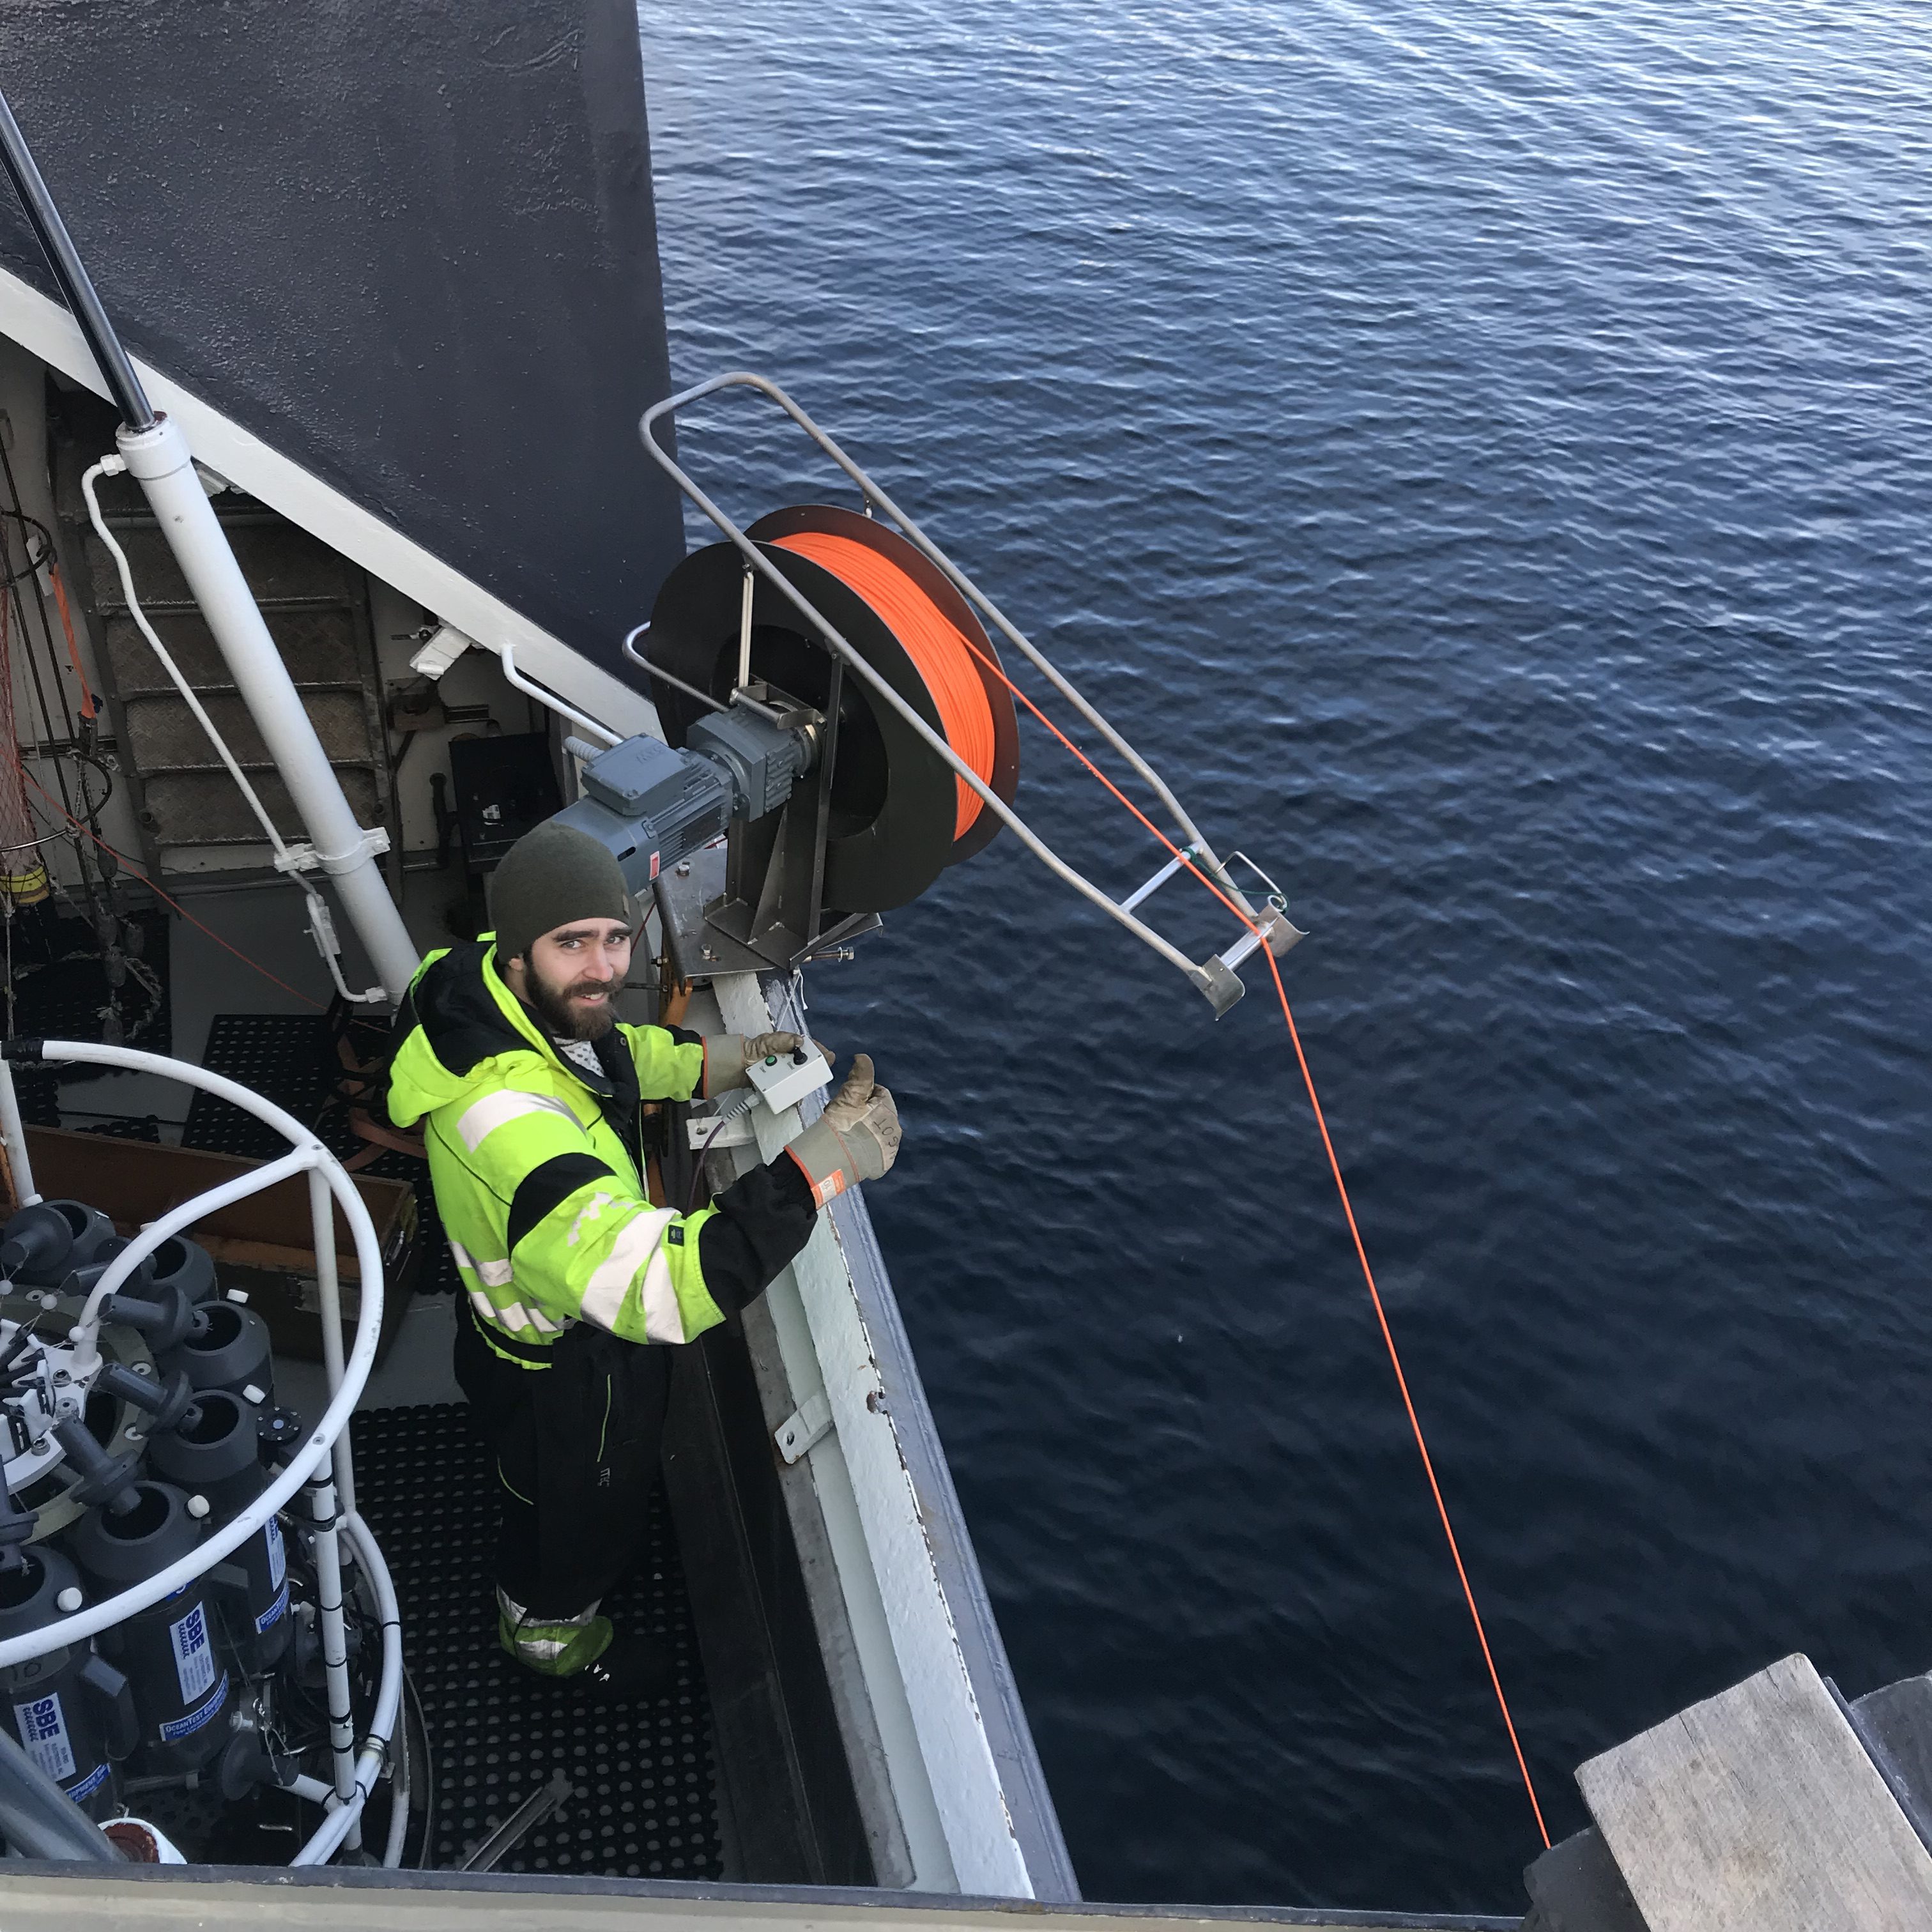
Measuring turbulence with a microstructure sonde
One of the instruments that was used on our recent student cruise was the so-called MSS (“MicroStructure Sonde”, sometimes also called VMP, “Vertical Microstructure Profiler”) — an instrument that is used to measure how much mixing is going on in the ocean. Those measurements can help us figure out e.g. renewal rates of bottom water […]

Visualizing flow around a paddle
Whenever I’m in a canoe or kayak, I love watching the two eddies that form behind the paddle when you pull it through the water. It looks kinda like this: Instead of pulling a paddle through more or less stagnant water, we could also use a stationary paddle in a flow. And that is the setup […]

Shear flow
Another early morning crossing this bridge. And the current and the sun glint were perfect for this kind of photos:They almost look like schlieren photography images in those super old papers, don’t they? And I find it extremely fascinating how you can see the boundary layer between the flow and the stagnant water, and how wind […]
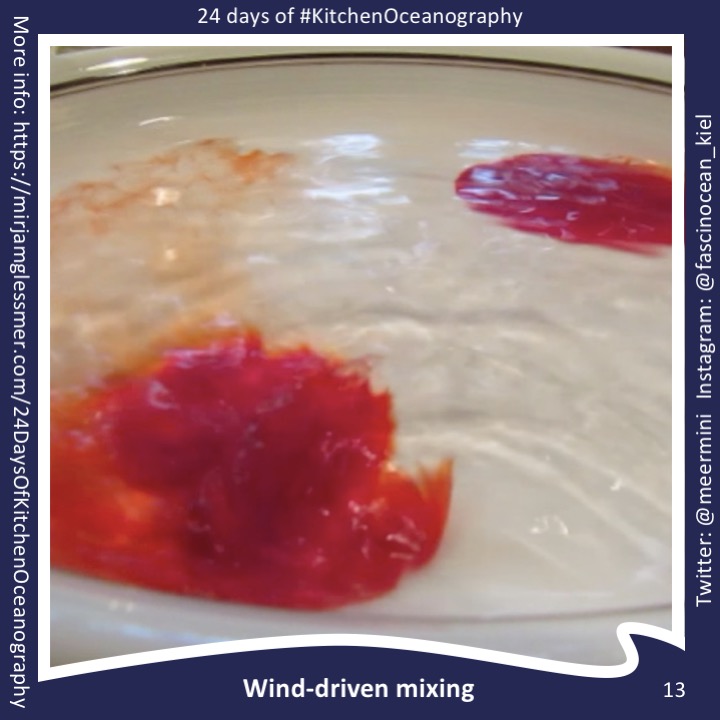
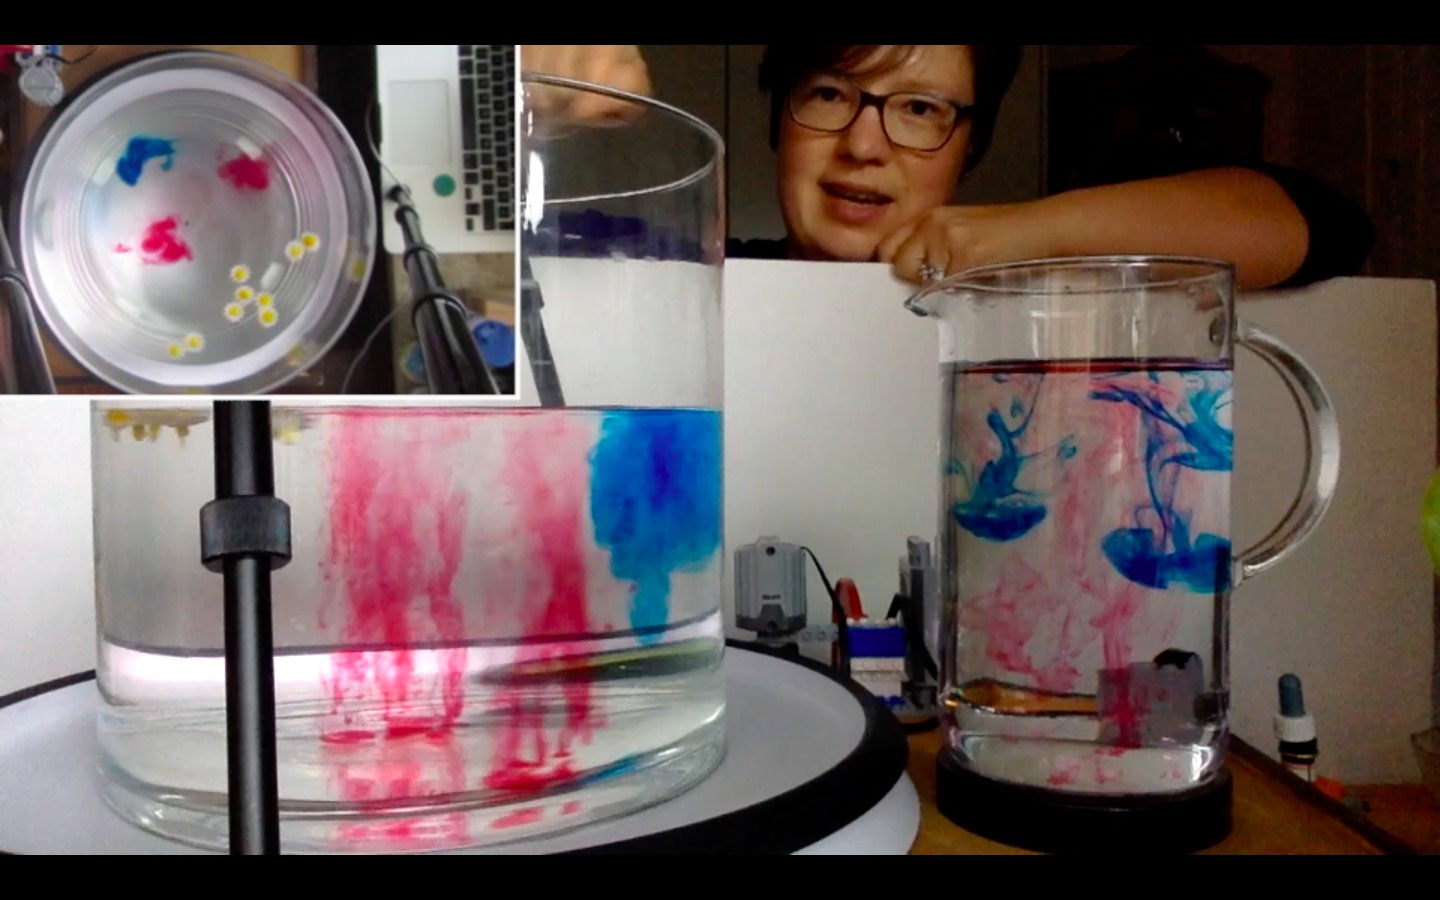
Vortex streets on a plate
You might think that three hours of canoe polo on a Saturday morning would be enough water for the day, but no. As when I did the experiment for the “eddies in a jar” post a while back, sometimes I just need to do some cool oceanography. So last Saturday, this is what I did: I took a […]