Category Archives: hands-on activity (easy)

Workshop prep and a riddle

Looking at the picture below, can you guess which experiment I am going to do at the MeerKlima.de workshop? Yep, my favourite experiment — melting ice cubes! :-)

And I am obviously prepared for several extensions of the classic experiment should the students be so inclined…

Now I only need to get the ice cubes from Kiel to Hamburg — and as ice cubes, not a colourful, salty, wet mess :-)

Having gotten that backstory as a hint, any idea what’s going on with the spoons below?

Yep. Freshwater on the left, salt water on the right. Different refraction indices due to different densities. Neat :-)

Air-sea gas exchange inhibited by oil layer on water? Yes, but not always

I have been brainstorming hands-on experiment ideas for a project dealing with the influence of oil films on air-sea gas exchanges, and one idea that I really liked was this one: Use sparkling water, pour oil on top, observe how outgassing stops.

Now. I should probably have realised that this was a stupid idea before trying it, but in my defence: I have a really really busy week at work and I just wanted a quick and dirty experiment.

As you probably know, sparkling water bottles are under a lot of pressure. Especially when you have been carrying them home right before opening them. As you will see from all the drops on my backsplash shown in the movie below, mine exploded all over my kitchen when I opened it…

But even that wasn’t enough of a clue for me to realise that the process that drives CO2 out of sparkling water probably isn’t just a gradient in concentrations between the water and the atmosphere, but that the CO2 can only be kept in solution under high pressures. So yeah, my oil film doesn’t inhibit gas exchange at all, my sparkling water with oil on top is outgassing just as happily as the one without. I suspect the oil film will only have an impact once outgassing doesn’t happen via bubbles any more, and hence isn’t visible any more. Fail!

But the movie is pretty, anyway.

I guess we would actually have to measure gasses in the atmosphere and water in order to run such an experiment… Which makes it a lot less appealing. I would really have liked to be able to stop sparkling water from sparkling just by pouring oil on top. Bummer! :-)

Using real time data of ship positions in teaching?

This morning I was looking for the current position of a research vessel on MarineTraffic.com and noticed something that should maybe not have been surprising, but that I had never really thought about: How all the fishing vessels (orange) are sitting right on the shelf break! I guess that’s where they should be when we think about currents and nutrients and primary production and fish, but how cool is it to actually see it?

screen-shot-2017-03-29-at-08-49-17

And see that area west of Lofoten where there are a lot of fishing boats in a circle? An unnamed inside source told me that that’s where cod is spawning right now, so everybody is going there to fish. Tomorrow, the cluster might be in a completely different place. And even now, some 10 hours later, it seems to have migrated a little northward? Will definitely check again tomorrow!

screen-shot-2017-03-29-at-17-50-40

I obviously had to look whether fishing on the shelf break was just a thing in Northern Norway and turns out that it’s the same on the Greenland Shelf.

screen-shot-2017-03-29-at-10-51-39

Now that I got into playing, I found it also really interesting to see that there is a lot of fishing in the equatorial Pacific going on. And how clearly you can see major traffic routes even in just the distribution of ships.

screen-shot-2017-03-29-at-10-50-11

And then, ShipTracker even offers a density map of ship traffic:

screen-shot-2017-03-29-at-10-55-41

Which I had to screen-shoot in two parts because of reasons:

screen-shot-2017-03-29-at-10-56-00

This site would be such a great tool for all kinds of teaching purposes. Realtime data on shipping is just a click away, even with the free version! There are so many things that students could do estimates on using this site, on transport, fishing, pollution, just pick your topic! And using authentic data makes the whole thing a lot more interesting than looking at maps or numbers a teacher would provide. Pity I’m not teaching right now!

Fictitious forces (2/5): Experiencing frames of reference on a playground

How can you be moving in one frame of reference, yet not moving in another?

We talked about the difficulty of different frames of reference recently, so today I want to show you a quick movie on how the seemingly paradox situation of moving in one frame of reference, yet not moving in another, can be experienced on a playground.

MVI_9331

My dad on a playground rotator. Moving relative to the rotating disk, yet staying in the same spot relative to the playground.

This is maybe not what you would do with a bunch of university students, but on the other hand – why not?

Fictitious forces (1/5): Record players and Coriolis deflection

An experiment showing how seemingly straight trajectories can be transformed into curly ones.

One of the phenomena that are really not intuitive to understand are fictitious forces. Especially relevant in oceanography: The Coriolis force. The most difficult step in understanding the Coriolis force is accepting that whether or not a trajectory appears straight or curved can depend on the frame of reference it is observed from.

Or to say it with John Knauss in his Introduction to Physical Oceanography: “Even for those with considerable sophistication in physical concepts, one’s first introduction to the consequences of the Coriolis force often produces something analogous to intellectual trauma”.

One way to show that the apparent change of shape is really due to different frames of reference, is to take a trajectory that is objectively AND subjectively straight and watch it being transformed into something curly.

IMG_8454

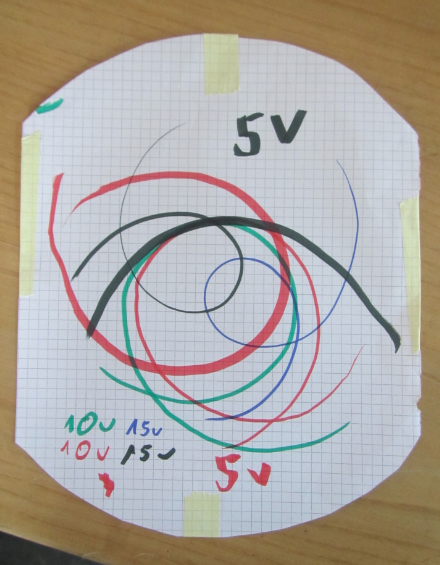
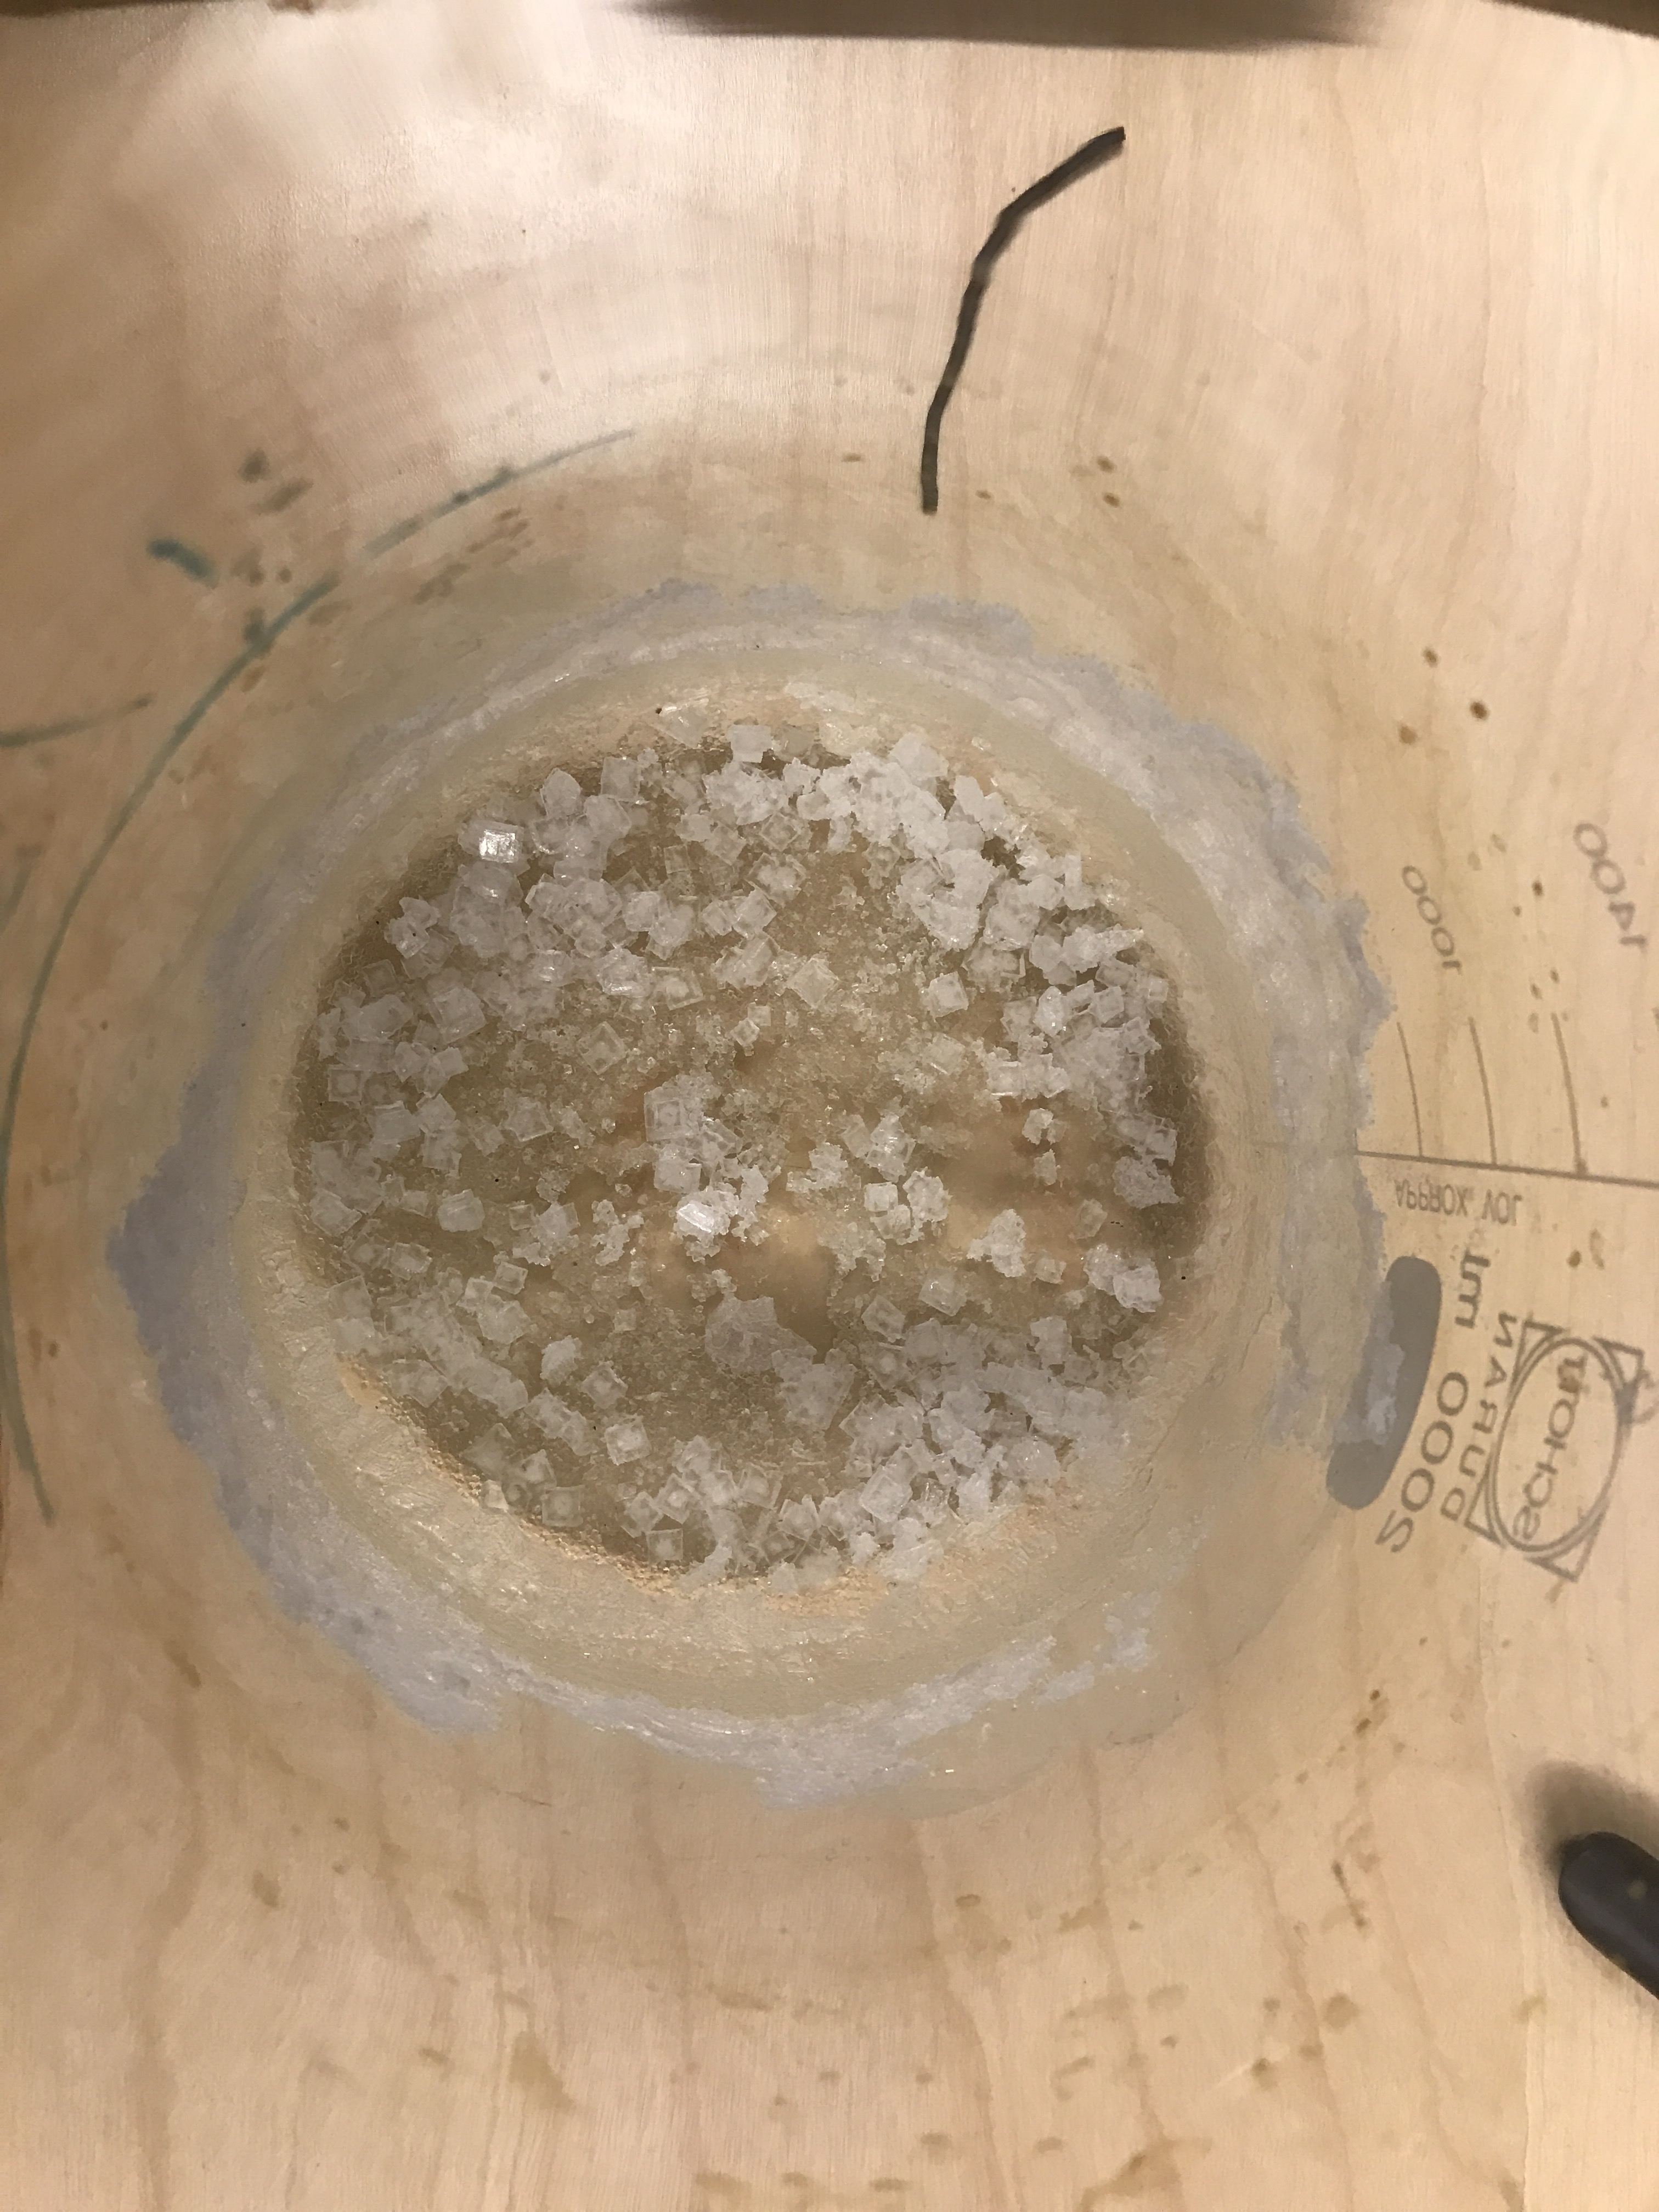
Trajectories for different voltages driving the record player.

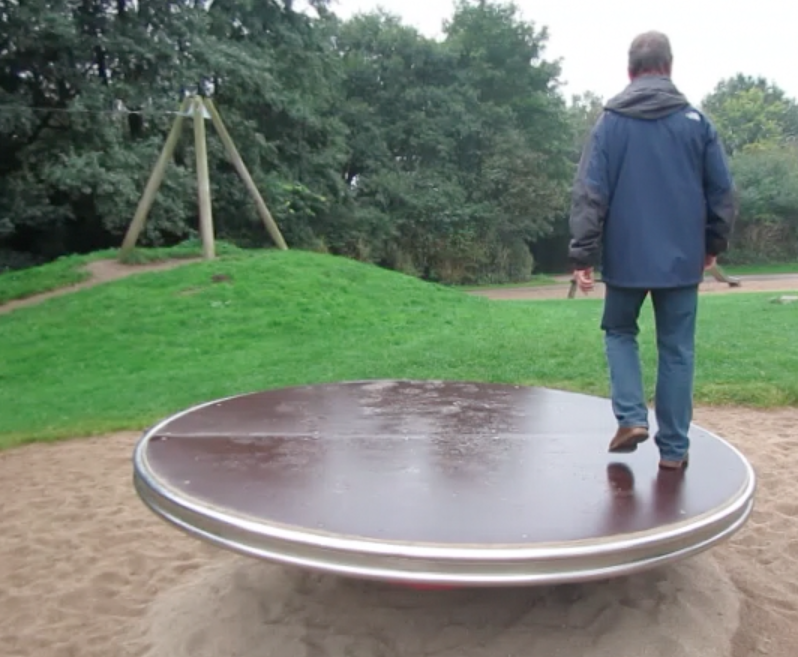
We did this at JuniorAkademie by taping a piece of paper on a record player, putting it into motion and then, at as constant a speed as possible, drawing along a ruler’s edge straight across. (if you don’t have a record player or rotating table at your disposal, you could also use a Lazy Susan and turn it as uniformly as possible).

Of course, this approach has a lot of potential pitfalls. For example, if you change the speed while you draw, you get kinks in your curls (as the child drawing in the video below points out when it happens). Also, by drawing on a flat paper rather than a spherical Earth, this isn’t completely equivalent to the Coriolis force.

And, more importantly, I think this experiment is only helpful for an audience that doesn’t “know” about fictitious forces yet. A problem we have experienced with oceanography students is that they “know” that moving objects should be deflected, and that they “see” a deflection even when there is none (for example when they are watching, from a non-rotating frame of reference, an object move across a rotating table). In that case, sliding the pen along the ruler might be perceived as forcing an otherwise curly trajectory to become a straight line, hence cheating by preventing a deflection that should occur.

Evaporating sea water

How much salt is there in sea water? What concentration do you need before crystals start forming? What will those crystals look like? I am sure those are the kind of questions that keep you awake at night!

Of course this can easily assessed experimentally. On a visit to the University of Bergen’s Centre for Science Education just now, I was shown the result of such an experiment: A litre of water was mixed with 35 grams of salt to simulate sea water with its typical salinity. Below, you see what the beaker looked like after sitting out for three months.

You can see that salt crystals are forming at the walls of the beaker, but that their structure depends on depth below the initial water level (see the 1000 ml mark on the beaker).

When there is still a lot of water in the beaker, crystals look like ornate flowers. Then, the less water is left in the beaker, the more square the crystals become. And at the bottom of the beaker, you see the typical salt crystals you would expect.


Actually, even though they look like the kind of salt crystals I would expect, apparently someone who knows about crystallography commented that there must be other stuff in there than just cooking salt since the crystals don’t look the way they should. I need to read up on this! :-)

Anyway, this is an experiment that I want to do myself, so maybe in three months time there will be more pictures of this!

Thanks for a very nice lunch, Olaug, Frede, Andreas, Morven and Elin! Looking forward to working with you a lot more in the future! :-)

P.S.: with this blog post I am testing to blog pretty much “real time” from my mobile phone, so if you notice anything odd, please let me know!

Frost flowers on ice cream: When you start thinking about phenomena and something really annoying, all of a sudden, becomes really cool.

Frost flowers on ice cream. You must have seen them before: They sometimes occur when you’ve had some ice cream, put the left-overs back in the freezer, and take them out again. And there you have it: Water-ice crystals all over your lovely ice cream! Completely annoying because, obviously, they only taste like water and mess up your whole ice cream experience (or is that only me)?

You know I’m kinda fascinated with ice crystals on frozen blended strawberries, but last time I had some, there weren’t only crystalline structures, but there was frost on it:

Erdbeereis_1

Frost occurs when water vapour freezes without going through the liquid phase. Look at the awesome crystals!

Erdbeereis_2

Once I started thinking about the process that formed the ice and realised that those were actually frost and not just ordinary ice crystals, they all of a sudden stopped being annoying and instead became something that I kinda look forward to finding when I open a tub of my frozen blended strawberries. Because the structures are different every time, and really really pretty! And also how awesome is it to know that those ice crystals formed from water that wasn’t even liquid? Yes, this is the kind of stuff that makes me happy! :-)

Taking the hydrostatic paradox to the next (water) level

How well do people understand hydrostatics? I am preparing a workshop for tomorrow night and I am getting very bored by the questions that I have been using to introduce clickers for quite a lot of workshops now. So I decided to use the hydrostatic paradox this time around.

The first question is the standard one: If you have a U-tube and water level is given on one side, then what is the water level like on the other side? We all know the typical student answer (that typically 25% of the students are convinced of!): On the wider side the water level has to be lower since a larger volume of water is heavier than the smaller volume on the other side.

Clearly, this is not the case:

IMG_3362

However, what happens if you use that fat separator jug the way it was intended to be used and fill it with two layers of different density (which is really what it is intended for: to separate fat from gravy! Your classical 2-layer system)?

Turns out that now the two water levels in the main body of the jug and in the spout are not the same any more: Since we filled the dense water in through the spout, the spout is filled with dense water, as is the bottom part of the jug. Only the upper part of the jug now contains fresh water.

IMG_3364

The difference in height is only maybe a millimetre, but it is there, and it is clearly visible:

IMG_3364

Water level 1 (red line) is the “main” water level, water level 2 (green line) is the water level in the spout and clearly different from 1, and water level 3 is the density interface.

We’ll see how well they’ll do tomorrow when I only give them levels 1 and 3, and ask them to put level 2 in. Obviously we are taking the hydrostatic paradox to the next (water) level here! :-)