Category Archives: demonstration (difficult)

Water in solid body rotation.

Spinning up a tank until all water particles move with the same angular velocity.

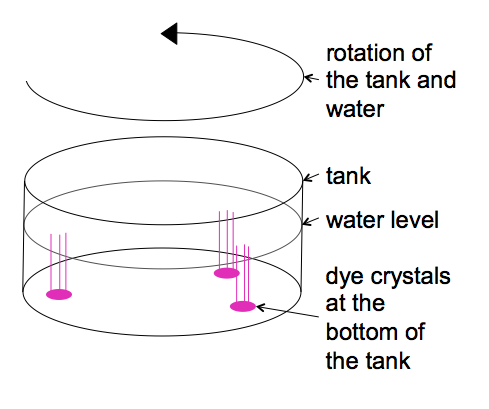
Before running the Ekman spiral experiment, the tank needs to be spun up to solid body rotation. Even though the concept itself is not difficult, it seems to be difficult to determine when a body of water has reached the point where it rotates as a solid body. So here is my attempt to sort my thoughts well enough to explain it better next time I teach this experiment.

Firstly: Solid body rotation of water in a tank basically means that every water molecule is at rest relative to the tank (neglecting thermal movement). This means that over any given period of time, particles that started out on a straight line going radially outwards from the centre will still be on straight line going radially outwards from the centre, with the same radii as initially.

But since we are usually not rotating with the tank, this is pretty hard to observe from a non-rotating frame. Enter the mounted camera rotating with the tank (and, I think, the confusion).

When we start up the rotation of the tank, the water is initially at rest in the frame of the lab. This means that for a counter-clockwise rotating table, particles on the water surface appear to be moving clockwise when observed on the screen.

As time goes by, the water inside the tank starts spinning with the tank, and with it the particles on its surface. On the screen, this appears as though the particles are slowing down.

When the particles don’t move any more relative to the coordinate system underneath the tank, the water is moving with the same speed as the tank and solid body rotation has been reached.

Part 2 will shortly be uploaded, looking into how momentum is being transferred from the tank to the water.

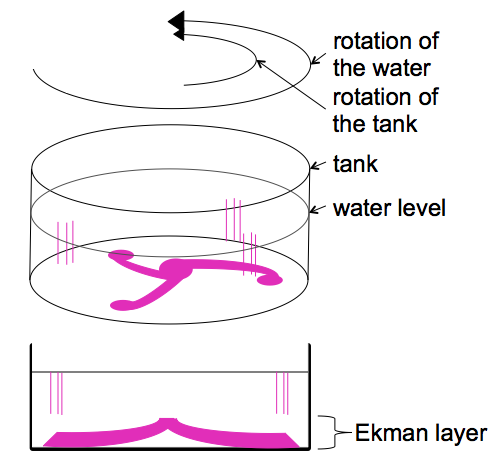
Ekman spiral in a tank.

Tank experiment showing (the effects of) the Ekman spiral.

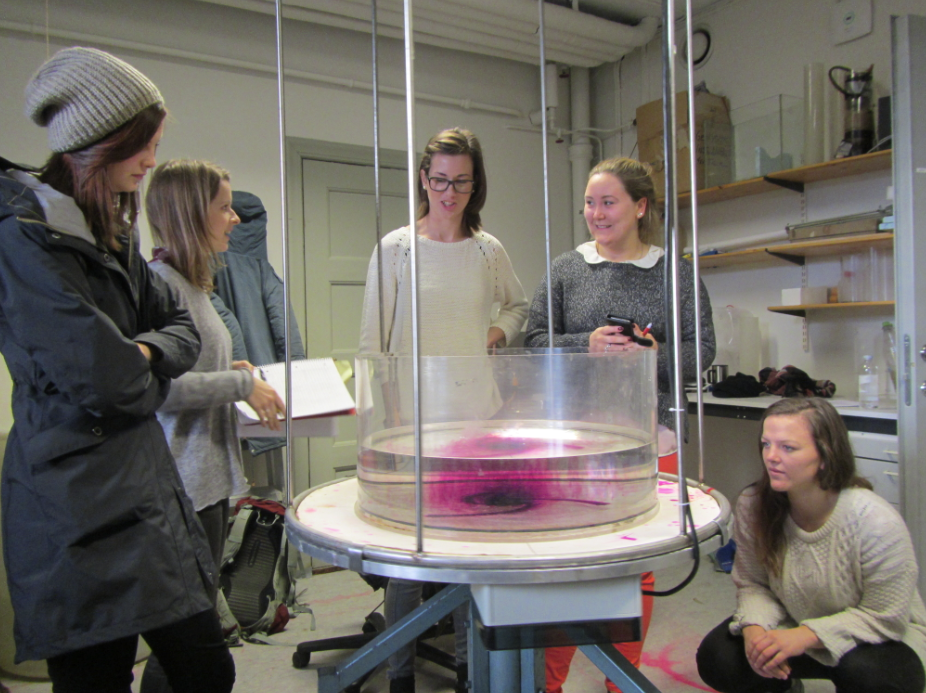
One experiments that has been run in GEOF130 forever is the “Ekman spiral” experiment. A tank filled with water is spun up to solid body rotation on a rotating table.

Then the tank is slowed down. The resulting friction between the water body and the tank creates a bottom Ekman spiral.

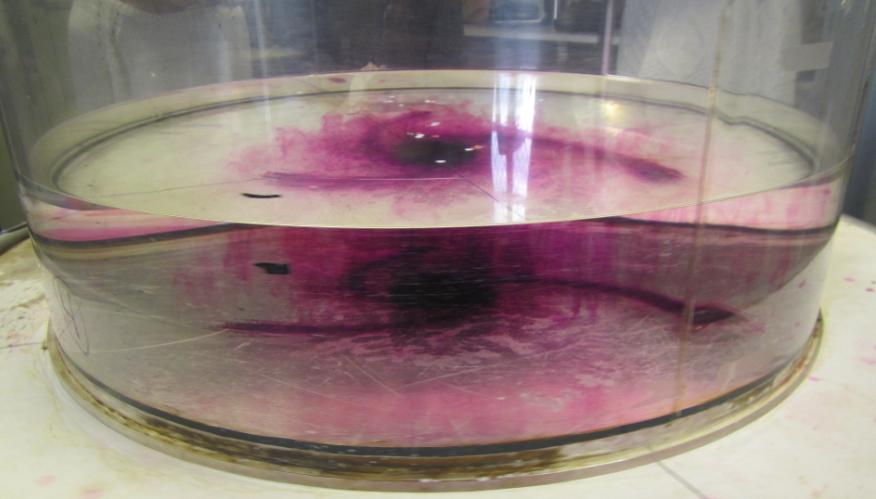
In the lab, you can observe the Ekman depth by looking into the tank from the side:

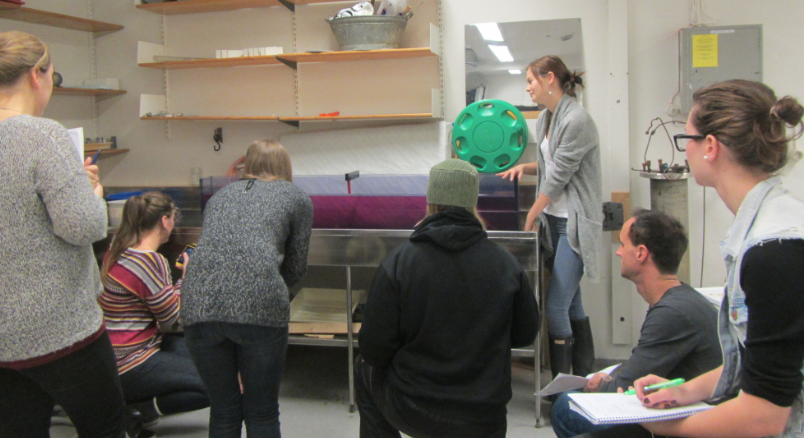
I’m showing you here what they see, except that you have a big advantage: The camera was mounted on the rotating table, so instead of watching the tank rotate in front of you (which makes it really difficult to focus on features without getting seasick) you are actually rotating with the tank.

It is very difficult to capture on video or photo, but Pierre and I are doing our best.

Stay tuned for a nice Ekman movie coming up soon!

Ship-generated internal waves

A tank experiment showing ship-generated internal waves.

When entering a fjord from the open ocean by ship, it can sometimes be noted that the speed of the ship changes even though apparently nothing else changed – the wind didn’t change, the position of the sails didn’t change, the settings on the engine didn’t change – whatever was driving the ship didn’t change. And yet, the ship slowed down. How can that be?

According to the legend (that I like to propagate in my classes), when this phenomenon was first noticed, people attributed it to sea monsters latching onto the ship and slowing it down. Or if not monsters, than at least mollusks and other not-quite mostery monsters. But then Bjerknes came along and, together with Ekman, set up experiments that explain what is taking all the energy away from propulsion. I’ll give you a hint:

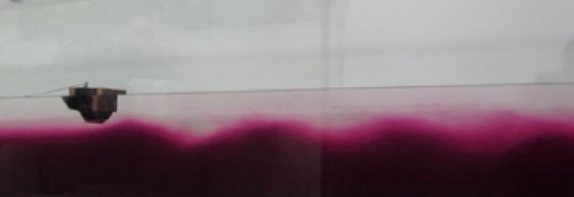
Yes – the ship excites internal waves at a density interface. Since the stratification in a fjord is much stronger than in the ocean, driving into a fjord means loosing a lot more energy towards the generation of internal waves.

See the movie here:

Langmuir circulation, take 2

Attempt at mechanistic understanding of Langmuir circulation.

After  complaining about how I didn’t have mechanistic understanding of Langmuir circulation recently, and how I was too lazy to do a real literature search on it, my friend Kristin sent me a paper that might shed light on the issue. And it did! So here is what I think I understand (and please feel free to jump in and comment if you have a better explanation).

First, let’s recap what we are talking about. My friend Leela (and it was so nice to have her visit!!!) and I observed this:

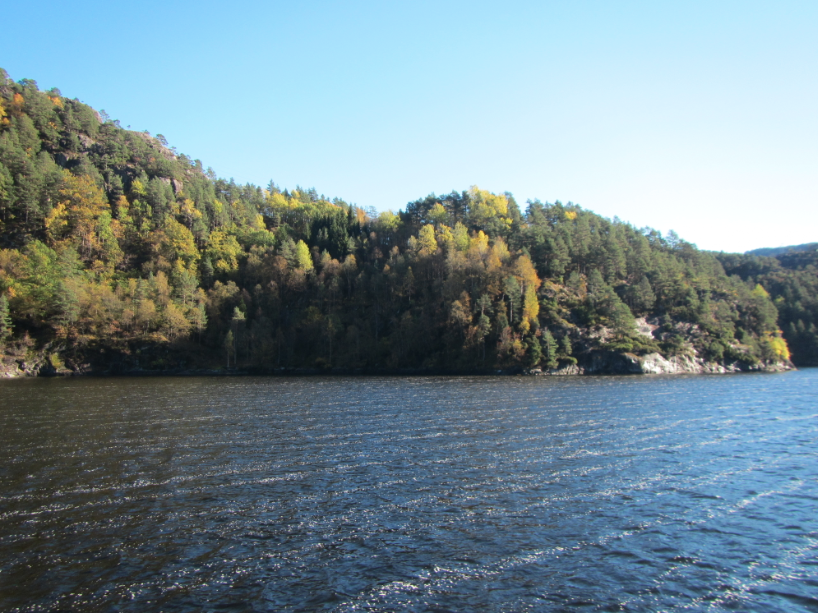
Long rows of foam on the surface of the fjord, more or less aligned with the direction of the wind (we couldn’t tell for sure since we were on a moving boat, and since it was a tourist cruise we couldn’t ask them to stand still for a minute to satisfy our oceanographic curiosity). Foam is – and so much makes sense – accumulated in regions of surface convergence.

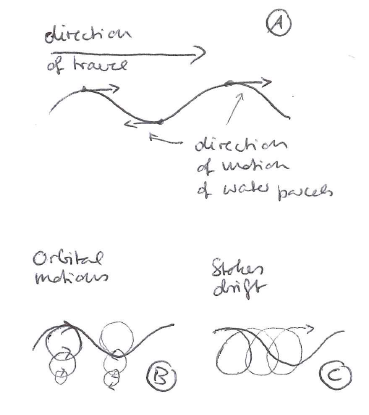
But let’s see. The explanation that Kristin forwarded me is from the paper “Upper ocean mixing” by J.N. Moum and W.D. Smyth for Academic Press Encyclopedia of Ocean Sciences, 2000According to my understanding of their paper and others, Langmuir circulation is related to Stokes drift.

Stokes drift is the small current in the direction of wave propagation that is caused by orbital wave motions not being completely closed (even though they are as a first order explanation, and that’s what you always learn when you think about rubber ducks not being laterally moved by waves).

As the wave orbital motions decrease with depth, there is a shear in the Stokes drift, with strongest velocities being found at the surface. At the same time, if there are small disturbances in the wind field, there are small inhomogeneities in the resulting surface current, hence shear that generates vertical vorticity.

The combination of horizontal and vertical vorticity causes counterrotating vortices at the ocean surface. The convergences between two adjacent rows concentrate the wind-driven surface current into a jet at the convergence, hence providing a positive feedback.

Voila: Stokes drift!

Velocity of shallow water waves.

The experiment we run to discuss the velocity of shallow water waves.

In this post, I discussed how it took us several years to modify an experiment to make it both student and teacher-friendly. But what can you actually see in that experiment?

The movies below show the type of standing waves that are excited in the tank. This movie for 24 cm water depth (Ha – this is going to come back and haunt me! I’m not actually sure what the water depth in this experiment is. It looks like this is the case with the highest water level we have run. But if you want to know for sure go ahead, measure the period, calculate the phase velocity (the tank is 175 cm long) and then calculate the water depth. Good practice! ;-))

And then this movie shows the experiment with a lower water level (12 cm? 8? I don’t remember).

It’s interesting to see how much more difficult it is to excite a nice standing wave if you have less water in the tank. Intuitively that makes sense, but does anyone have a good, not-too-theoretical explanation?

Seesawing of standing waves.

Improving one of the experiments run in the GEOF130 lab.

One experiment that has been run in GEOF130 forever is the “standing wave”, where a wave is excited in a long and narrow tank and then, for different water depths, the period is measured and the velocity calculated in order to compare it to the one calculated from the shallow water wave equation.

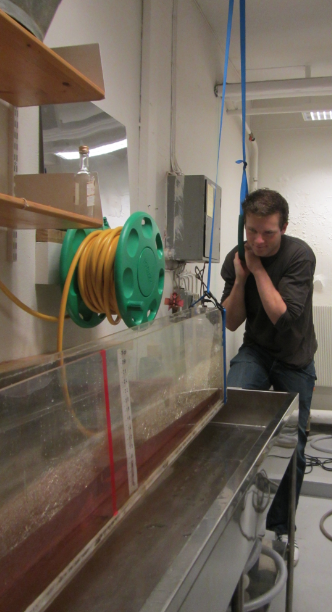
Traditionally, the standing wave is excited by lifting one end of the tank, letting the water settle down, and carefully putting the tank back down. This, however, means that someone has to lift a pretty heavy weight. So Pierre and I were quite proud of ourselves when we constructed a pulley system last year and now instead of lifting the weight up, someone could hang on a rope instead.

However, this was still hard work, and even though the picture shows a student doing the lifting, for most lab groups it was actually Pierre who did it.

But then this year, we came up with a much simpler solution and I don’t know how we didn’t see this before now. As Pierre remarked: We talk about seesawing standing waves ALL THE TIME. How did it not occur to us that the simplest setup would be a seesaw? So now we have two wooden blocks underneath the tank, one supporting it in the middle and one underneath the end where the operator is standing. So all that needs to happen now is a slight lift of the tank and then a slight downward push to bring it back in the horizontal.

So much easier!

Fjord circulation

Tank experiment on a typical circulation in a fjord.

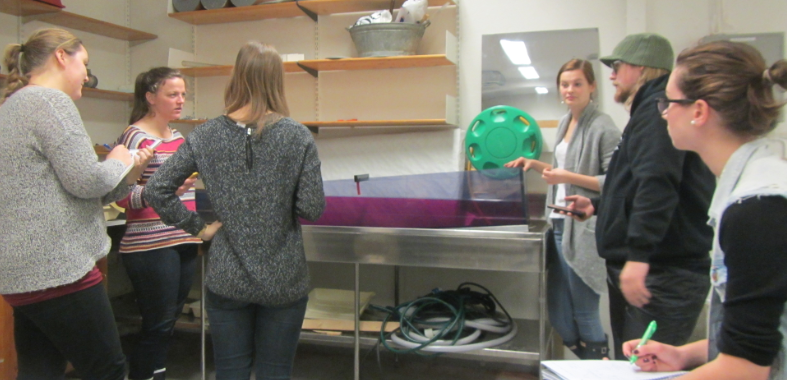
Traditionally, a fjord circulation experiment has been done in GEOF130’s student practicals. Pierre and I recently met up to test-run the experiment before it will be run in this year’s course.

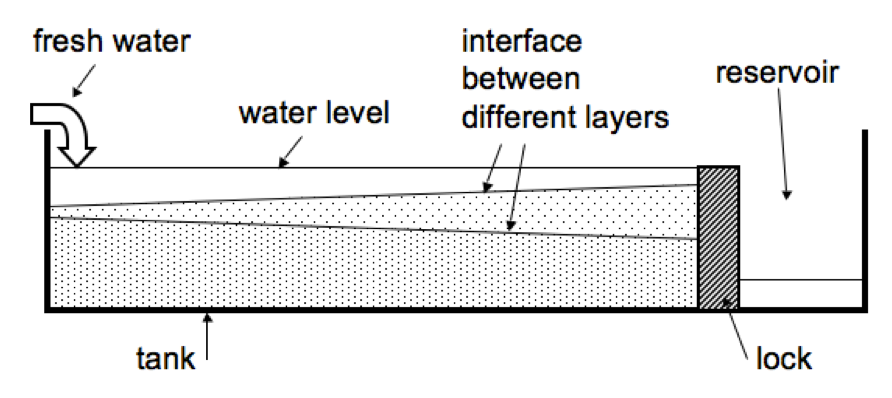
This is the setup of the experiment: A long and narrow tank, filled with salt water, a freshwater source at one end and an outlet at the other end. This sets up a circulation from the head towards the mouth of the fjord close to the surface, and a deep return flow.

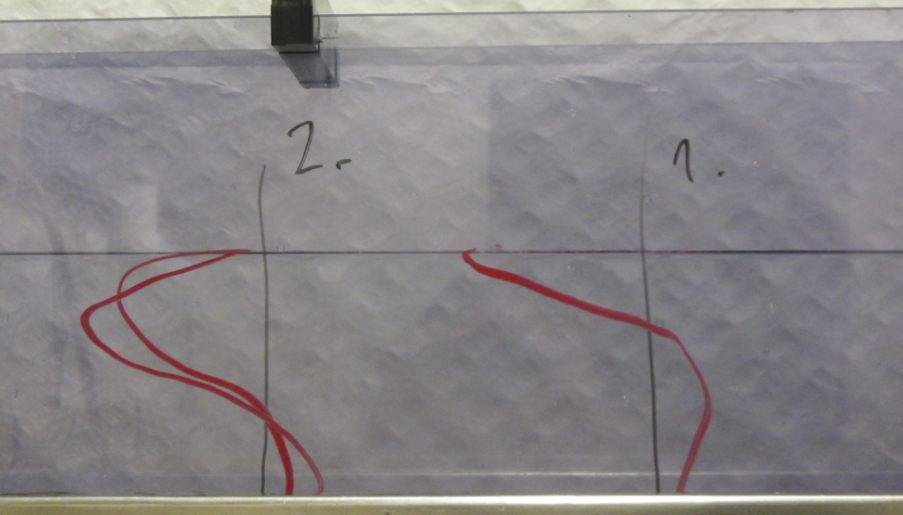
Watch the movie below to see how different circulations are set up depending on the depth of the freshwater source. As in the picture, velocity profile 1 is for the case where freshwater is being added close to the surface, and in case 2 the freshwater is being added deeper down.

Langmuir circulation

We think we observed Langmuir circulation, but we don’t understand the mechanism causing it.

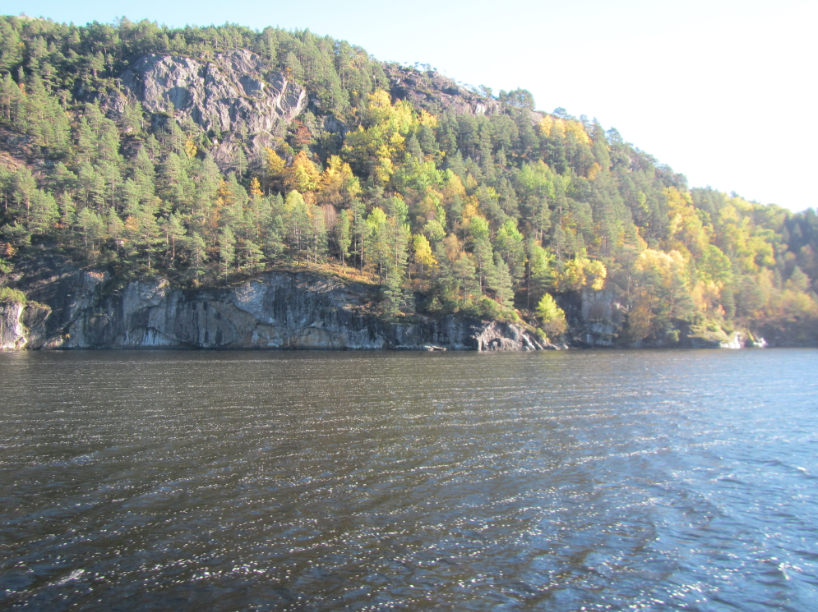
Recently, my friend Leela came to visit Bergen and we went on a fjord cruise to make the most of a sunny October day. We observed foam streaks on the fjord. The structures were long and persistent, and being the oceanographers we are, of course we knew that they had to have been caused by Langmuir circulation.

Langmuir circulation on Østerfjorden, Norway.

But then we started wondering about the mechanism driving the Langmuir circulation. Textbook knowledge tells us that Langmuir cells are spiraling rows with convergences (the foamy stripes) and divergences (in between the foamy stripes) at the surface. They are, according to common knowledge, caused by wind that has persistently blown over the surface for more than some 10 hours, and by Ekman processes. Plus there might be some interaction with waves.

IMG_5674

More Langmuir circulation

But that’s about where my knowledge ends, and I have absolutely no mechanistic understanding of Langmuir circulation. Literature research was unsuccessful (at least in the period of time I was willing to spend on this), a quick poll of my colleagues didn’t help, so now I am turning to you, dear readers: Do you have a simple mechanism for me that explains Langmuir circulation? Please help!

Types of breaking waves depending on steepness of slope – small scale

Video of different types of breakers – small scale.

In this recent post we talked about types of breakers depending on the steepness of the slope. But even on a single stretch of coast line you can easily observe several kinds of breakers. My friend E lend her cabin on an island just outside of Bergen to me and another friend E for the weekend, and just sitting on the rocks we could observe at least two types of breakers.

Different types of “breakers” depending on the slope of the beach. Also see video below where it might become more clear…

In the movie below, you see surging breakers on the first little headland – the water level just raises and falls and no breaking occurs – whereas in the small bay behind the headland and on the next headland the slope is much less steep and here spilling breakers develop. Spilling breakers can also be seen about halfway through the movie on the right hand side beach. Isn’t it awesome how you can see so many concepts on the smallest scales once you start looking for them?

Waves breaking depending on steepness of the slope

Waves breaking on slopes of different steepnesses.

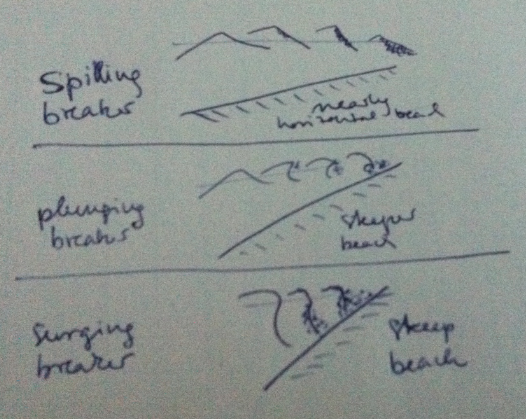
Depending on a slope’s steepness, waves can break in very different ways. On nearly horizontal beaches, spilling breakers develop. On steeper beaches, plunging breakers, the kind of breakers that form the tunnels that people surf in, form. And on very steep beaches, the breakers don’t actually break, but surge up and down.

Types of breakers developing on beaches depending on the beach’s slope.

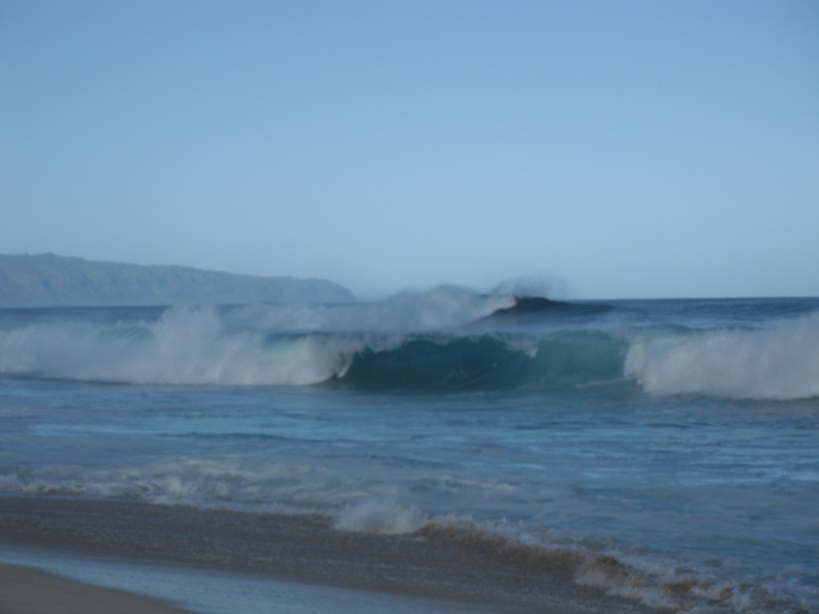
This can be seen on  the large scale when different beaches are known for different kinds of breakers, and one impressive example are Oahu’s North Shore plunging breakers that my friend Tobi took me and a couple of friends to see in 2010.

Plunging breakers on Oahu’s North Shore in September 2010.


DSCF0384

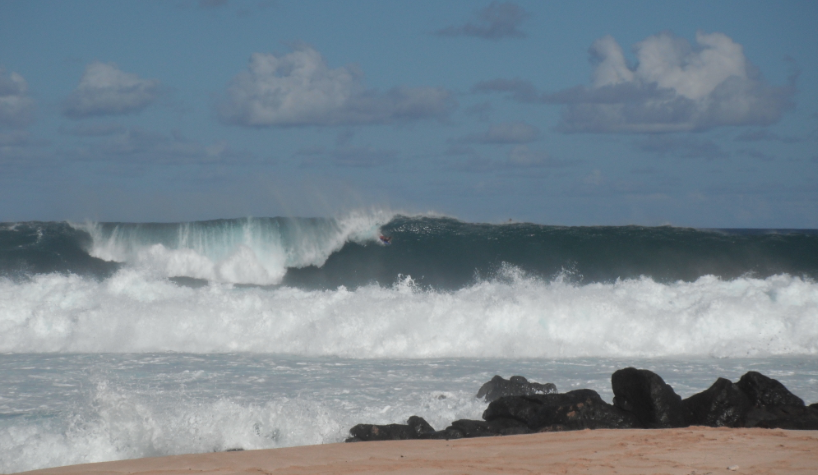
Another plunging breaker on Oahu’s North Shore. See surfer for scale.

More awesome breakers were to be seen on the Big Island a couple of days later:

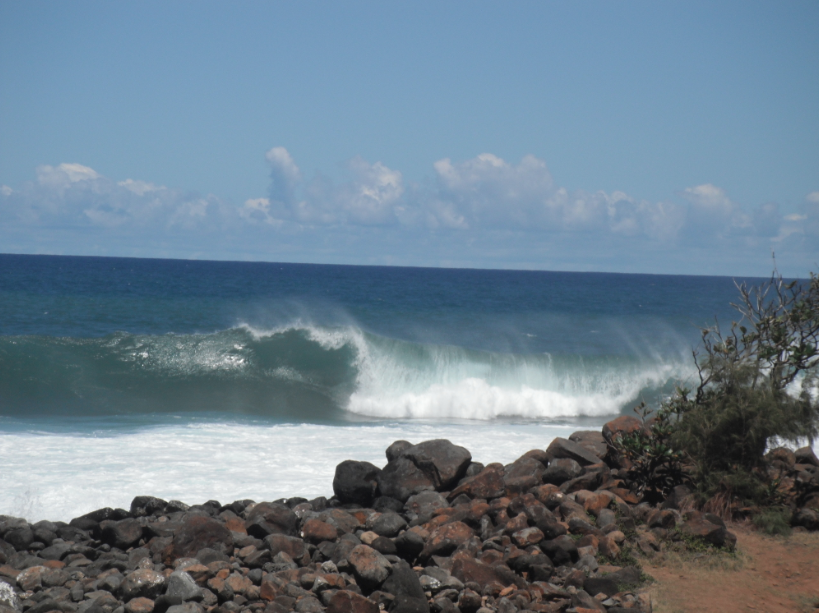
Plunging breakers on Big Island in September 2010.

And of course I have movies of those breakers for you, too, first Oahu and then Big Island: